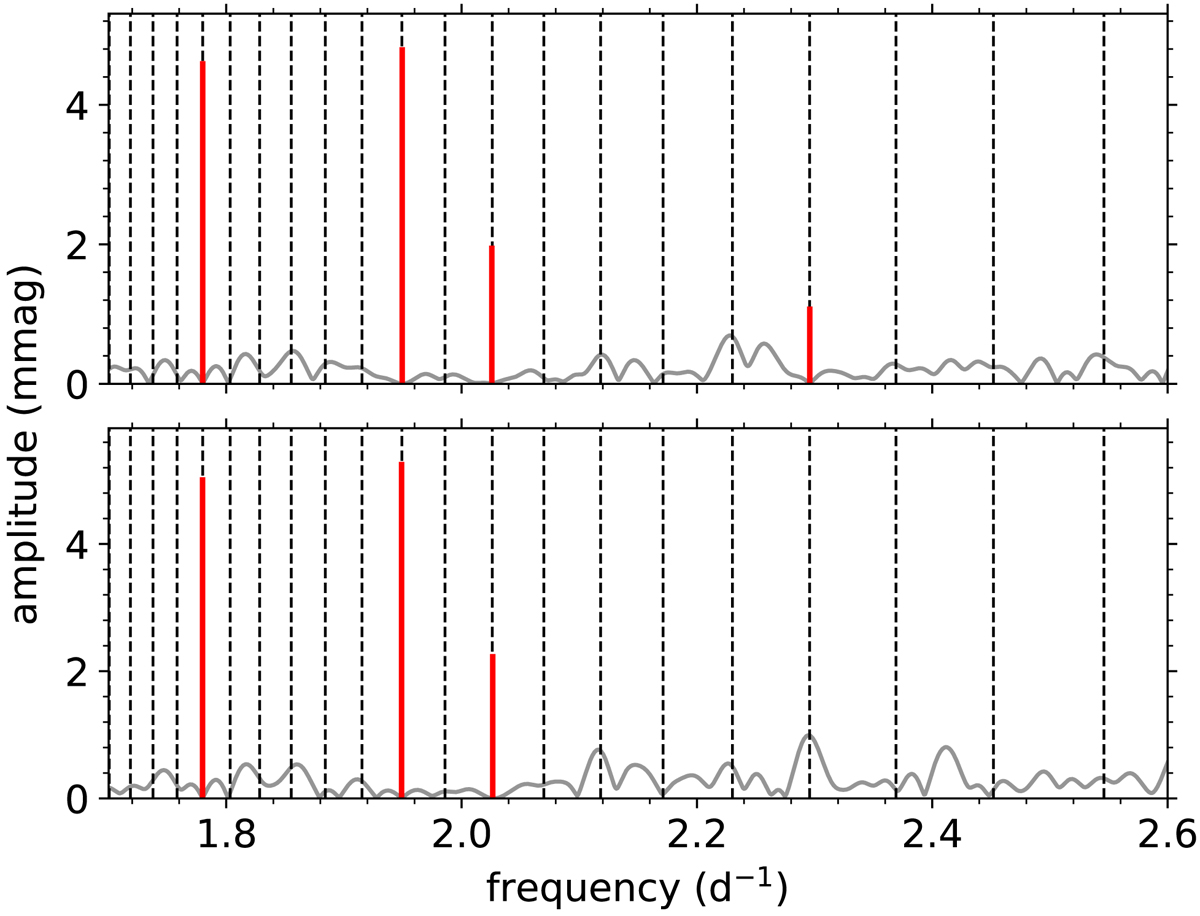
Fig. 4.
Download original image
Best-fitting asymptotic g-mode pattern (dashed lines), with the measured independent pulsation frequencies (red full lines) and the Fourier transform of the residual light curve after prewhitening the measured pulsation frequencies. This is shown for both the full light pulsation curve (top) and the out-of-eclipse pulsation light curve (bottom).
Current usage metrics show cumulative count of Article Views (full-text article views including HTML views, PDF and ePub downloads, according to the available data) and Abstracts Views on Vision4Press platform.
Data correspond to usage on the plateform after 2015. The current usage metrics is available 48-96 hours after online publication and is updated daily on week days.
Initial download of the metrics may take a while.