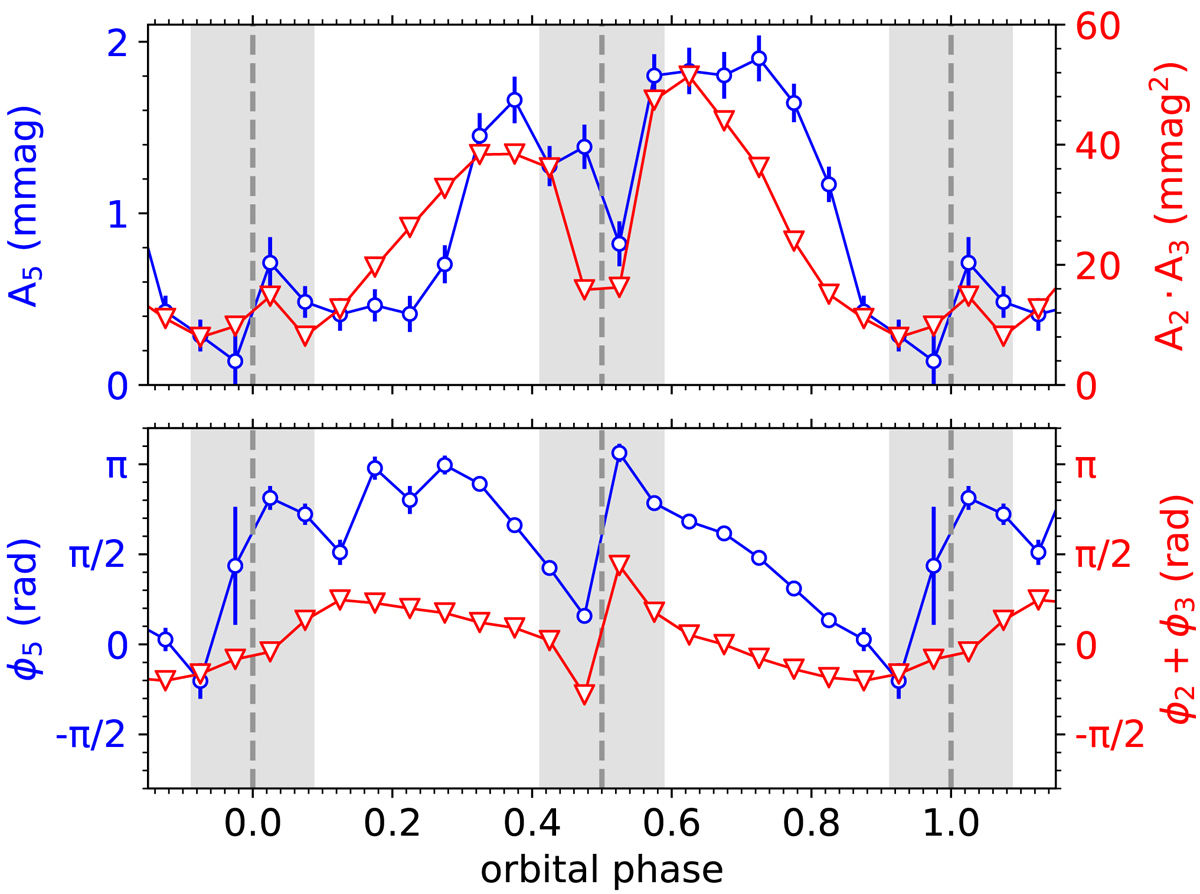
Fig. 6.
Download original image
Amplitude (top) and phase (bottom) variability of the combination frequency ν5 = ν2 + ν3 (blue circles), measured from the out-of-eclipse residual light curve, as a function of the orbital phase. These are compared with the relative amplitude scaling factor A2 ⋅ A3 and the sum of the parent frequency phases ϕ2 + ϕ3 (red downward triangles; e.g. Buchler et al. 1997; Vuille & Brassard 2000).
Current usage metrics show cumulative count of Article Views (full-text article views including HTML views, PDF and ePub downloads, according to the available data) and Abstracts Views on Vision4Press platform.
Data correspond to usage on the plateform after 2015. The current usage metrics is available 48-96 hours after online publication and is updated daily on week days.
Initial download of the metrics may take a while.