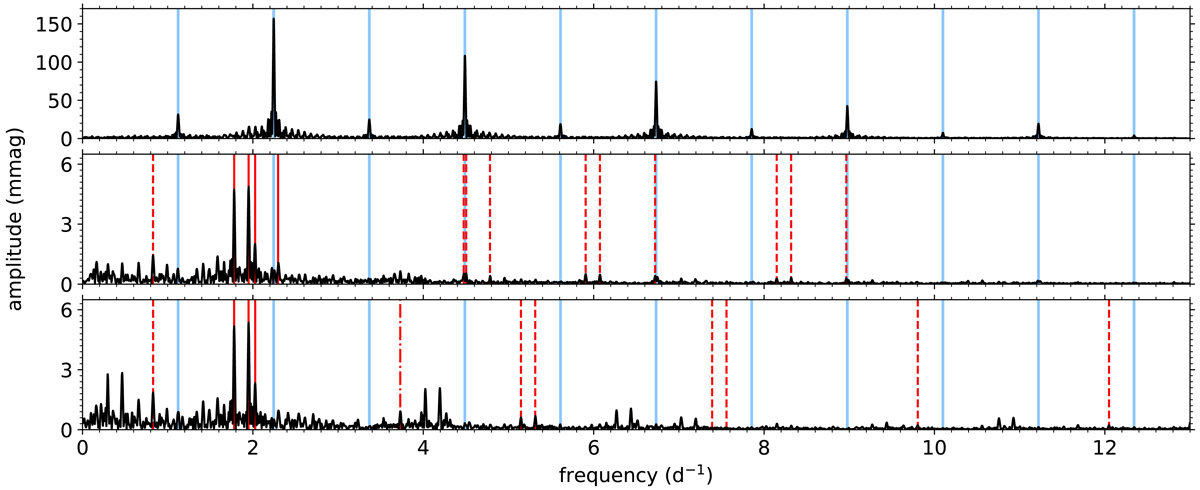
Fig. 3.
Download original image
Lomb-Scargle periodograms of the reduced light curve of V456 Cyg. Top: periodogram of the full reduced light curve of V456 Cyg, with the harmonics of the orbital frequency νorb indicated by full light-blue lines. Middle: periodogram of the full pulsation light curve. The frequencies that were detected from this light curve (νa to νn in Table 2) are marked in red. Full and dashed lines mark the independent frequencies and combination frequencies, respectively. Bottom: periodogram of the out-of-eclipse part of the pulsation light curve. The frequencies that were detected from this light curve (ν1 to ν11 in Table 2) are marked in red. Full and dashed lines mark the independent frequencies and combination frequencies, respectively. The dash-dotted line is the only combination frequency that does not include the orbital frequency νorb.
Current usage metrics show cumulative count of Article Views (full-text article views including HTML views, PDF and ePub downloads, according to the available data) and Abstracts Views on Vision4Press platform.
Data correspond to usage on the plateform after 2015. The current usage metrics is available 48-96 hours after online publication and is updated daily on week days.
Initial download of the metrics may take a while.