Free Access
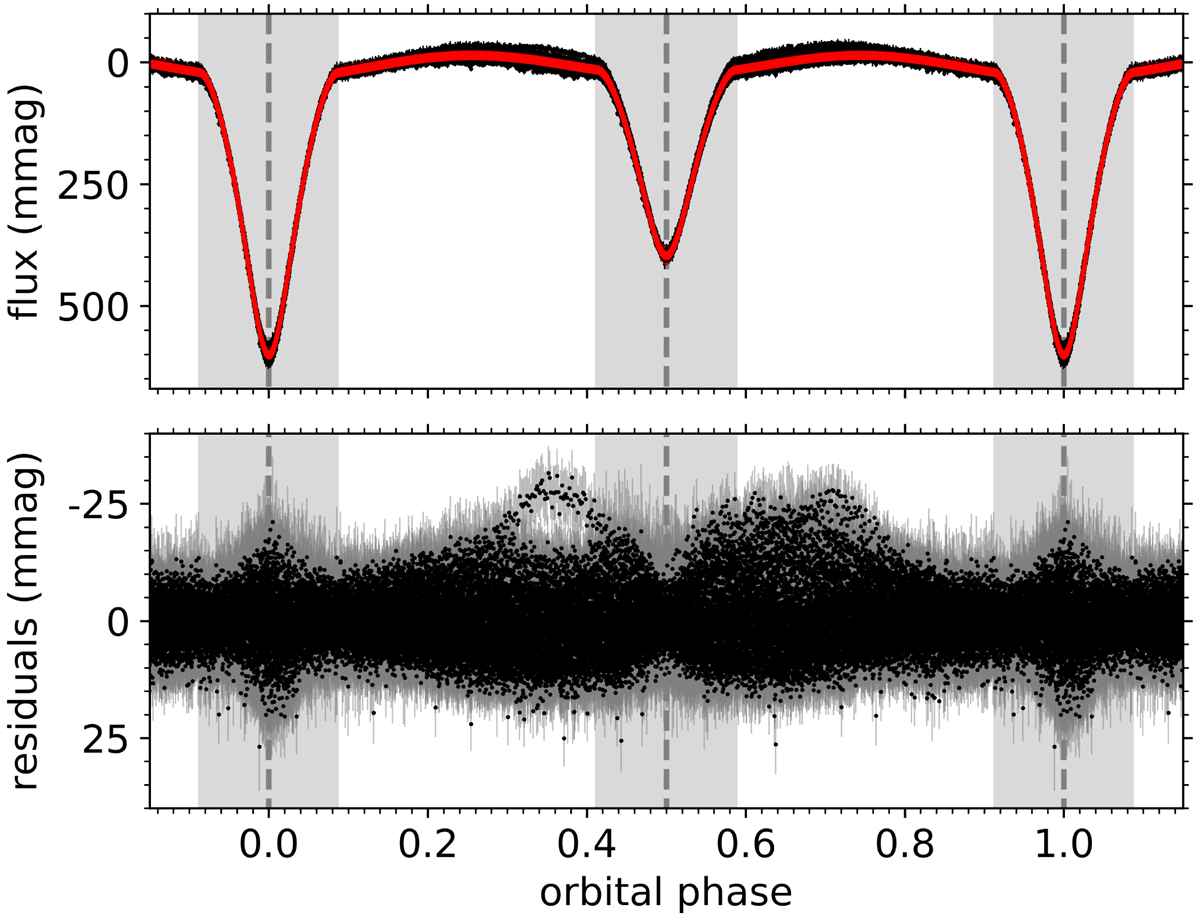
Fig. 2.
Download original image
Reduced light curve of V456 Cyg, phase-folded over the binary orbit. The eclipses are indicated in grey. Top: original light curve (black) with the best-fitting binary model (red). Bottom: residual light curve, called the pulsation light curve in this work.
Current usage metrics show cumulative count of Article Views (full-text article views including HTML views, PDF and ePub downloads, according to the available data) and Abstracts Views on Vision4Press platform.
Data correspond to usage on the plateform after 2015. The current usage metrics is available 48-96 hours after online publication and is updated daily on week days.
Initial download of the metrics may take a while.