Free Access
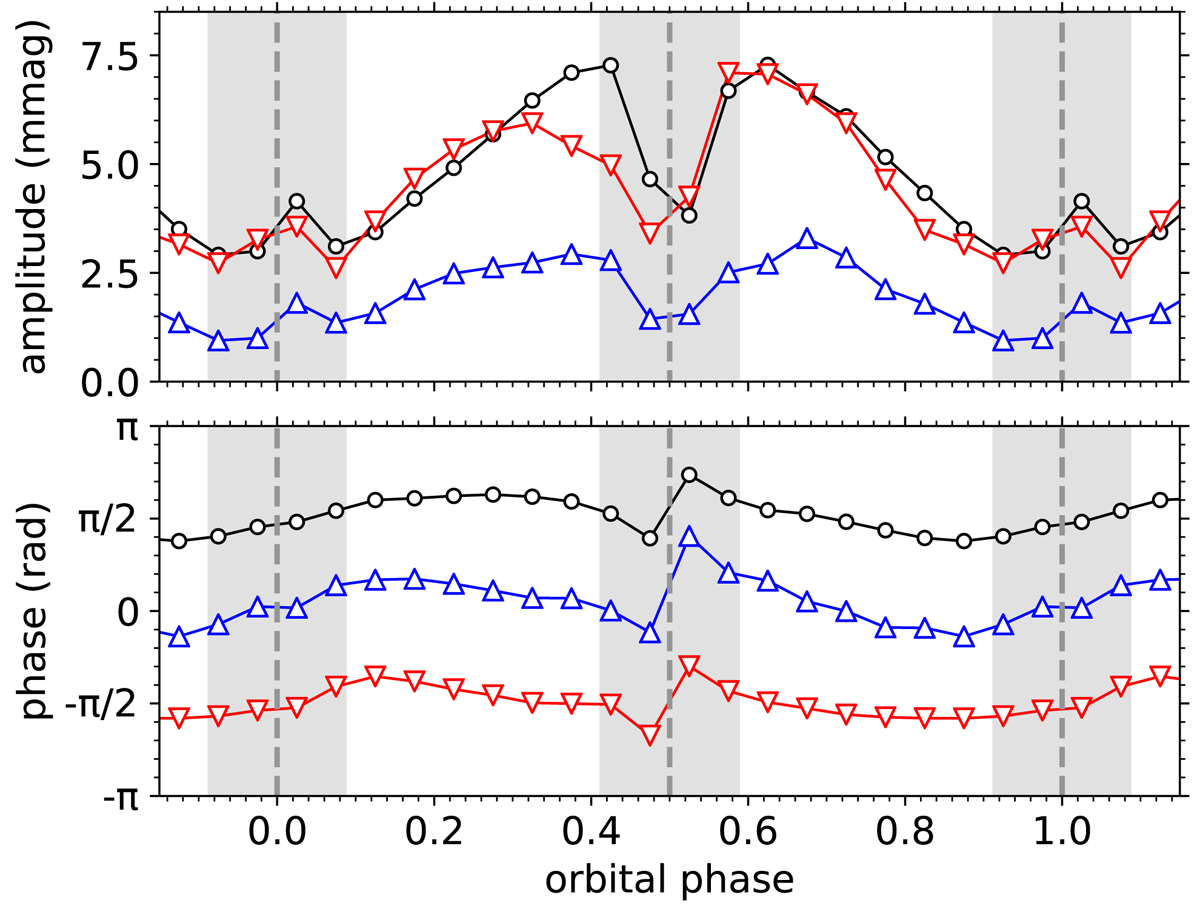
Fig. 5.
Download original image
Amplitude (top) and phase (bottom) variability of the three dominant independent pulsations of V456 Cyg, measured from the out-of-eclipse residual light curve: ν2 (red downward triangles), ν3 (black circles) and ν4 (blue upward triangles). The eclipses are indicated in grey, with a dashed line marking their centres.
Current usage metrics show cumulative count of Article Views (full-text article views including HTML views, PDF and ePub downloads, according to the available data) and Abstracts Views on Vision4Press platform.
Data correspond to usage on the plateform after 2015. The current usage metrics is available 48-96 hours after online publication and is updated daily on week days.
Initial download of the metrics may take a while.