| Issue |
A&A
Volume 652, August 2021
|
|
|---|---|---|
| Article Number | A66 | |
| Number of page(s) | 26 | |
| Section | Extragalactic astronomy | |
| DOI | https://doi.org/10.1051/0004-6361/202039696 | |
| Published online | 11 August 2021 | |
ALMA multiline survey of the ISM in two quasar host–companion galaxy pairs at z > 6
1
Dipartimento di Fisica e Astronomia, Alma Mater Studiorum, Università di Bologna, Via Gobetti 93/2, 40129 Bologna, Italy
e-mail: This email address is being protected from spambots. You need JavaScript enabled to view it.
2
INAF-Osservatorio di Astrofisica e Scienza dello Spazio, Via Gobetti 93/3, 40129 Bologna, Italy
3
Max-Planck-Institut für Astronomie, Königstuhl 17, 69117 Heidelberg, Germany
4
National Radio Astronomy Observatory, Pete V. Domenici Array Science Center, PO Box O, Socorro, NM 87801, USA
5
Argelander-Institut für Astronomie, University at Bonn, Auf dem Hügel 71, 53121 Bonn, Germany
6
Steward Observatory, University of Arizona, 933 North Cherry Avenue, Tucson, AZ 85721, USA
7
Max Planck Institut für Astrophysik, Karl–Schwarzschild–Straße 1, 85748 Garching bei München, Germany
8
Department of Astronomy, School of Physics, Peking University, 5 Yiheyuan Road, Haidian District, Beijing 100871, PR China
9
Kavli Institute for Astronomy and Astrophysics, Peking University, 5 Yiheyuan Road, Haidian District, Beijing 100871, PR China
10
European Southern Observatory, Alonso de Córdova 3107, Casilla 19001, Vitacura, Santiago 19, Chile
11
Department of Astronomy, Cornell University, Space Sciences Building, Ithaca, NY 14853, USA
12
Department of Astrophysical Sciences, Princeton University, Princeton, NJ 08544, USA
13
Max-Planck-Institut für Radioastronomie, Auf dem Hügel 69, 53121 Bonn, Germany
14
Korea Astronomy and Space Science Institute, 776 Daedeokdae-ro, Yuseong-gu, Daejeon 34055, Korea
Received:
16
October
2020
Accepted:
18
May
2021
Abstract
We present a multiline survey of the interstellar medium (ISM) in two z > 6 quasar host galaxies, PJ231−20 (z = 6.59) and PJ308−21 (z = 6.23), and their two companion galaxies. Observations were carried out using the Atacama Large (sub-)Millimeter Array (ALMA). We targeted 11 transitions including atomic fine-structure lines (FSLs) and molecular lines: [NII]205 μm, [CI]369 μm, CO (Jup = 7, 10, 15, 16), H2O 312 − 221, 321 − 312, 303 − 212, and the OH163 μm doublet. The underlying far-infrared (FIR) continuum samples the Rayleigh-Jeans tail of the respective dust emission. By combining this information with our earlier ALMA [CII]158 μm observations, we explored the effects of star formation and black hole feedback on the ISM of the galaxies using the CLOUDY radiative transfer models. We estimated dust masses, spectral indexes, IR luminosities, and star-formation rates from the FIR continuum. The analysis of the FSLs indicates that the [CII]158 μm and [CI]369 μm emission arises predominantly from the neutral medium in photodissociation regions (PDRs). We find that line deficits agree with those of local luminous IR galaxies. The CO spectral line energy distributions (SLEDs) reveal significant high-J CO excitation in both quasar hosts. Our CO SLED modeling of the quasar PJ231−20 shows that PDRs dominate the molecular mass and CO luminosities for Jup ≤ 7, while the Jup ≥ 10 CO emission is likely driven by X-ray dissociation regions produced by the active galactic nucleus (AGN) at the very center of the quasar host. The Jup > 10 lines are undetected in the other galaxies in our study. The H2O 321 − 312 line detection in the same quasar places this object on the LH2O − LTIR relation found for low-z sources, thus suggesting that this water vapor transition is predominantly excited by IR pumping. Models of the H2O SLED and of the H2O-to-OH163 μm ratio point to PDR contributions with high volume and column density (nH ∼ 0.8 × 105 cm−3, NH = 1024 cm−2) in an intense radiation field. Our analysis suggests a less highly excited medium in the companion galaxies. However, the current data do not allow us to definitively rule out an AGN in these sources, as suggested by previous studies of the same objects. This work demonstrates the power of multiline studies of FIR diagnostics in order to dissect the physical conditions in the first massive galaxies emerging from cosmic dawn.
Key words: galaxies: high-redshift / galaxies: ISM / quasars: emission lines / quasars: supermassive black holes
© ESO 2021
1. Introduction
Quasars (or QSOs) beyond redshift z ∼ 6 (when the age of the Universe was younger than 1 Gyr) are the most luminous nontransient sources in the Universe and are thought to be the progenitors of present-day early-type massive galaxies. The very high luminosities (Lbol > 1013 L⊙) from their active galactic nuclei (AGN) are powered by rapid accretion of matter (> 10 M⊙ yr−1) onto central supermassive black holes (BHs, MBH ≳ 108 M⊙; Jiang et al. 2007; De Rosa et al. 2011; Mazzucchelli et al. 2017a) and are often accompanied by rapid consumption of huge gas reservoirs through vigorous episodes of star formation (SFR > 100 M⊙ yr−1; see, e.g., Bertoldi et al. 2003a,b; Walter et al. 2003, 2009; Venemans et al. 2018). Therefore the host galaxies of z > 6 quasars are ideal laboratories for characterizing the physical properties of the interstellar medium (ISM) in these extreme conditions. They also provide crucial insights into the interplay between star formation and black hole accretion in massive galaxies emerging from cosmic dawn.
The range of redshift z > 6 is of particular interest as galaxies emerge from the last phase transition of the Universe. This transition is marked by a rapid shift in the ionization properties of the intergalactic medium (Fan et al. 2006a; Becker et al. 2015). Through efforts of various groups using wide-field surveys (see, e.g., Fan et al. 2006b; Bañados et al. 2016; Jiang et al. 2016; Matsuoka et al. 2018, and references therein), ∼200 quasars have been discovered at z > 6, including the three most distant quasars known at z > 7.5 (Bañados et al. 2018; Yang et al. 2020a; Wang et al. 2021). The very presence of these BHs at these early epochs requires a rapid buildup of black holes and galaxy assembly, which challenges our understanding of how BHs form in the first place (e.g., Volonteri 2012; Sijacki et al. 2015; Habouzit et al. 2019; van der Vlugt & Costa 2019).
Models and numerical simulations of massive black hole formation predict that z > 6 quasars reside at the extreme peaks of the large-scale density structure (e.g., Begelman et al. 2006; Overzier et al. 2009; Bonoli et al. 2009, 2014; Angulo et al. 2012; Costa et al. 2014), and z > 6 quasars can therefore be used to identify the first galaxy overdensities. The question whether there are in fact overdensities of galaxies around z ∼ 6 quasars is contested, however (e.g., Overzier et al. 2009; Morselli et al. 2014; Balmaverde et al. 2017; Farina et al. 2017; Mazzucchelli et al. 2017b; Decarli et al. 2019a). On a smaller scale (∼100 pkpc), the exceptional sensitivity and imaging power of the Atacama Large (sub-)Millimeter Array (ALMA) has allowed us to image the dust and cold-gas reservoir of galaxies in the early Universe, leading to strong evidence of overdensities around z > 5 − 6 quasars (e.g., Decarli et al. 2017; Trakhtenbrot et al. 2017; Willott et al. 2017; Neeleman et al. 2019; Venemans et al. 2019), supported by the intriguingly serendipitous discoveries of starburst and submillimeter galaxies (SMGs) in the close environment of the quasars, which have high star formation rates (SFR > 500 − 1000 M⊙ yr−1) and show no evidence of BH accretion (Decarli et al. 2017; Mazzucchelli et al. 2019; but see also Connor et al. 2019, 2020; Vito et al. 2019 for tentative evidence of X-ray emission from these companions).
In this context, these quasar host–companion galaxy pairs represent a unique testing ground to study star formation, AGN feedback, and structure growth in galaxies at z > 6. Multiline surveys of the ISM in these systems provide key diagnostics of the physical properties of the ISM, including densities, and the source of the powering radiation field (see Carilli & Walter 2013, for a review). For high-redshift galaxies, many atomic and molecular far-infrared (FIR) emission lines fall in the (sub-)mm bands, thus making them accessible to sensitive ground-based facilities such as ALMA or the Northern Extended Millimeter Array (NOEMA). Previous studies have detected galaxy dust continuum and gas emission lines even in highest redshift quasars. These studies have mainly targeted the brightest emitters such as the fine-structure line (FSL) of singly ionized carbon [CII]158 μm, and the rotational transitions of carbon monoxide (CO; see, e.g., Walter et al. 2003, 2004, 2009; Maiolino et al. 2005, 2009, 2015; Wang et al. 2010, 2013; Willott et al. 2015a,b; Gallerani et al. 2014; Carniani et al. 2017, 2019; Decarli et al. 2017, 2018; Venemans et al. 2017a,b,c, 2019; Feruglio et al. 2018), and have revealed the ubiquitous presence of massive cold-gas (Mgas ≳ 1010 M⊙) and dust (Mdust ≳ 109 M⊙) reservoirs in high-z quasar host galaxies. [CII]158 μm and the low-/mid-J CO transitions (rotational quantum number of the CO molecule upper levels Jup < 7 − 8) are the major coolants of the atomic and molecular ISM, respectively. The potential ionization energy of the C+ ion is slightly lower than that of atomic hydrogen (H), thus it traces both the atomic neutral and ionized phase of the ISM. Its 158 μm transition predominantly arises from photodissociation regions (PDRs, see Hollenbach & Tielens 1999 for a review) at the interface between the atomic and molecular media in the outskirts of molecular clouds in galaxy star-forming regions (see, e.g., Díaz-Santos et al. 2017). On the other hand, CO is the most abundant molecule of the ISM after H2 and requires little energy to be excited. Its low- and mid-J upper levels can therefore easily be populated by collisions with H2. It therefore represents the best observational tracer of cold molecular ISM embedded in clouds (with a hydrogen density of nH ∼ 103 cm−3 and a kinetic gas temperature of T < 100 K).
Multiple atomic FSLs and molecular transitions arising from different ISM phases provide direct and indirect information on the ionized phase in the proximity of young (O and B) stars (e.g., the doubly ionized oxygen [OIII]88 μm and the singly ionized nitrogen [NII]122 μm, 205 μm) or the denser and warm phases buried in the cores of molecular clouds (e.g., the rotational transitions of high-J CO, water vapor H2O, and hydroxyl and its anion (hydroxide) OH, OH+). Recent studies have started to probe these diagnostics in a few z > 6 systems (e.g., Riechers et al. 2009, 2013; Strandet et al. 2017; Venemans et al. 2017b,c; Walter et al. 2018; Hashimoto et al. 2019a,b; Novak et al. 2019; Wang et al. 2019; Yang et al. 2019a; Li et al. 2020a,b).
This work is focused on the ISM characterization of two z > 6 quasar host galaxies, PJ231−20 at z ∼ 6.59, and PJ308−21 at z ∼ 6.24, and the nearby companions that were serendipitously discovered with ALMA (Decarli et al. 2017; Neeleman et al. 2019). These companions are among the most star-forming galaxies known to date (with [CII]–based SFR ≳ 200 − 500 M⊙ yr−1) at z > 6 that do not show evidence of AGN activity in the rest-frame optical/UV (Decarli et al. 2017; Mazzucchelli et al. 2019) and in the X-rays (Connor et al. 2019, 2020). For these objects, the [CII]158 μm line and dust continuum have clearly been detected with previous ALMA observations (Decarli et al. 2017), while higher-resolution [CII]158 μm follow-up observations have allowed us to study of their kinematics (see Decarli et al. 2019b; Neeleman et al. 2019). The companion galaxies in the two systems have a projected separation of ∼8.5 kpc and ∼14 kpc, with a velocity offset of +137 km s−1 and +591 km s−1 for PJ231−20 and PJ308−21, respectively. Remarkably, the [CII]158 μm emission of the companion galaxy in the PJ308−21 system stretches over about 25 kpc and > 1500 km s−1 toward and beyond the quasar host, suggesting that the satellite galaxy is tidally stripped by the interaction with the central quasar host galaxy (Decarli et al. 2017, 2019b). Furthermore, in the systems PJ231−20 and PJ308−21, Lyα nebular emission has recently been discovered (Farina et al. 2019). This might indicate that the PJ231−20 quasar also recently underwent a merger event with the close companion galaxy.
Here we present ALMA band 3−6 observations of the PJ231−20 and PJ308−21 systems, in which we sampled the FIR dust continuum and various emission lines probing different ISM phases and conditions. The lines include the FSLs of singly ionized atomic nitrogen [NII]205 μm and neutral carbon [CI]369 μm, tracers of the low-density fully ionized medium (electron density ne ≲ 1 cm−3), and the cold dense atomic phase of the ISM (nH ∼ 103 cm−3). We also present observations of the molecular transitions of CO at intermediate and high-J (7−6, 10−9, 15−14, 16−15), three water vapor (ortho-)H2O rotational transitions (312 − 221, 321 − 312, and 303 − 212), and the hydroxyl molecule OH163 μm doublet, which are associated with the warm dense phase of the ISM (nH ≳ 105 cm−3, T > 100 K). Combining the different pieces of information and making use of radiative transfer models, we study a variety of the physical properties of the dust and gas-phase ISM in the quasar hosts and companion galaxies. This allows us to distinguish line excitation by star formation and AGN processes. This study provides an overview of the complex conditions of the multiphase ISM in galaxies at z ∼ 6.
The paper is organized as follows: in Sect. 2 we present the ALMA observations, and we describe the reduction of the data. In Sect. 3 we outline the analysis we conducted on the calibrated data, and we report FIR line emission and continuum measurements in the sources of systems PJ231−20 and PJ308−21. In Sect. 4 we describe the setup and the outputs of our CLOUDY models. In Sect. 5 we present and discuss the results we obtained from the dust continuum. Then, we dedicate Sect. 6 to the tracers of the ionized medium and the results we obtained from them, and in Sect. 7 we focus on the atomic medium and place constraints on its physical properties. In Sect. 8 we study the molecular phase of the ISM by analyzing the CO, H2O and OH lines. In Sect. 9 we estimate the various mass budgets of the different gas components. Finally, in Sect. 10 we summarize our results and draw our conclusions.
Throughout the paper, we assume a standard ΛCDM cosmology with H0 = 69.3 km s−1 Mpc−1, Ωm = 0.287, and ΩΛ = 1 − Ωm from Hinshaw et al. (2013).
2. Observations and data reduction
We present the ALMA Cycle 5 datasets of quasar PJ231−20, quasar PJ308−21 (hereafter QSO PJ231−20 and QSO PJ308−21, respectively) and their companion galaxies (program ID: 2017.1.00139.S, PI: R. Decarli) located at redshift z ∼ 6.59 and z ∼ 6.24, respectively. The observations were executed during April−August 2018 using 43−48 ALMA 12 m antennas in compact configurations (C43-2 and C43-3). The program comprised three frequency settings each in ALMA bands 4, 5, and 6 that covered nine atomic fine-structure and molecular lines: [NII]205 μm, high-J CO(10−9, 15−14, 16−15), H2O (303 − 212, 312 − 221, 321 − 312), the OH doublet, and the dust continuum emission. However, for PJ308−21, only the band 6 setup was executed. It encompasses CO(15−14, 16−15), H2O 303 − 212, and the OH163 μm doublet.
We also present follow-up ALMA Cycle 7 observations of the same objects (program ID: 2019.1.00147.S, PI: R. Decarli), in which we sampled the atomic FSL [CI]369 μm and the molecular mid-J CO(7−6) transition together with dust continuum emission in ALMA band 3. These observations were executed in October 2019 using 43−48 ALMA 12 m antennas in the C43-4 configuration. All the observations were designed not to spatially resolve the emission of each source, but have an angular resolution that was high enough to resolve the companions from the quasars. This allowed us to maximize the signal-to-noise ratio (S/N) within the beam. The angular resolution ranges between  and
and  . In Table 1 we summarize the ALMA observations, and in Table 2 we report the covered emission lines in each frequency setup together with their rest frequencies.
Information about targeted objects and characteristics of ALMA observations for each frequency setup.
Covered emission lines in each frequency setup with their rest frequency.
We performed data reduction using the default calibration pipeline with the Common Astronomy Software Applications (CASA, v.5.1.1-5 and v.5.6.1-8 for Cycle 5 and Cycle 7 data, respectively) package (McMullin et al. 2007). Calibrated visibilities were imaged using the CASA task tclean with a “natural” weighting scheme in order to maximize the sensitivity of the resulting maps. Dirty images were cleaned by employing two circular masks that were superimposed to include continuum emission of the central quasar and the companion. In the cleaning run, we stopped the procedure when the peak flux in the residual image within the mask dropped close to the root-mean-square (rms) noise of the image in regions without source emission (i.e., ∼1σ cleaning threshold). For each setup, we produced two image-frequency cubes for the lower side band (LSB) and the upper side band (USB), respectively, with a channel width of 40 km s−1. We obtained continuum images by combining the line-free channels from all spectral windows in multifrequency synthesis mode. The line-free channels were determined by inspecting the visibilities in all the frequency sidebands. When no line was detected, we selected line-free channels by adopting a line width of 300 km s−1 and source redshift based on the [CII]158 μm line observations published by Decarli et al. (2017). We used the CASA task uvcontsub to fit the continuum visibilities in the line-free channels, and we obtained continuum-subtracted cubes with 40 km s−1 of channel width. We fit the continuum emission in the LSB and USB separately (maximum bandwidth of ∼4 GHz) as a constant with frequency. This gave us two continuum-subtracted cubes for each frequency setup. In order to achieve Nyquist-Shannon sampling, we set the cube pixel sizes in the image plane to  , equal to ∼1/7 of the full width at half maximum (FWHM) of the minor axis of the ALMA-synthesized beam. In this way, we obtained cubes and continuum images with a pixel size of
  . Self-calibration was attempted but showed no additional improvement for any of the observations, so we did not use it for what follows. Finally, the continuum images and line cubes were corrected for the primary beam response. We supplemented our analysis with the ALMA Cycle 3 [CII]158 μm observations of PJ231−20 and PJ308−21 presented in Decarli et al. (2017) (program ID: 2015.1.01115.S), which we analyzed in a consistent way.
3. Line and continuum measurements
To obtain information on the different ISM phases and dust, we measured lines and continuum properties. The observed emission in the ALMA cubes was integrated over the beam and projected along the line of sight. If the source emission is not spatially resolved in the observation, the spectrum measured in the brightest pixel corresponds to the integrated spectrum of the source over its whole extension. By inspecting the continuum and the velocity-integrated line maps, we verified that the flux peak (measured in Jy beam−1 and Jy beam−1 km s−1, respectively) was consistent with the integrated flux over an aperture containing the observed emission for each object, even for high S/N and high angular resolution (such as the CO(7−6) line in PJ231−20 QSO in setup A). Therefore the targeted sources are (at best) marginally resolved in the observations. This conclusion, at least for system PJ231−20, is supported by measurements of the size of the continuum and [CII]158 μm line emitting region obtained from ALMA high angular resolution observations (Neeleman et al. 2019). This allowed us to safely perform a single-pixel analysis of the data. The uncertainties introduced by ignoring the aperture correction are comparable to the typical uncertainties (> 10%) ascribed to the line and continuum flux measurements taking the ALMA visibility calibration errors (∼20%) into account. Furthermore, we took advantage of the single-pixel analysis to maximize the S/N in the extracted spectra and to simultaneously minimize biases on the flux measurements that might arise from the blending of quasar and companion galaxy in the frequency setups at low angular resolution. Finally, we assessed that the different beam sizes of the various data cubes in the different ALMA bands did not significantly bias the flux estimates. To do so, we tapered the highest to the lowest spatial resolution data using the option restoringbeam within the CASA task tclean, and we verified that the flux measurements obtained from single-pixel analysis in the tapered data were consistent within the uncertainties with those estimated form the data cubes obtained by imaging all the calibrated visibilities. In particular, we obtained an additional data cube by imaging the calibrated visibilities of ALMA setup A of system PJ231−20 (which has the smallest restoring beam from the original data reduction) using a tapering scheme resulting in a restoring beam of  (similar to that of setup C, which has the lower angular resolution). In the case of PJ308−21 data, the beam sizes are comparable.
In this way, we identified the brightest pixel in the continuum map of each ALMA band and extracted the (beam-)integrated spectra of the quasars and the companion galaxies from the full data cubes (i.e., with the continuum inside) in the selected pixel. We then fit each spectrum as a constant representing the continuum1, and a Gaussian for the line. In order to explore the parameter space, we used the Markov chain Monte Carlo (MCMC) ensemble sampler emcee (Foreman-Mackey et al. 2013), and we obtained the posterior probability distributions of the free parameters. Finally, we computed the best values and uncertainties from the 50th, 16th, and 84th percentile of the distributions. In addition, we derived line luminosities as (see, e.g., Carilli & Walter 2013)
![Mathematical equation: $$ \begin{aligned}&L_{\rm line}\,[L_{\odot }]= 1.04\times 10^{-3}\,S {\Delta v}\,\nu _{\rm obs}D_{\rm L}^2,\end{aligned} $$](/articles/aa/full_html/2021/08/aa39696-20/aa39696-20-eq20.gif) (1)
(1)
![Mathematical equation: $$ \begin{aligned}&L\prime _{\rm line}\,[\mathrm{K\,km\,s^{-1}\,pc^2}]=3.25\times 10^7\,S {\Delta v}\frac{D_{\rm L}^2}{(1+z)^3\nu _{\rm obs}^2}, \end{aligned} $$](/articles/aa/full_html/2021/08/aa39696-20/aa39696-20-eq21.gif) (2)
(2)
where SΔv is the line velocity-integrated flux in Jy beam−1 km s−1, νobs is the observed central frequency of the line in GHz, and DL is the luminosity distance in Mpc. The relation between Eqs. (1) and (2) is  .
.
In Table 3 we report the measured and derived quantities for the observed lines and continuum emission in each frequency setup for the quasars and their companions. In order to confirm the robustness of the spectral fit results against spurious effects of the noise (especially in the very critical cases of low S/N, e.g., the lines in the spectra of QSO PJ308−21), we performed different spectral fits by accurately varying the imposing priors and starting points in the MCMC fitting procedure. We thus assessed that the line was detected (although at low significance) when the derived best-fit models in all the cases indicate a self-consistent solution. In addition, we performed all the fits to the data at a lower spectral resolution (80 km s−1) and verified that all derived parameters were consistent within ∼1σ with those reported in Table 3. In Figs. 1 and 2 we report the observed spectra of systems PJ231−20 and PJ308−21, respectively, together with the line and continuum best-fit models. We also report the corresponding continuum-subtracted line velocity-integrated maps over 360 km s−1. This value maximizes the S/N of the CO(10−9) velocity-integrated map of QSO PJ231−20. We used this as a reference value in order to obtain all the other line maps. In Fig. 3 we show the line-free continuum maps in the various frequency bands. In some cases (see Figs. 1 and 2) the peaks of the line velocity-integrated maps of systems PJ231−20 and PJ308−21 show a shift with respect to the reference position of the sources. However, in all the cases, the shift is well inside the beam of the observed map. This effect is probably ascribable to the continuum subtraction and/or the low S/N of the emission. Therefore we conclude that the line and the continuum peaks are spatially consistent at the available resolution.
 |
Fig. 1. Detections and nondetections in system PJ231−20. We show the observed integrated spectra for the quasar and its companion galaxy in a frequency range around the targeted transition. In the panels showing the spectra, we show the best-fit model (red line), the fit residuals (at the bottom of each panel), the expected frequency of the line (vertical dashed black line) and the channels used to obtain the continuum-subtracted line velocity-integrated maps (over 360 km s−1) that are shown to the right of each spectrum (red shaded area). When the line is not detected, the best-fit model is a constant polynomial fitting the continuum emission alone. In the spectra covering the CO(16−15) line, we performed the fit after subtracting the best-fit model for the OH doublet (bottom panels). The spectra we show were extracted at the position of the quasar and companion galaxy. The positions of the sources are indicated in the line velocity-integrated maps with cyan and white crosses, respectively. The solid contours in the maps show the [2, 3, 4, 5, 6, 7, 8] × σ levels, and dashed contours indicate the −2σ level. |
 |
Fig. 2. Detections and nondetections in system PJ308−21. See Fig. 1 for a description of the various panels. |
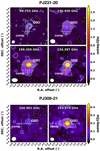 |
Fig. 3. Continuum maps in the four frequency setups of PJ231−20 (upper panels), and the two setups of system PJ308−21 (lower panels). The central frequencies of each setup are reported at the top of each panel. The white ellipses indicate the ALMA FWHM synthesized beam. The positions of the quasars and the companions from which we extracted the spectra from line cubes are marked by cyan and white crosses, respectively. The solid contours indicate [2, 4, 8, 16, 32, 64] × σ, and dashed contours are the −2σ value. |
Measurements and derived quantities from the ALMA spectra of the QSOs and their companion galaxies.
Throughout the text, we report the significance on the measured flux of a line emission in units of 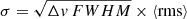 , where Δv is the channel width (40 km s−1), FWHM is the full width at half maximum of the line best-fit Gaussian, and the ⟨rms⟩ is the average rms noise in the line cube (see Table 1). When no line emission is detected in the observation, we report 3σ upper limits assuming FWHM = 300 km s−1. Finally, for the nondetections of continuum emission we report the 3σ upper limit, with σ equal to rms noise of the continuum.
4. CLOUDY models of photo- and X-ray dissociation regions
The observed molecular and atomic FSLs are key diagnostics of the physical conditions present in the ISM of galaxies. The ratios of observed FSL to dust-continuum flux require a relatively efficient (0.1 − 1%) mechanism to convert the continuum flux into atomic and molecular gaseous line emission. Tielens & Hollenbach (1985a) showed that this condition is satisfied by PDRs in which dust-grain photoelectric heating in regions where the far-UV (FUV) radiation (6 < hν < 13.6 eV) from hot stars (O and B) impinges on molecular clouds. PDRs represent the interface of the molecular and ionized medium (i.e., HII regions) in the outskirts of molecular clouds, where FUV radiation plays a significant role in the heating and/or chemistry of the gas phase. Tielens & Hollenbach (1985a,b) also pointed out that the emission from these regions largely depends on the cloud density (nH) and the strength of the FUV radiation field (G0) illuminating the cloud (where G0 is in Habing flux units, i.e., 1.6 × 10⁻³ erg s−1 cm−2, see Habing 1968). PDRs include all the atomic neutral medium and most of the molecular clouds, therefore the majority of the mass of the ISM is in PDRs. Densities in PDRs range from nH ≈ 0.25 cm−3 to nH ≳ 107 cm−3 and FUV flux from G0 ≲ 1 to G0 ≳ 106 (see, e.g., McKee & Ostriker 1977; Hollenbach & Tielens 1999; Kaufman et al. 1999; Meijerink et al. 2007).
Molecular gas can also be exposed to X-ray radiation, for example, near supernova shocks or radiation emitted from accreting BHs in quasars (see, e.g., Langer 1978; Krolik & Kallman 1983; Krolik & Begelman 1988; Lepp & McCray 1983). X-ray photons are able to penetrate much deeper into the cloud (column density of NH ≳ 1022 cm−2) and can affect the chemical and thermal structure of FUV-opaque molecular gas. Completely analogous to the PDRs, XDRs can therefore be defined as predominantly neutral gas in which X-rays dominate the gas heatings and much of the chemistry through X-ray dissociation and ionization (e.g., Maloney et al. 1996; Hartquist & Williams 1998; Hollenbach & Tielens 1999). In this case, the incident radiation field is typically expressed in terms of X-ray flux, FX (erg s−1 cm−2), over the range 1 − 100 keV.
Considerable effort has been made to construct PDR/XDR modeling codes in order to constrain the physical properties of the ISM where molecular and atomic transitions take place (e.g. Tielens & Hollenbach 1985a; Meixner & Tielens 1993; Maloney et al. 1996; Spaans 1996; Kaufman et al. 1999, 2006; Elitzur & Asensio Ramos 2006; Meijerink & Spaans 2005; Meijerink et al. 2007; van der Tak et al. 2007; Pound et al. 2008; Bisbas et al. 2012; Ferland et al. 2017). Each of these codes is optimized to simulate various astrophysical environments. The codes are based on different assumptions of PDR geometry, thermal and chemical balance, and different implementations of radiative transfer through the PDR. We used the CLOUDY radiative-transfer code (version c.17.01, Ferland et al. 2017) to characterize the ISM in the quasar and companion galaxy in systems PJ231−20 and PJ308−21 because it is highly customizable and allows the simultaneous treatment of all the species we studied. We modeled the observed line-emitting region as a single plane-parallel semi-infinite cloud impinged by a radiation field in the PDR and XDR regimes, and we obtained a suite of diagnostics to interpret the observed line ratios in these systems. In the following we describe how the models were set up.
Within CLOUDY, we ran a total of 270 × 2 PDR/XDR models assuming a 1D gas slab of constant total hydrogen density in the range log(nH/cm−3) = [2, 6] (15 models, ∼0.29 dex spacing), varying the strength of the radiation field (18 models), for two values of the total cloud hydrogen column density of NH = 1023, 1024 cm−2. In the case of PDR models, we defined the spectral energy distribution (SED) of the impinging radiation field as blackbody emission with a temperature of T = 5 × 10⁴ K scaled to obtain Habing fluxes at the gas slab surface in the range log G0 = [1, 6] (∼0.29 dex spacing). In the case of XDR, we chose a standard AGN template as the incident continuum SED,
 (3)
(3)
with parameters set in order to generate the continuum used in a large atlas of model broad-line region line intensities (Korista et al. 1997). We normalized this incident SED in order to have X-ray flux between 1 − 100 keV in the range log [FX/(erg s−1 cm−2)] = [ − 2.0, 2.0] (∼0.24 dex spacing) at the cloud surface. This range fully covers the X-ray radiation field strengths that are generally considered in standard XDR models (e.g., Maloney et al. 1996; Meijerink et al. 2007).
For the gas slab we assumed the default interstellar medium metal abundances (abundance ISM) stored in CLOUDY. We adopted dust ISM grains (grains ISM) stored in CLOUDY with the size distribution and abundance from Mathis et al. (1997). In addition, we included polycyclic aromatic hydrocarbons (PAHs, grains PAH) with the distribution from Abel et al. (2008), which generally dominate the photoelectric heating of grains. We also included the cosmic microwave background (CMB) radiation at z = 6 that affects the far-IR line luminosity of galaxies at high z. We adopted the default CLOUDY prescriptions for the cosmic-ray ionization rate background (cosmic rays background), which are an important source of heating deep into the molecular cloud. The mean H cosmic-ray ionization rate is 2 × 10⁻¹⁶ s−1 (Indriolo et al. 2007), and the H2 secondary ionization rate is 4.6 × 10⁻¹⁶ s−1 (Glassgold & Langer 1974). Finally, we added 1.5 km s−1 in quadrature to the thermal motions within the cloud to model the effect of line broadening that is produced by microturbulence.
In order to simulate the absorption of ionizing radiation caused by atomic hydrogen, we modified the incident continuum in the PDR and XDR cases by extinction due to photoelectric absorption by a cold neutral slab with a column density of 1024 cm−2 (extinguish column 24, see Cruddace et al. 1974). The code computes the radiative transfer through the slab up to a total hydrogen column density of NH = 1023, 1024 cm−2. We chose this stopping criterion to fully sample the molecular component that is typically located at NH > 1022 cm−2, which is observed in giant molecular clouds (e.g., McKee & Ostriker 1977). However, a higher column density NH ≳ 5 × 1023 cm−2 is required to properly model H2O and OH emission (see, e.g., Goicoechea et al. 2005; González-Alfonso et al. 2014; Spinoglio et al. 2005; Liu et al. 2017).
With our PDR and XDR models we obtained grids of line intensities and emitted continuum emerging from the cloud surface (both in unit of erg s−1 cm−2) as a function of the density of the medium (total hydrogen density, nH ranges 102 − 106 cm−3) and the strength of the radiation field (parameterized by G0 = 101 − 106 or FX (erg s−1 cm−2) = 10−2 − 102 in the case of PDR and XDR, respectively) for two values of the total hydrogen column density NH = 1023, 1024 cm−2.
The models adopted in this work are designed to simulate a typical cloud in a galaxy under very simplistic assumptions. Undoubtedly, these simple models cannot provide a realistic picture of the ISM in galaxies that are composed of an ensemble of clouds and diffuse medium with a wide range of physical and geometrical properties. However, quantities such as line luminosity ratios can be used to mitigate the large uncertainties related to the unknown parameters, thus allowing us to quantitatively compare model predictions with observations.
In the following sections, we present various results obtained from dust FIR continuum and line detections in the targeted sources. By comparing our model results with the observed emission, we then place constraints on the key parameters characterizing the ISM in the quasar hosts and companion galaxies.
5. Dust properties: FIR continuum
The continuum emission detected in the FIR and (sub-)mm bands is dominated by emission from dust distributed in the diffuse medium and star-forming regions of a galaxies. The bulk of the dust in star-forming regions is heated by the diffuse rest-frame optical/UV radiation field produced by young stars. The typical dust temperature for quasar hosts lies in the range Tdust ∼ 40 − 70 K (e.g., Priddey & McMahon 2001; Beelen et al. 2006; Wang et al. 2008; Leipski et al. 2013, 2014) and increases to ≳100 − 500 K in the proximity of the central BH accretion disk (Rowan-Robinson 1995; Charmandaris et al. 2004; Beelen et al. 2006). Because the dust grains are in local thermodynamical equilibrium (LTE) with the radiation field, they emit thermal radiation. However, dust grains are not ideal blackbodies. For this reason, dust thermal emission is usually modeled as a modified blackbody where the grain emission efficiency is expressed in terms of the dust opacity coefficient, kd(ν)∝νβ. When we assume optically thin dust emission (see, e.g., Beelen et al. 2006), the continuum flux in the Rayleigh-Jeans limit is therefore proportional to the dust mass, Mdust, and temperature, Tdust (see, e.g., Downes et al. 1992; Dunne et al. 2000). Based on observational studies at low and high redshift (e.g., Blain et al. 2003; Conley et al. 2011; Rangwala et al. 2011; Casey 2012; Riechers et al. 2013; Faisst et al. 2020), the optically thin dust approximation may not be true at short wavelengths, but likely holds for our observations because most of the continuum data are at rest frame λ > 200 μm. In order to estimate Mdust and Tdust in the quasar host galaxies and their companions, we modeled the continuum data with a modified blackbody taking the effect of the cosmic microwave background radiation (CMB; see da Cunha et al. 2013) into account, whose temperature scales as ∝(1 + z) and is TCMB ≈ 19 K at z = 6. At the redshifts of the sources, the CMB is indeed an additional non-negligible source of heating and provides a strong background against which we measure line and continuum emission. Following da Cunha et al. (2013), we therefore define the flux density in the optically thin limit as
![Mathematical equation: $$ \begin{aligned}&F_{\nu /(1+z)}^\mathrm{intr} = B_\nu [T_{\rm dust}(z)]k_{\rm d}(\nu )(1+z)M_{\rm dust}D_{\rm L}^{-2},\end{aligned} $$](/articles/aa/full_html/2021/08/aa39696-20/aa39696-20-eq125.gif) (4)
(4)
![Mathematical equation: $$ \begin{aligned}&F_{\nu /(1+z)}^\mathrm{obs} = \left({1 - \frac{B_{\nu }[T_{\rm CMB}(z)]}{B_{\nu }[T_{\rm dust}(z)]}}\right)F_{\nu /(1+z)}^\mathrm{intr}, \end{aligned} $$](/articles/aa/full_html/2021/08/aa39696-20/aa39696-20-eq126.gif) (5)
(5)
where  and
and  are the intrinsic and observed flux density against the CMB, respectively, Bν(T) is the Planck function Bν(T) = [2hν3/c2][exp(hν/kBT)−1]−1, kd(ν) is the frequency-dependent dust mass opacity coefficient defined as kd(ν) = k0(ν/ν0)β, where ν0 = 352.7 GHz, and β is the dust spectral emissivity index (see, e.g., Dunne et al. 2000). da Cunha et al. (2013) also showed that the observed galaxy dust temperature at certain redshift, Tdust(z), is higher than the dust temperature that we would observe at z = 0 because CMB photons are absorbed by the dust grains:
 ![Mathematical equation: $ T_{\mathrm{dust}}(z) = \{(T_{\mathrm{dust}}^{z=0})^{4+\beta}+(T_{\mathrm{CMB}}^{z=0})^{4+\beta}[(1+z)^{4+\beta}-1]\}^{1/(4+\beta)} $](/articles/aa/full_html/2021/08/aa39696-20/aa39696-20-eq129.gif) . However, at z ≈ 6.5 and typical dust temperatures of Tdust > 35 K, this correction is < 2%, much less than the relative uncertainties we expect on dust temperature estimate. We therefore ignored this correction.
. However, at z ≈ 6.5 and typical dust temperatures of Tdust > 35 K, this correction is < 2%, much less than the relative uncertainties we expect on dust temperature estimate. We therefore ignored this correction.
Hence, we used the model defined in Eq. (5) to fit the quasar and companion continuum data reported in Table 3, together with ALMA band 6 data presented in Decarli et al. (2017), from which we obtained line and continuum measurements. In order to determine the best-fit model, we made use of the emcee code (Foreman-Mackey et al. 2013), allowing Mdust, and β to freely vary during the fitting procedure. We limited the parameter space by imposing box-like priors defined as log Mdust[M⊙]> 0, and β ∈ (1, 2.5). In addition, the sampled frequency range of the observations mostly covers the Rayleigh-Jeans tail of the dust thermal emission. The observed flux density in this regime is ∝TdustMdust, which makes these parameters degenerate. We therefore employed a relative tight Gaussian prior on Tdust with a mean and standard deviation equal to 47 K and 5 K, respectively. These choices are consistent with the typical measurements in quasar host galaxies reported in the literature (e.g., Priddey & McMahon 2001; Beelen et al. 2006; Wang et al. 2008; Leipski et al. 2013, 2014) and are also validated by the results obtained below for the water vapor lines (see Sect. 8.5). On the other hand, if the companion galaxies do not host a quasar (as suggested by rest-frame UV and X-ray studies, see Decarli et al. 2017; Connor et al. 2019, 2020), we expect that the dust temperature may not be as high as that of the quasar host galaxies because the additional dust heating by an AGN is lacking. The nondetection of water lines in the companions also argues against a high Tdust (despite the detections of the OH163 μm doublet, which likely traces similar regions as are traced by H2O lines, see Sects. 8.4, 8.8, and 8.9). In the case of the companion galaxies, we therefore also considered a lower-temperature scenario. To do so, we performed an additional fit centering the Gaussian dust temperature prior on Tdust = 35 K, which is a representative value of the population of SMGs at z ∼ 1 − 3 (e.g., Chapman et al. 2005; Kovács et al. 2006). In the fits we also took the upper limit measurements on dust continuum into account by inserting a penalty term in the log-likelihood function in the form 𝒫 = −0.5[(model − data)/data]2, if model > data, otherwise, 𝒫 = 0. Finally, we assumed the source [CII]-based redshifts reported in Decarli et al. (2017) (see Table 3). In Fig. 4 we show the best-fit models of the continuum emission in systems PJ231−20 and PJ308−21, respectively, together with the posterior probability distributions of the parameters. From these results, we estimated the total (TIR, 8 − 1000 μm, Sanders et al. 2003) and FIR (40 − 400 μm, Helou et al. 1988) rest-frame luminosities of the sources by integrating the best-fit models over the corresponding frequency ranges. Finally, we inferred the SFR using the local scaling relation from Murphy et al. (2011), SFRIR/(M⊙ yr−1) = 1.49 × 10⁻¹⁰ LTIR/L⊙, assuming that the IR-luminosity is dominated by star formation and under the hypothesis that the entire Balmer continuum (i.e., 912 Å < λ < 3646 Å) is absorbed and re-irradiated by dust in the optically thin limit. Any contribution of the central AGN to the IR luminosity will therefore result in an overestimation of the SFRIR. The initial mass function (IMF) implicitly assumed in this LTIR to SFR conversion is a Kroupa IMF (Kroupa 2001), with a slope of −1.3 for stellar masses between 0.1 − 0.5 M⊙, and −2.3 for stellar masses ranging between 0.5 and 100 M⊙. In Table 4 we report all the derived quantities obtained with the dust continuum modeling.
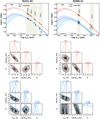 |
Fig. 4. Models of the dust SEDs of sources PJ231−20 (left panels) and PJ308−21 (right panels). Upper panels: circles and diamonds indicate continuum data obtained in this work and those obtained from the ALMA Cycle 6 [CII]158 μm observations (Decarli et al. 2017), respectively. Downward arrows indicate 3σ upper limits. The best-fit modified blackbody model is indicated with a solid red line for the quasars, and the blue and cyan lines show the models for companion galaxies assuming Tdust = 47 K and 35 K, respectively. The shadowed areas show the 1σ confidence intervals. Green bands indicate the ALMA frequency bands redshifted to the quasar-companion pair rest frame (zpair = [zQSO + zcomp]/2). Lower panels: posterior probability distributions of the free parameters (red for quasars, blue and cyan for companions). The vertical lines indicate the best-fit values computed as 50th percentiles of the distributions. The best-fit values with their uncertainties are also reported. |
Dust properties in sources PJ231−20 and PJ308−21.
In the case of the quasar and companion galaxy in system PJ231−20, we find good constraints on the dust mass (≲0.1 dex) and the spectral emissivity index (relative error of ≲10%). On the other hand, the dust temperature values obtained from the posterior probability distribution are consistent within 1σ with the imposed prior, confirming that Tdust cannot be constrained with the fit. In the case of the quasar and companion in the system PJ308−21, we found only tentative constraints on Mdust and β because the coverage of the dust spectral energy distributions (SEDs) is poor. The best-fit values of β in the PJ231−20 and PJ308−21 quasars and companions range between ∼1.5 − 1.9 and are consistent with the values estimated in the two low-redshift sources (e.g., Conley et al. 2011; Casey 2012) and those at z > 5 − 6 (e.g. Riechers et al. 2013; Carniani et al. 2019; Novak et al. 2019; Yang et al. 2019a; Faisst et al. 2020). We note that although we assumed different dust temperatures of 47 K and 35 K as priors in the dust SED fit of the companion galaxies, we obtained similar results that are consistent within 1.5σ. As shown in Fig. 4, this is mainly due to the lack of high-frequency continuum measurements, where the peak of dust SED is placed. However, an additional large source of uncertainty in the dust fitting is the optically thin dust approximation. The shape of the dust SED may be altered by the dust opacity at short wavelengths, thus affecting the derived LTIR. Furthermore, if a warmer dust component is present, it may significantly contribute to the IR luminosity.
6. Ionized medium
6.1. [NII]205 μm and [CII]158 μm fine-structure lines
The ionization potential of the nitrogen atom (14.5 eV) is greater than that of neutral hydrogen (13.6 eV), therefore the N+ emission is due to collisions with electrons in the fully ionized medium. For an electron temperature of 8000 K, the critical density2 of [NII]205 μm line is  cm−3 (Oberst et al. 2006), which means that this line traces the low-density diffuse medium (ne ∼ 0.1 − 1 cm−3) rather than the dense (HII) regions (ne ∼ 0.5 − 1.0 × 103 cm−3), where it is rapidly thermalized and its emission is collisionally quenched (e.g., Herrera-Camus et al. 2016).
The fine-structure transition (3P3/2 → 3P1/2) of the C+ ion is one of the main coolants of the cold-gas phase (50 K < T < 3000 K) in the ISM in star-forming galaxies and is easily detected in ALMA band 6 at z ≳ 6. Singly ionized carbon has a lower ionization potential than HI (11.3 eV), therefore [CII]158 μm arises from the neutral medium, including atomic clouds and PDRs on the surface of molecular clouds exposed to stellar UV radiation in star-forming regions, and also from low-density ionized gas. In the ionized medium, the C+ ion is excited by collisions with electrons, and its 158 μm transition has a critical density of  cm−3 (Oberst et al. 2006). On the other hand, in the neutral medium, most of the [CII]158 μm emission is expected to arise from the dense PDRs where C+ is collisionally excited by neutral and molecular hydrogen (
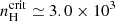 cm−3,
cm−3, 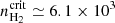 cm−3, see Goldsmith et al. 2012).
The [NII]205 μm line provides us with important clues for interpreting the observed [CII]158 μm emission (Decarli et al. 2017). We detected the [NII]205 μm (3P1 → 3P0) line in system PJ231−20 with a significance of ∼4σ and ∼2σ for the quasar and the companion galaxy, respectively (see Figs. 1 and 2). The line measurements are reported in Table 3.
6.2. Fraction of [CII]158 μm emission from PDRs
Because [CII]158 μm and [NII]205 μm have similar ionization potentials and critical densities, the line ratio in the ionized medium in the optically thin case essentially depends only on their relative abundance. Therefore the observed [NII]205 μm line emission reveals the fraction of [CII]158 μm arising from neutral gas. Following Díaz-Santos et al. (2017), we estimated the fraction of [CII]158 μm emission arising from PDRs by assuming a typical ![Mathematical equation: $ {\text{[CII]}}^{\mathrm{ion}}_{\mathrm{158\,\upmu m}}/{\text{[NII]}}_{\mathrm{205\,\upmu m}} \approx 3 $](/articles/aa/full_html/2021/08/aa39696-20/aa39696-20-eq164.gif) that is observed in HII regions (Oberst et al. 2006),
that is observed in HII regions (Oberst et al. 2006),
![Mathematical equation: $$ \begin{aligned} f(\mathrm{[CII]}^\mathrm{PDR}) = \frac{\mathrm{[CII]}^\mathrm{PDR}_{\rm 158\,\upmu m}}{\mathrm{[CII]}_{\rm 158\,\upmu m}} \approx 1{-}3\frac{\mathrm{[NII]}_{\rm 205\,\upmu m}}{\mathrm{[CII]}_{\rm 158\,\upmu m}}\cdot \end{aligned} $$](/articles/aa/full_html/2021/08/aa39696-20/aa39696-20-eq165.gif) (6)
(6)
We note that while the [CII]/[NII] ratio for HII regions assumes solar metallicities, the high dust content seen in z ≳ 6 quasar host galaxies suggests that the metallicities are indeed high (see, e.g., Novak et al. 2019, furthermore, this is also supported if indirectly by studies of the metallicity of the broad-line region in z ∼ 6 quasars, see, e.g., Pentericci et al. 2002; Jiang et al. 2007; Onoue et al. 2020). Combining our [CII]158 μm line luminosity measurements with those of the [NII]205 μm line (see Table 3), we conclude that PDRs account for ≳80% of the [CII]158 μm emission in QSO PJ231−20 and its companion galaxy. This result is consistent with previous studies on local starburst galaxies showing that no more that ∼30% of the [CII]158 μm emission is emitted by the diffuse ionized medium (e.g., Carral et al. 1994; Lord et al. 1996; Colbert et al. 1999). Studies of the [CII]-to-[NII] ratio in FIR bright galaxies at higher redshifts (z > 4 − 5) have also concluded that only a small fraction of [CII]158 μm emission arises from the ionized gas-phase ISM (see, e.g., Decarli et al. 2014; Pavesi et al. 2016).
In Fig. 5 we compare f([CII]PDR) and the dust temperature of QSO PJ231−20 and its companion with a sample of local luminous IR galaxies (LIRGs) reported in Díaz-Santos et al. (2017) and with the value of two high-z quasars: SDSS J2310+1855 at z = 6.00 (Li et al. 2020a,b) and the most distant quasar know so far, ULAS J1348+0928 at z = 7.54 (Novak et al. 2019). Díaz-Santos et al. (2017) reported that galaxies with warmer Tdust show an higher f([CII]PDR); therefore the fraction of [CII]158 μm emitted from PDR increases in highly star-forming systems. The authors also ruled out a significant role for AGN in increasing f([CII]PDR) in galaxies. A possible interpretation is that HII regions are more enshrouded by dust in high Tdust galaxies than those of more evolved systems with lower Tdust, in which stellar feedback processes have already cleared out most of the dust from the star-forming regions (Díaz-Santos et al. 2017, and references therein). That is, the fractions of [CII]158 μm arising from the ionized medium are associated with low-density fossil HII regions and diffuse ionized gas that is not associated with hot young stars. While the high dust temperatures (47 − 54 K) of the high-z galaxies presented in this work lie outside the range of the LIRG sample, the assumption of Tdust = 35 K in the case of the companion to PJ231−20 means that this object agrees with the trend of local LIRGs shown in Fig. 5.
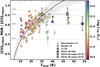 |
Fig. 5. Fraction of [CII]158 μm arising from the PDR as a function of dust temperature, color-coded by the logarithm of the total IR luminosity. The QSO PJ231−20 and its companion galaxy are marked by stars. For the companion we report the cases with an assumed dust temperature of 47 K and 35 K. These points are connected by a dashed line. The diamond marks the 3σ upper limit on quasar ULAS J1342+0928 at z = 7.54 (Novak et al. 2019), while the square is the upper limit on SDSS J2310+1855 at z = 6.00 (Li et al. 2020a,b). The latter limits are computed using the [NII]122 μm/[NII]205 μm line luminosity ratio to estimate the electron density and then the fraction of [CII]158 μm from the ionized gas from Oberst et al. (2006). Tdust and LTIR for SDSS J2310+1855 are derived via a dust SED fitting by Shao et al. (2019), and for ULAS J1342+0928, LTIR is estimated in Novak et al. (2019) by assuming Tdust = 47 K (here slightly shifted for better visualization). Circles represent the LIRG sample presented in Díaz-Santos et al. (2017). The solid black line shows the best-fit model |
![Mathematical equation: $ f(\mathrm{[CII]_{158\,\upmu m}^{\mathrm{PDR}}}) = 0.82({\pm}0.01)+0.41({\pm}0.04)\log(S_{63}/S_{158}) $](/articles/aa/full_html/2021/08/aa39696-20/aa39696-20-eq166.gif)
6.3. IR line deficits
The ratio of the luminosity of ISM cooling lines, such as L[CII]158 μm, L[NII]205 μm to the total IR luminosity (LTIR) measures the ratio of the cooling of the gas to that of the dust. These ratios decrease by ∼1 − 2 orders of magnitude with increasing dust temperature and IR luminosity in local galaxies (e.g., Malhotra et al. 1997; Graciá-Carpio et al. 2011; Farrah et al. 2013; Díaz-Santos et al. 2013, 2017; Zhao et al. 2013, 2016; Herrera-Camus et al. 2018a) and those at high redshift (e.g., Decarli et al. 2012, 2014; Bañados et al. 2015; Novak et al. 2019; Rybak et al. 2019). The underlying causes of the so-called line deficits are still debated. The physical arguments that are most often proposed include changes in ionization parameter that produce a high dust-to-gas opacity ratio, optically thick dust screening part of the line emission, and progressive thermalization of the lines with low critical densities. However, a possible explanation is that HII regions are dustier in IR-bright galaxies than in low-luminosity systems (e.g., Luhman et al. 2003; González-Alfonso et al. 2008; Abel et al. 2009; Graciá-Carpio et al. 2011; Farrah et al. 2013; Riechers et al. 2014; Díaz-Santos et al. 2017; Herrera-Camus et al. 2018b). In this scenario, a higher fraction of UV photons produced by young stars is absorbed by dust, thus suppressing ionizing photons that would otherwise be absorbed by the neutral medium, thereby decreasing the photoionization heating efficiency, whose net effect is to decrease the line emission relative to the IR luminosity. On the other hand, if [CII] and [NII]205 μm emission were to arise from different ISM phases (i.e., low-density regions and diffuse ionized gas that is not associated with hot young stars) than the IR continuum emission, then the line deficit could be driven by a boosting of the IR luminosity rather than by a deficit in the observed line flux. However, consistently with what we discussed in Sect. 6.2, a fraction of this excess energy can be transferred to the surrounding neutral or molecular medium, increasing the [CII]
 emission and therefore decreasing the deficit.
In Fig. 6 we compare the [CII]158 μm and [NII]205 μm line deficits in the quasars and companion galaxies presented in this work with the local LIRG sample of Díaz-Santos et al. (2017) and quasar J1342+0928 at z = 7.54 (Novak et al. 2019). Our findings are consistent within the scatter with the overall trends observed in LIRGs. In particular, the line deficit of the companion galaxy in the low dust temperature case (Tdust = 35 K) in system PJ231−20 is typical of the bulk of the local LIRG population. Noticeably, while we find that the host and companion galaxies of QSO PJ231−20 show [NII]205 μm line deficits that are consistent within the errors, the deficit in [CII]158 μm is significantly more pronounced in the quasar than in the companion galaxy. However, this is probably not evidence that a powerful AGN affects the [CII]158 μm line deficit (unless an AGN biases our LTIR measurement): this scenario is excluded from the study of local ULIRGs sample (e.g., Díaz-Santos et al. 2013, 2017; Farrah et al. 2013) showing no strong dependence of line deficit and [CII] fraction with the AGN contribution. In this context, not even higher ionization lines such as [OIII]88 μm appear to be significantly affected by AGN (see, e.g., Walter et al. 2018). In system PJ308−21, the quasar shows a similar [CII]158 μm deficit to that of the companion galaxy, and both sources exhibit less extreme deficits than in QSO PJ231−20 and its companion. This suggests that the observed line deficit is only slightly affected by an AGN. The observed scatter in the L[CII]158 μm/LTIR ratio might be caused the variation in the PDR contribution to the total [CII]158 μm with increasing Tdust (Díaz-Santos et al. 2017, see Fig. 5).
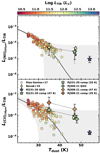 |
Fig. 6. [NII]205 μm and [CII]158 μm line deficits (top and bottom panel, respectively) with respect to the total IR luminosity (LTIR(8 − 1000 μm)) for quasars PJ231−20 and PJ308−21 and the companion galaxies and the LIRG sample of Díaz-Santos et al. (2017) as a function of dust temperature and color-coded by log LTIR. We also report the measurements obtained for the z = 7.54 quasar ULAS J1342+0928 (Novak et al. 2019). The sources in system PJ231−20 are indicated by stars, and those in system PJ308−21 are marked with crosses. For the companion galaxies we report the cases with assumed dust temperatures of 47 K and 35 K. These points are connected by a dashed line. The solid lines are the best fit to the LIRG sample performed in Díaz-Santos et al. (2017) using the model Lline/LFIR = ϵ0exp[( − S63/S158)/δ] with (ϵ0, δ) = ((1.26 ± 0.16) × 10−3, 0.50 ± 0.04) for the [NII]205 μm line, and (ϵ0, δ) = ((14.0 ± 0.9) × 10−3, 0.68 ± 0.04) for [CII]158 μm line. We scaled the best fits by a constant factor because different FIR luminosity definitions were employed by Díaz-Santos et al. (2017). The best-fit scaling values are 0.56 for [NII]205 μm line and 0.44 for [CII]158 μm line. The gray shaded area represents the 1σ scatter of the relation. The Novak et al. (2019) points were slightly shifted along the dust temperature axis (assumed to be 47 K) for a better visualization of the data. |
7. Atomic medium
7.1. [CI]369 μm fine-structure line
We detected the atomic fine-structure line [CI]369 μm (3P2 → 3P1) in QSO PJ231−20 with a significance of ∼4.5σ while we derived upper limits for the companion and for objects in system PJ308−21. This line has a critical density of 1.2 × 103 cm−3 (see, e.g., Carilli & Walter 2013, and references therein), which means that it traces the cold dense atomic neutral medium. Because the ionization potential of neutral carbon is close to the dissociation energy of the CO molecule, it is expected to exist in a narrow range of physical conditions. The [CI] emission has been thought to emerge from a thin C+/C/CO transition layer in the molecular clouds (Tielens & Hollenbach 1985a,b; Hollenbach & Tielens 1999; Kaufman et al. 1999). However, several lines of evidence highlight a close connection of [CI] emission and CO rotational transitions, suggesting that the [CI] line traces the bulk of molecular gas in galaxies (see, e.g., Ikeda et al. 2002; Papadopoulos et al. 2004; Walter et al. 2011; Alaghband-Zadeh et al. 2013; Israel et al. 2015; Bothwell et al. 2017; Valentino et al. 2018, 2020). This is also predicted by hydrodynamic simulations (e.g., Tomassetti et al. 2014) in which CO and [CI] are found to coexist throughout the bulk of the cold molecular component. A viable explanation is provided by clumpy, inhomogeneous PDR models (e.g., Meixner & Tielens 1993; Spaans 1996) in which the surface layers of [CI] are distributed across clumpy molecular clouds.
7.2. [CI]369 μm-to-TIR ratio
In Fig. 7 we show the L[CI]369 μm-to-LTIR ratio as a function of dust temperature for a variety of galaxies and AGN in the local and high-z Universe (see Valentino et al. 2020, and references therein for full details). The observed average ratio is L[CI]369 μm to LTIR ∼ 10−5, but there is a negative correlation with Tdust. However, in contrast to the [NII]205 μm and [CII]158 μm line deficits (see Fig. 6), this trend is expected. [CI] in PDR models is predicted to arise in regions in which the gas kinetic temperature is similar to dust temperature Tdust (e.g., Tielens & Hollenbach 1985a) and in which the IR luminosity rises with a high power of Tdust ( ), while the line emission into the cloud is only proportional to the gas temperature. Then, the trend shown in Fig. 7 is also driven by a redshift dependence. Valentino et al. (2018, 2020) found that the observed L[CI]369 μm-to-LTIR ratios are lower in high-z SMGs than in local star-forming and main sequence (MS) galaxies on average (i.e., those defining a relatively tight distribution in SFR and stellar mass M⋆, see, e.g., Noeske et al. 2007; Elbaz et al. 2011). The most plausible underlying reason of this trend therefore is a potential evolution in the dust temperature with redshift that enhances LTIR (e.g., Schreiber et al. 2018; Liang et al. 2019; Ma et al. 2019; Faisst et al. 2020; Riechers et al. 2020). Furthermore, the IR luminosity measured in local AGN and high-z quasars (which are also expected to have higher Tdust than a star-forming galaxy) might be affected by a substantial contribution from a dusty torus that boosts the observed LTIR, thus driving the observed decrease of L[CI]369 μm/LTIR with Tdust. However, L[CI]369 μm and LTIR trace the neutral gas and the SFR, respectively, thus their ratio is a proxy of the gas depletion timescale τdep = Mgas/SFR, representing the efficiency of the star formation. Therefore the observed trend of L[CI]369 μm/LTIR might be interpreted as due to a decrease in τdep (or equivalently, a higher star-formation efficiency) in high-z SMGs and quasar hosts than in MS and local star-forming galaxies. This result is consistent with several CO-based studies (e.g., Daddi et al. 2010; Genzel et al. 2015; Tacconi et al. 2018; Birkin et al. 2021).
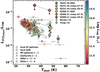 |
Fig. 7. Comparison of L[CI]369 μm/LTIR and dust temperature (Tdust) observed in systems PJ231−20 and PJ308−21 with various local and high-z galaxies. Data points are color-coded by log LTIR. The reported sample is taken from Valentino et al. (2020) (and references therein) and comprises local star-forming (SF) galaxies (circles) and AGN (diamonds); main-sequence (MS) galaxies (upright triangles) and starburst galaxies (upside-down triangles) at z ∼ 1; and z ∼ 2 − 4 SMGs (pentagons) and QSOs (squares). The QSO PJ231−20 and its companion are indicated with stars, and the PJ308−21 sources are marked with crosses. For the companions we report the cases with an assumed dust temperature of 47 K and 35 K. These points are connected by a dashed line. The upper limit in our sources corresponds to 3σ. We also report measurements in quasar ULAS J1342+0928 at z = 7.54 (see Novak et al. 2019) and quasar J0439+1634 at z ≃ 6.5 (Yang et al. 2019a). |
We obtained 3σ upper limits of the [CI]369 μm line for all sources in the systems we studied, except for QSO PJ231−20, for which we measure ![Mathematical equation: $ L_\mathrm{[CI]{369\,\upmu m}}/L_{\mathrm{TIR}} =2.6^{+1.4}_{-1.1}\times 10^{-6} $](/articles/aa/full_html/2021/08/aa39696-20/aa39696-20-eq171.gif) . This value together with the assumed Tdust locate this source in the parameter ranges observed in other high-z quasars. In particular, a similar L[CI]369 μm/LTIR ratio (
. This value together with the assumed Tdust locate this source in the parameter ranges observed in other high-z quasars. In particular, a similar L[CI]369 μm/LTIR ratio (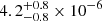 ) has been measured by Yang et al. (2019a) in the z ≃ 6.5 quasar J0439+1634. This result suggests a high star-formation efficiency in these sources relative to their local counterparts. For the other sources we studied, we obtained L[CI]369 μm/LTIR < 10−4 − 10−5 limits that are ∼1 − 2 orders of magnitude lower than L[CII]158 μm/LTIR. We also estimated an L[CI]369 μm/L[CII]158 μm of ∼2% in QSO PJ231−20 and < 2 − 6% in all the other sources. These values are similar to the value measured in the quasar host galaxy J1148+5251 at z = 6.42 by Riechers et al. (2009). These results support the assumption that [CI]369 μm is a weaker coolant than the dust continuum and [CII]158 μm at these high redshifts. In Sect. 9 we further exploit the [CI]369 μm detections in quasar hosts and companions to place constraints on the amount of neutral carbon and molecular gas in the ISM.
7.3. [CII]158 μm-to-[CI]369 μm ratio
The [CII]158 μm-to-[CI]369 μm ratio is extremely useful to distinguish between PDR and XDR models, as other high-z studies have shown (Venemans et al. 2017a,b; Novak et al. 2019). In Fig. 8 we show the [CII]-to-[CI] intensity ratio obtained from our CLOUDY grids with NH = 1023 cm−2. In the PDR case, the [CII]-to-[CI] ratio ranges between ≲2 and ≳70, and in the XDR case it does not exceed a value of ∼15. These ranges are consistent with those that are found in other models in the literature (e.g., Kaufman et al. 1999; Meijerink et al. 2007). The different values of the [CII]-to-[CI] ratio predicted in PDR and XDR models arise because the CO-to-C abundance ratio produced in the XDR regime is lower (see, e.g., Maloney et al. 1996; Meijerink & Spaans 2005). While PDRs have a sharp C+/C/CO transition layer at a certain depth in the clouds (depending on the density and FUV field strength), X-ray photons can penetrate much deeper into the cloud, which affects its whole structure. As a result, both C and C+ are present in the XDR regime throughout most of the cloud, and their column density increases much more gradually as a function of cloud depth than in the PDR case.
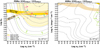 |
Fig. 8. Grids of the [CII]158 μm/[CI]369 μm intensity line ratio as a function of the strength of the radiation field (G0 or FX) and total hydrogen density (nH) in the PDR (left panel) and XDR case (right panel). The adopted total hydrogen column density is NH = 1023 cm−2. Model values are indicated by gray contours (linear scale), and constraints on the observed line ratios are superimposed. The dashed gold area indicates the [CII]158 μm-to-[CI]369 μm luminosity ratio measured in QSO PJ231−20 within its uncertainties, and 3σ lower limits on the other sources are reported (see the legend in the bottom left corner of the left panel). The [CII]158 μm-to-[CI]369 μm ratios in QSO PJ231−20 and its companion are scaled according to the estimated fraction of [CII]158 μm arising from PDRs. The XDR case does not reproduce the observed ratios in any source, except for a small range of values corresponding to the lower limit measured in QSO PJ308−21. We also report the [CI]369 μm-to-TIR and [CII]158 μm-to-TIR luminosity ratio estimates in QSO PJ231−20 as filled gold and light brown areas, respectively. This provides additional constraints on the radiation field flux. |
Additional constraints on the radiation field in galaxies are provided by the [CI]369 μm-to-TIR and [CII]158 μm-to-TIR luminosity ratios. For high FUV fluxes (G0 ≳ 102) these ratios are expected to decease as G0 increases in the PDR case, with almost no dependence on ISM density. By increasing G0, the C+/C/CO transition layer in which [CI] transitions take place is pushed deeper into the cloud, but the C column density remains substantially unaffected. The gas heating efficiency due to photoelectric effects on dust grains reaches its maximum values at G0 ∼ 10 − 100 and becomes less efficient at higher fluxes, while the dust heating per UV photon remains at the same level (e.g., Kaufman et al. 1999). In this case, the [CII]158 μm line luminosity increases logarithmically, but the IR luminosity is linearly proportional to G0. As a result, the [CI]369 μm-to-TIR and [CII]158 μm-to-TIR luminosity ratios mostly depend on G0 for high UV fluxes (see also, e.g., Tielens & Hollenbach 1985a; Kaufman et al. 1999; Gerin & Phillips 2000).
The observed luminosity ratios, corrected for the fraction of [CII]158 μm that actually arises from PDRs (see Sect. 6.2), are ![Mathematical equation: $ L_\mathrm{[CII]{158\,\upmu m}}/L_\mathrm{[CI]{369\,\upmu m}}=46^{+30}_{-14} $](/articles/aa/full_html/2021/08/aa39696-20/aa39696-20-eq173.gif) for the QSO PJ231−20, and 3σ limits of > 55, 53, and 13 in its companion, the QSO PJ308−21, and the companion galaxy to QSO PJ308−21, respectively. For all the sources, the PDR scenario is therefore favored. In the case of QSO PJ231−20, this diagnostic indicates a density nH > 103 cm−3 and an FUV radiation field strength of > 103 G0. Similar constraints are inferred for all the other sources (see Fig. 8). In addition, by combining the estimated values of the L[CI]369 μm-to-LTIR and L[CII]158 μm-to-LTIR ratios with the [CII]158 μm/[CI]369 μm CLOUDY models (see Fig. 8), we constrained the FUV flux to G0 ≃ 3 × 10⁴ − 105 in QSO PJ231−20. A similar value was reported for the J0439+1634 quasar at z ≃ 6.5 by Yang et al. (2019a).
for the QSO PJ231−20, and 3σ limits of > 55, 53, and 13 in its companion, the QSO PJ308−21, and the companion galaxy to QSO PJ308−21, respectively. For all the sources, the PDR scenario is therefore favored. In the case of QSO PJ231−20, this diagnostic indicates a density nH > 103 cm−3 and an FUV radiation field strength of > 103 G0. Similar constraints are inferred for all the other sources (see Fig. 8). In addition, by combining the estimated values of the L[CI]369 μm-to-LTIR and L[CII]158 μm-to-LTIR ratios with the [CII]158 μm/[CI]369 μm CLOUDY models (see Fig. 8), we constrained the FUV flux to G0 ≃ 3 × 10⁴ − 105 in QSO PJ231−20. A similar value was reported for the J0439+1634 quasar at z ≃ 6.5 by Yang et al. (2019a).
8. Molecular medium
8.1. CO rotational lines
Molecular clouds consist almost entirely of molecular hydrogen (H2). Unfortunately, H2 has a zero electric dipole moment and high vibrational energy levels, thus it is a poor radiator in the physical conditions of the cold ISM. The most abundant molecule after H2 is CO; it has a weak permanent dipole moment and its rotational levels are primarily populated by collisions with H2. CO emission has been widely detected in normal galaxies in the local Universe (see, e.g., Saintonge et al. 2017, 2018; Tacconi et al. 2020 for a review) and in the highest-redshift quasars and SMGs (e.g., Riechers et al. 2013; Strandet et al. 2017; Venemans et al. 2017c; Novak et al. 2019; Li et al. 2020b), and it provides key information for characterizing the ISM. Low-J (Jup < 6) CO lines have a low critical density (ncrit ∼ 103 cm−3) and excitation temperature, therefore they are associated with cold molecular gas in PDRs. In contrast, high-J (Jup > 7) transitions have a high critical density (ncrit ∼ 105 cm−3) and mainly trace the high-density and/or high-temperature gas, and their excitation is typically explained by an intense X-ray radiation field impinging the molecular clouds in the central region of galaxies (XDRs) or by shocks produced by AGN-driven outflows (e.g., Meijerink et al. 2013; Gallerani et al. 2014; Mingozzi et al. 2018; Carniani et al. 2019). By combining multiple CO lines, we can therefore study the CO spectral line energy distribution (SLED). This distribution is a powerful tool for distinguishing the contribution of star formation and AGN (PDRs vs. XDRs) to the CO line emission and to constrain the properties of different gas phases, such as the density of the medium and the intensity of the radiation field (e.g., Riechers et al. 2009, 2013; Stefan et al. 2015; Yang et al. 2017; Cañameras et al. 2018; Carniani et al. 2019).
We detected multiple CO lines (7−6, 10−9, 15−14, and 16−15) in QSO host PJ231−20 with various degrees of significance, but we detect only CO(7−6) and CO(10−9) in the companion galaxy. We also only have a marginal CO(15−14) detection in QSO PJ308−21. The measurements are reported in Table 3.
8.2. CO(1–0)-normalized SLEDs
The CO SLED shows the relative luminosity of various CO transitions in an astrophysical source. It is used to gauge the underlying physical conditions (density, intensity, and source of the radiation field) of the CO-emitting gas. The intensity of the observed lines is usually normalized to the ground transition, CO(1−0), which cannot be observed with ALMA in the targeted sources. Nevertheless, we estimated its intensity following empirical relations of the CO(1−0) and the IR luminosity (see, e.g., Carilli & Walter 2013, for a review). Alternatively, the dust masses estimated via the Rayleigh-Jeans dust continuum (Sect. 5) can be converted into a CO(1−0) luminosity via a gas-to-dust mass ratio, δgdr, and a CO-to-H2 (light-to-mass) conversion factor, αCO (see Bolatto et al. 2013): 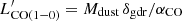 .
.
By starting from the dust masses derived in Sect. 5, we therefore first estimated the molecular gas mass MH2 of our sources by adopting δgdr = 100 (e.g., Genzel et al. 2015, see Sect. 9). By employing the typical value of αCO = 0.8 (K km s−1 pc2)−1 (Downes & Solomon 1998) that was adopted in the literature for SMGs and quasar hosts (see Carilli & Walter 2013 for a comprehensive discussion) and assuming that 75% of the dust-derived gas mass is in molecular form (e.g., Riechers et al. 2013; Wang et al. 2016; Venemans et al. 2017c), we then find LCO(1 − 0) ∼ 2.4 × 10⁶ L⊙ for QSO PJ231−20 and LCO(1 − 0) ∼ 2.6 × 10⁵ L⊙ for QSO PJ308−21. On the other hand, in the case of companion galaxies, we assumed Tdust = 47 K and found LCO(1 − 0) ∼ 1.1 × 10⁶ L⊙ and ∼0.4 × 10⁵ L⊙ for the source in systems PJ231−20 and PJ308−21, respectively. These values increase by a factor of ∼2× when a dust temperature of 35 K is assumed. However, they are consistent within the uncertainties with the values obtained adopting a higher dust temperature.
In Fig. 9 we compare the CO measurements of our sources, normalizing by CO(1−0) with the average CO(1−0)-normalized SLEDs of low-z starburst galaxies and AGN, respectively (Mashian et al. 2015; Rosenberg et al. 2015), the Milky Way Galactic center (Fixsen et al. 1999), and various measurements of z > 6 sources retrieved from the literature. The high-z sources we show include the quasars J2310+1855 at z = 6.00 (Carniani et al. 2019; Shao et al. 2019; Li et al. 2020b), J1319+0959 at z = 6.12 (Wang et al. 2013; Carniani et al. 2019), J1148+5251 at z = 6.4 (Walter et al. 2003; Riechers et al. 2009; Stefan et al. 2015; Gallerani et al. 2014), J0439+1634 at z = 6.52 (Yang et al. 2019a), and J0305−3150, J0109−3047, and J2348−3054 at z = 6.61, 6.79, and 6.90, respectively (Venemans et al. 2017c)3, and the z = 6.34 SMG HFLS 3 (Riechers et al. 2013). For the quasars for which LCO(1 − 0) was not available in the literature, we derived LCO(1 − 0) from dust masses provided in Carniani et al. (2019) using the same assumptions as described above for systems PJ231−20 and PJ308−21. In addition, we report the CO SLED models obtained from the ASPECS ALMA large program for z ∼ 1 − 2 starburst galaxies (Boogaard et al. 2020).
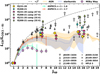 |
Fig. 9. Average CO(1−0)-normalized SLEDs (in L⊙). Colored circles and diamonds are measurements obtained in this work for systems PJ231−20 and PJ308−21. For the companion galaxies we show the two SLEDs obtained assuming Tdust = 47 K (filled half-top symbols) and 35 K (filled half-bottom symbols). Empty symbols refer to the CO ladders of other high-z quasars and one SMG (HFLS 3) from the literature (see Riechers et al. 2013; Venemans et al. 2017c; Carniani et al. 2019; Yang et al. 2019a; Li et al. 2020b, and references therein). Average CO SLEDs of local AGN and starburst galaxies from the literature (Mashian et al. 2015; Rosenberg et al. 2015) are reported by the dashed orange and dotted blue lines, respectively. Shaded areas are the confidence limits (computed as the 16th and 85th percentile of the distribution, respectively). Violet squares are the Milky Way Galactic center CO-normalized ladders from Fixsen et al. (1999). Average CO SLEDs of starburst galaxies at z ∼ 1 − 1.6 and z ∼ 2 − 2.6 from ASPECS are shown as green and red lines, respectively. The dashed gray line is the expected thermalized CO SLED in the Rayleigh-Jeans limit. |
Despite the large uncertainties, we can identify an overall trend for the low-z starburst and AGN CO SLEDs. Starburst CO SLEDs typically reach a peak at Jup ≃ 6 − 7 and show a steady decline afterward. The average CO SLED of local AGN is more excited at high-J (Jup ≳ 9 − 10) than is that of the starbursts, consistent with the scenario in which high-J CO transitions are associated with a highly excited medium due to the strong radiation field or shocks produced by the AGN activity.
Here, the QSO PJ231−20 CO SLED is similar to those of local AGN. In particular, the observed CO(10−9)-to-CO(1−0) luminosity ratio can help us to distinguish between AGN and the starburst regime. On the other hand, the CO SLED of the PJ231−20 companion galaxy is consistent within ∼1σ with both the starbursts and AGN population, even when the upper limits on the CO(15−14)-to-CO(1−0) and CO(16−15)-to-CO(1−0) luminosity ratios are taken into account. On the other hand, when we assume a dust temperature of 35 K, the CO SLED appears similar to the average CO SLED of starburst galaxies. However, Mazzucchelli et al. (2019) failed to detect the PJ231−20 companion in the rest-frame optical/UV wavelengths, revealing that this source is highly dust-enshrouded, with an SED similar to that of Arp 220, which is a highly star-forming and highly dust-obscured ULIRG in the local Universe. In addition, Connor et al. (2020) did not detect the PJ231−20 companion even in X-ray observations, which rules out the presence of an AGN in this source, at least with a luminosity similar to that of optically selected quasars. These previous studies suggest that star formation probably dominates the radiation field (and therefore the CO excitation) in this source. While little information is available for the PJ308−21 companion, we observe a high CO(15−14)-to-CO(1−0) luminosity ratio for the quasar host, possibly revealing the contribution of the AGN that excites this high-J CO ladder (see, e.g., Schleicher et al. 2010; Gallerani et al. 2014; Carniani et al. 2019). Finally, the observed CO(7−6)-to-CO(1−0) luminosity ratios in the quasar host PJ231−20 and its companion, and the upper limit available for QSO PJ308−21, are lower than those of other z > 6 quasars (e.g., Venemans et al. 2017c), but are consistent within the uncertainties with the average CO SLED model of the z ≳ 2 starburst galaxies in the ASPECS field. Interestingly, the latter appears to be fairly similar to the average CO SLED of local starburst galaxies. However, we note that the CO luminosity ratios in high-z sources have large uncertainties. In particular, the estimate of LCO(1 − 0) is significantly affected by the assumed gas-to-dust ratio and the uncertainties on dust mass obtained from the dust SED (see, e.g., Sect. 5).
8.3. CO SLED models
From the CLOUDY grids, we retrieved the CO line intensities and normalized them to the CO(1−0) line intensity, thus obtaining the normalized CO SLEDs as function of nH and radiation field flux (G0 or FX in the case of PDR and XDR models, respectively). In Fig. 10 we show the CO SLED models in the PDR and XDR case for two values of cloud gas density, nH ≃ 0.7 × 10³ and ≃1 × 105 cm−3, for which we varied the radiation field strength at fixed hydrogen column density NH = 1023 cm−2. The results show that in the PDR case, the CO SLED is almost independent of G0, in contrast to the XDR case. These behaviors are the direct consequence of a completely different heating mechanism driven by absorption of UV and X-ray photons. X-rays have very low cross sections and therefore can penetrate much deeper into the cloud (at column densities > 1022 cm−2). Furthermore, X-ray photons have a higher heating efficiency than UV photons, which maintains molecular clouds at a high temperature even at high column density (Maloney et al. 1996; Lepp & Dalgarno 1996; Meijerink & Spaans 2005). As expected, in the PDR and XDR cases, the peak of the CO SLED rises and shifts to higher J values as the density increases. The population of high-J CO levels (set by the competition of collisional excitation and radiative de-excitation) increases with increasing cloud density due to the higher critical densities of these lines and progressively thermalizes, saturating at a certain value. In the optically thick and high-temperature (or low-frequency) limit, the luminosities (in L⊙ units) of the CO rotational lines are approximately proportional to J3 (see, e.g., Obreschkow et al. 2009; da Cunha et al. 2013; Narayanan & Krumholz 2014). At higher-J transitions, the PDR CO SLED drops considerably and flattens at a low level due to the small amount of hot gas in the outer layer of the molecular cloud. On the other hand, in XDRs, a much larger fraction of the gas is at higher temperature, thus the CO SLED does not drop as dramatically. For this reason, observations of high-J CO lines are expected reveal an additional source of heating, for example, X-rays (see, e.g., Schleicher et al. 2010). We note that our CO SLED model predictions agree with other PDR/XDR CLOUDY models reported in the literature (e.g., Vallini et al. 2018, 2019).
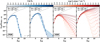 |
Fig. 10. CLOUDY CO(1−0)-normalized SLED models in the PDR (left panels) and XDR regime (right panels) for which the intensity of the incident radiation field was varied over the entire parameter space and for two reference values of total hydrogen density (nH = 102.9, 105.1 cm−3) and column density NH = 1023 cm−2. PDR cases are shown in blue, and XDRs are in red. Both are color-coded according to the values of the radiation field flux. The dashed gray line indicates the J3 curve, which is the expected trend of the CO SLED in LTE (in the optically thick and high-temperature or low-frequency limit). |
For QSO PJ231−20, the mere detection (although at modest significance) of very high-J CO transitions, with estimated LCO(15 − 14)-to-LCO(1 − 0) and LCO(16 − 15)-to-LCO(1 − 0) ratios of ∼100, immediately points to a significant XDR contribution. In Fig. 11 we show our best-fit CLOUDY models of the CO SLED in QSO PJ231−20 obtained by minimizing χ2. The high-J normalized CO fluxes (Jup = 15, 16) in QSO PJ231−20 cannot be reproduced by a single PDR model. We obtained excellent agreement using a composite (PDR+XDR) model in the form  , adopting NH = 1023 cm−3. Here WPDR and WXDR are the relative contributions of the PDR (
 ) and XDR component (
 ) to the CO(1−0) emission, respectively. The best-fit model has WPDR = 0.90 ± 0.04 and WXDR = 0.10 ± 0.04, a total hydrogen density
  cm−3,
cm−3,  cm−3, and a UV/X-ray radiation field strength of G0 ∼ 1 × 10⁵ and FX ∼ 10 erg s−1 cm−2, respectively. Because we considered the same column densities for PDR and XDR models, WPDR and WXDR are directly connected with the CO mass budget in the ISM. Therefore this result indicates that PDRs account for ∼90% of the molecular mass in the quasar host. However, while XDRs account for a small fraction of the molecular mass, they dominate the CO emission at Jup ≥ 10. In QSO PJ231−20, we measured
  . This ratio is ∼30% with respect to the value expected for CO thermalized emission in the optically thick and Rayleigh-Jeans limit (described by the J3 curve in Fig. 11).
 |
Fig. 11. CO(1−0)-normalized SLED fits of QSO PJ231−20. Gold circles indicate the CO luminosity ratios measured in the quasar. The dot-dashed black line is the best-fit model using a single XDR model. The composite (PDR+XDR) model described in the text is represented with the solid black line. The dashed blue and red lines show the PDR and XDR component, respectively. The shadowed area indicates the 1σ uncertainties on the normalization values. Best-fit parameters are reported in the legends at the bottom of the figure. The dashed gray line is the theoretical trend (∝J3) of the CO SLED in the LTE, optically thick, and high-temperature (or low frequency) limit. The red and blue diamonds (slightly shifted horizontally for clarity) are the CO(1−0)-normalized SLED in the PJ231−20 companion galaxy and QSO PJ308−21, respectively. For the PJ231−20 companion we report the CO SLEDs obtained assuming Tdust = 47 K (half-top filled magenta diamonds) and 35 K (half-bottom filled magenta diamonds, see Sect. 8.2). |
However, although the composite model allows us to accurately reproduce the observed CO SLED in QSO PJ231−20, the number of free parameters is greater than the number of data points, which produces degeneracies in the best-fit parameters. In Fig. 11 we also show the best-fit model obtained by employing a single XDR component. In this case, the best-fit model approximately agrees with the observed CO SLED in QSO PJ231−20, with a value nH ∼ 4 × 102 cm−3, but it indicates an extreme value of the X-ray radiation field intensity of FX ∼ 102 erg s−1 cm−2, corresponding to the upper boundary of the parameter space. Therefore this result should be taken into account with caution.
In Fig. 11 we also report the observed CO SLED in the PJ231−20 companion galaxy and QSO PJ308−21. Despite detecting LCO(7 − 6)/LCO(1 − 0) and LCO(10 − 9)/LCO(1 − 0) in the PJ231−20 companion, we cannot safely infer a significant XDR contribution in this source because we lack high-J CO detections. On the other hand, the high LCO(15 − 14)/LCO(1 − 0) ∼ 3 × 10² measured in QSO PJ308−21 (although with a low S/N) can only be reproduced with our models by adopting a strong XDR component.
Overall, our CO SLED modeling suggests that a significant contribution to CO emission arises from clouds that are exposed to X-ray radiation, at least in quasar hosts. This result appears to be in contrast with our [CII]158 μm/[CI]369 μm modeling discussed in Sect. 7.3. However, in our composite PDR+XDR model, we found that PDRs dominate the molecular mass budget and thus dominate the [CII]158 μm and [CI]369 μm emission. In this scenario, the high-J CO lines mainly arise from the molecular medium in the central region of the quasar host galaxy, while emission from lower-J CO lines and FSLs traces the ISM on larger scales. The good correlation of the [CI] and J ≤ 7 CO lines suggests that these lines trace the spatially extended gas reservoir associated with vigorous star formation rather than the denser and more concentrated gas that is traced by high-J CO lines (see, e.g., Gerin & Phillips 2000; Engel et al. 2010; Ivison et al. 2011; Jiao et al. 2017 for studies of nearby sources, and, e.g., Weiß et al. 2005; Tacconi et al. 2008; Bothwell et al. 2010, 2013; Riechers et al. 2011; Walter et al. 2011; Yang et al. 2017; Valentino et al. 2018, 2020, for intermediate and high-z works).
Finally, we stress that the uncertainties reported in our CO(1−0)-normalized SLEDs are statistical errors that ignore any systematic uncertainties associated with the assumption of a gas-to-dust ratio by which we estimated the CO(1−0) luminosity in this work. Our results should therefore be considered tentative. In order to better constrain the relative contribution of PDRs and XDRs in these sources, we need observations of other CO lines over a wide range of values of J. We also point out that our analysis does not rule out the possibility that another source of heating such as cosmic rays, shocks, or mechanical heating from turbulence may contribute significantly to the mid- or high-J CO excitation (see, e.g., Hollenbach & McKee 1989; Flower & Pineau Des Forêts 2010; Mingozzi et al. 2018; Godard et al. 2019; Vallini et al. 2019).
8.4. H2O rotational lines
Water vapor emission is a tracer of the molecular warm dense phase of the interstellar medium (nH2 ≳ 105 − 106 cm−3, T ∼ 50 − 100 K, see Liu et al. 2017), where UV/X-ray radiation from newly formed stars or powerful AGN increases the dust temperature above that of ice evaporation (e.g., Cernicharo et al. 2006). In these regions, the H2O molecule can be released into the gas phase by photodesorption from dust grains (Hollenbach et al. 2009) or by sputtering of grains in shocked-heated regions (e.g., Bergin et al. 2003; González-Alfonso et al. 2012, 2013), where H2O becomes the third most abundant species and the strongest molecular emitter after the high-J (Jup > 7 − 8) CO transitions. The H2O molecule can also be formed in the gas phase through ion-neutral chemistry and neutral-neutral endothermic reactions (Graff & Dalgarno 1987; Wagner & Graff 1987; Hollenbach et al. 2009). Lower-level transitions (Eupper < 200 K) arise in collisionally excited gas with a kinetic temperature of ∼100 K and clump densities of about 3 × 106 cm−3, where they may play an important role as a cooling agent (e.g., Neufeld & Kaufman 1993; Neufeld et al. 1995; Bradford et al. 2011). On the other hand, due to the high critical density for collisional excitation of higher levels (ncrit ≳ 107 − 108 cm−3, e.g., Faure et al. 2007; Faure & Josselin 2008; Daniel et al. 2012), water excitation instead requires radiative excitation by an intense far-IR radiation field from warm dust (Weiß et al. 2010; González-Alfonso et al. 2014), and the intensity of the lines is found to be nearly linearly proportional with the total IR luminosity of the galaxies (Omont et al. 2013; Yang et al. 2013, 2016; Liu et al. 2017). Because both collisions and IR pumping are responsible for populating the water energy levels, H2O lines not only probe the physical conditions of the warm and dense molecular gas-phase ISM, but also provide important clues about the dust IR radiation density.
Previous ground-based observations of water lines in nearby galaxies were limited by telluric atmospheric absorption and consequently have been restricted to radio maser transitions and a few transitions in IR-luminous galaxies (e.g., Combes & Wiklind 1997; Menten et al. 2008). On the other hand, observational campaigns using space telescopes (e.g., Infrared Space Observatory (ISO), Herschel/PACS/SPIRE) have been successful in detecting H2O features in local galaxies (mainly in absorption; Fischer et al. 1999, 2010; González-Alfonso et al. 2004, 2008, 2010; González-Alfonso et al. 2012; van der Werf et al. 2010; Weiß et al. 2010; Rangwala et al. 2011; Spinoglio et al. 2012; Pereira-Santaella et al. 2013). Furthermore, various H2O emission lines have been detected at higher redshifts (z > 1 − 2) in starburst galaxies and in hyper or ultra luminous IR galaxies (Hy/ULIRGs, e.g., Bradford et al. 2011; Lis et al. 2011; Omont et al. 2011, 2013; van der Werf et al. 2011; Combes et al. 2012; Lupu et al. 2012; Bothwell et al. 2013; Yang et al. 2013, 2016, 2019b, 2020b) and also in a z > 6 SMG (Riechers et al. 2013) and a lensed z > 6 quasar host galaxy (Yang et al. 2019a).
We present submillimeter H2O emission in our two z > 6 nonlensed quasar host galaxies. In particular, we report three H2O line detections in QSO PJ231−20 (312 − 221, 321 − 312, and 303 − 212) and a tentative detection of H2O 303 − 212 in QSO PJ308−21, but we only have upper limits on water lines from the companion galaxies. The water vapor energy levels and the targeted (ortho-)H2O transitions are reported in Fig. 12. The H2O 312 − 221 and 321 − 312 lines are likely mainly produced by the cascade process in response to absorption of IR photons at 75 μm, while the H2O 303 − 212 line is more sensitive to collisions and is enhanced in systems with a higher gas kinetic temperature (e.g., van der Werf et al. 2011; González-Alfonso et al. 2014; Liu et al. 2017).
 |
Fig. 12. Part of the H2O energy level diagram. Para- and ortho-H2O ladders are shown together with the detected H2O line transitions (blue arrows). The magenta arrow indicates the IR radiative-pumped transition at 75 μm that populates the 321 level (see González-Alfonso et al. 2014; Liu et al. 2017). |
8.5. LH2O–LTIR relation
In the upper panel of Fig. 13 we compare the H2O 321 − 312 line with the total IR luminosity obtained through the fit of the dust SED of QSO PJ231−20 and its companion (see Table 4) with a sample of nearby ULIRGs presented in Yang et al. (2013). For this comparison, we also included H2O detections of z ∼ 2.5 − 3.5 Hy/ULIRGs from Yang et al. (2016), APM 08279+5255 at z ≃ 3.9 (van der Werf et al. 2011), the z = 6.34 SMG HFLS 3 (Riechers et al. 2013), and J0439+1634, a z ≃ 6.5 quasar host galaxy (Yang et al. 2019a). Our data are consistent within the uncertainties with the almost linear relation found by Yang et al. (2013, 2016),  . This correlation appears to be the straightforward consequence of the IR-pumping mechanism responsible for the population of the upper level (321) of the H2O molecules (Yang et al. 2013), which after absorption of far-IR photons, cascade via the lines we observe in an approximately constant fraction. However, Liu et al. (2017) emphasized that the medium-excitation H2O transitions (such as 321 − 312) probe the physical regions of galaxies in which a large fraction of FIR emission is generated. Therefore the observed LH2O − LTIR correlation could be largely driven by the sizes of FIR- and water vapor-emitting regions. The H2O detections presented in this work together with those of Riechers et al. (2013) and Yang et al. (2019a) extend the redshift range explored in the previous works by Yang et al. (2013, 2016), confirming that this relation also appears to hold at very high-z.
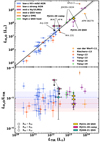 |
Fig. 13. Upper panel: LH2O(321 − 312) − LTIR relation. The solid black line shows the best power-law fit from Yang et al. (2013) considering the low-z HII+mild and strong AGN sample (blue and red squares, respectively). The gray area is the 1σ confidence limit. The gold and magenta squares indicate the quasar host PJ231−20 and its companion, respectively. In the case of the companion, we report the cases assuming Tdust = 47 K (left half-filled magenta square) and 35 K (right half-filled magenta square). These points are connected by a dotted black line. Purple squares are the mid-z Hy/ULIRGs of Yang et al. (2016). We also report measurements of APM 08279+5255 (van der Werf et al. 2011), the z ∼ 6.3 SMG HFLS 3 (Riechers et al. 2013), and the z ∼ 6.5 J0439+1634 quasar (Yang et al. 2019a). Empty squares indicate measurements that were not corrected for gravitational lensing. Lower panel: LH2O/LTIR vs. total IR luminosity. Symbols are the same as in the upper panel. Together with LH2O/LTIR for the 321 − 312 transition, we also report those for 312 − 221 and 303 − 212 for QSO PJ231−20, the companion galaxy, QSO PJ308−21, and the quasar J0439+1634, as indicated in the legend. |
Yang et al. (2013) found slightly different values of LH2O-to-LTIR ratios for the 321 − 312 transition in local AGN and star-formation-dominated galaxies with possible mild AGN contribution. However, apart from individual studies (e.g., González-Alfonso et al. 2010 for Mrk 231, and van der Werf et al. 2011 for APM 08279) showing that AGN could be the main power source exciting the H2O lines in this objects, it is still not clear how a strong AGN could affect the H2O emission. One possibility is that the buried AGN results in a higher TIR-to-75 μm luminosity ratio than in starburst galaxies because the shape of the IR SED of these sources is different (e.g., Kirkpatrick et al. 2015; Yang et al. 2016). In addition, high X-ray fluxes can photodissociate H2O molecules. On the other hand, a high dust continuum opacity at 100 μm (τ100) and/or large velocity dispersion can enhance the H2O luminosity (e.g., Arp 220, González-Alfonso et al. 2014; Yang et al. 2016).
For the 321 − 312 transition toward QSO PJ231−20, we find LH2O/LTIR ∼ 1.2 × 10⁻⁵, which is comparable with the ratio measured in the z ∼ 6.5 quasar J0439+1634 (Yang et al. 2019a). This value is higher than the average ratio measured by Yang et al. (2013) in local AGN-dominated sources (7 ± 3 × 10⁻⁶) and is consistent with that measured in star-forming galaxies (1.1 ± 0.6 × 10⁻⁵), suggesting a significant contribution of star formation to the IR radiation exciting the H2O line. In Fig. 13 we also report the LH2O-to-LTIR ratios for the 312 − 221 and 303 − 212 transitions detected in QSO PJ231−20 and the tentative H2O 303 − 212 detection in QSO PJ308−21. These values are in the range measured for the 321 − 312 transition in local ULIRGs.
8.6. H2O(321-312)-normalized SLED
By combining the three water vapor lines detected in QSO PJ231−20, we trace in Fig. 14 the line flux ratios, that is, the normalized H2O SLED, and we compare them with the results for local and high-z sources found in the literature. The SLEDs were normalized to H2O 321 − 312, a medium-excitation line that is predicted to be easily radiatively pumped in the warm dense medium (see Liu et al. 2017). Therefore the ratios with the other transitions directly reflect the effect of IR-pumping line excitation.
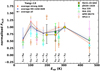 |
Fig. 14. H2O(321 − 312)-normalized H2O intensities (in Jy km s−1) as a function of the excitation temperature of the upper level. Gold circles are the H2O ratios measured in the PJ231−20 QSO. The solid black line reports the average H2O SLED of the whole sample of Yang et al. (2013). The gray shadowed area represents the 1σ uncertainty. The dashed red and blue lines indicate the average values of strong-AGN- and HII+mild-AGN-dominated galaxies, respectively, as classified by Yang et al. (2013). We also report data retrieved from the literature for the two nearby sources Arp 220 (Rangwala et al. 2011) and the AGN-dominated Mrk 231 (González-Alfonso et al. 2010). For comparison, we also show the H2O flux ratios observed in high-z sources such as APM 08279+5255 (van der Werf et al. 2011), the lensed z > 6 quasar J0439+1634 (Yang et al. 2019a), and the SMG HFLS3 (Riechers et al. 2013). The energy of the upper levels of the 220 − 211 and 312 − 303 transitions were shifted for clarity to −20 and +20 K, respectively. |
In Fig. 14, the average H2O SLED of the local ULIRG sample by Yang et al. (2013) shows two peaks at the energy of H2O 202 − 111 and 321 − 312 transitions, indicating a high IR pumping efficiency at 75 μm. This is consistent with the models of Liu et al. (2017), which show that these two lines are efficiently pumped in the warm ISM component at Tdust ≳ 40 K. The bulk H2O emission observed in star-forming galaxies of Yang et al. (2013) is explained by González-Alfonso et al. (2014) by a model with Tdust = 55 − 75 K, τ100 ∼ 0.1 and H2O column density NH2O ∼ (0.5 − 2) × 1017 cm−2, including a significant contribution from collisional excitation and line radiative pumping. Despite significant uncertainties, the observed H2O line ratios in QSO PJ231−20 show a clear peak at the 321 − 312 transition. In particular, the line ratio 312 − 221/321 − 312 is consistent with the value observed in z ∼ 6.3 SMG HFLS 3 (Riechers et al. 2013) and in the z ∼ 6.5 quasar J0439+1634 (Yang et al. 2019a), whose H2O SLEDs also peak at 321 − 312. The stronger intensity of H2O 321 − 312 measured in QSO PJ231−20 than the other transitions lower in the cascade, in conjunction with the high critical density of the observed transitions (≳108 cm−3), suggests that the contribution from collisional excitation of the upper energy levels of the observed water vapor transitions is minor. Other factors that could contribute to the QSO PJ231−20 H2O SLED peak at 321 − 312 are the shape of the IR dust SED that peaks close to 75 μm, thus allowing high pumping efficiency, together with the large FWHM (∼400 km s−1) of the H2O 321 − 312 line, which increases the cross sections for absorbing pumping photons (e.g., González-Alfonso et al. 2014).
8.7. H2O SLED models
In this section we retrieve quantitative information about the ISM that is associated with the H2O emission by modeling the water vapor SLED using our CLOUDY models. Our CLOUDY outputs predict emerging intensities of a large number of water vapor transitions. In Fig. 15 we report the H2O SLED normalized to the H2O 321 − 312 line in the PDR and XDR regimes. We do this for two representative values of the total hydrogen density nH ≃ 2 × 102 cm−3 and ≃4 × 104 cm−3 for which we varied the radiation field strength with a fixed total hydrogen column density NH = 1024 cm−2.
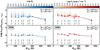 |
Fig. 15. CLOUDY H2O(321 − 312)-normalized SLED models in the PDR (left panels) and XDR regime (right panels), for which we varied the intensity of the incident radiation field over the entire parameter space and for two reference values of total hydrogen density (nH = 102.3, 104.6 cm−3), and column density NH = 1024 cm−2. PDR cases are shown in blue and XDRs are red. They are color-coded according to the values of the radiation field flux. The energy of the upper levels of the 220 − 211 and 312 − 303 transitions were shifted for clarity to −20 and +20 K, respectively. In order to exclude unphysical models, we report H2O SLEDs in which the H2O 312 − 221 intensity is > 10−2× that of the corresponding CO(10−9) line. |
In the PDR and XDR cases, the H2O SLED flattens as the intensity of the radiation field increases. In particular, the LH2O/LH2O(321 − 312) line ratios for transitions with energy upper level Eup < 300 K approach similar values that vary within a factor of ∼4. Because the total hydrogen density of the cloud models spans a range that is well below the typical critical density of H2O lines (∼108 − 109 cm−3), this might be explained in terms of a progressively more efficient IR pumping of the high-lying H2O energy levels as the UV/X-ray photon flux increases, which subsequently cascade radiatively toward low-energy levels. This implies that these H2O lines tend to statistical equilibrium, in agreement with the analysis of González-Alfonso et al. (2014) and Liu et al. (2017), for instance. Furthermore, as also mentioned in Sect. 8.4, at a gas kinetic temperature ≳300 K, water molecules can form in the gas phase through the neutral-neutral endothermic reaction OH + H2 → H2O + H. Therefore an increase in total hydrogen density (nH > 104 cm−3) inside the cloud requires a higher radiation field flux (G0 > 2 × 10⁴, FX > 0.05 − 0.1 erg s−1 cm−2) to maintain the gas temperature above the reaction activation barrier in a large volume of the cloud in order to produce a significant H2O column density NH2O > 1015 cm−2 (see also, e.g., Neufeld et al. 1995, 2002; Cernicharo et al. 2006; Meijerink et al. 2011). On the other hand, in XDRs, strong X-ray radiation can photodissociate a large fraction of the H2O molecules, thus quenching their line emission. However, because the H2O 321 − 312 transition is highly sensitive to the pumping by IR photons (e.g., Liu et al. 2017), low UV or X-ray fluxes cannot efficiently populate its upper level. This produces unphysical results in the predicted LH2O/LH2O(321 − 312). In Fig. 15, to exclude such non-physical results that clearly are at odds with observations, we report the H2O SLEDs for which the H2O 312 − 221 predicted intensity is at least 10−2× that of the CO(10−9) line because these two lines have a similar frequency and are observed to have similar fluxes (see Fig. 1 of this work, but see also, e.g., Riechers et al. 2013; Yang et al. 2019a).
Using the H2O line ratios predicted by our CLOUDY models, we performed the H2O SLED fit of QSO PJ231−20. We report the results in Fig. 16. The observed H2O line ratios of QSO PJ231−20 cannot be satisfyingly reproduced by any models with NH = 1023 cm−2, while the agreement between data and best-fit model significantly improves in a higher column density PDR model with NH = 1024 cm−2. The resulting best-fit model indicates a high-density medium with nH ∼ 0.8 × 105 cm−3, exposed to a strong FUV radiation field with G0 ∼ 5 × 10⁵. The mere requirement of a high cloud column density implies that the observed water vapor transitions arise deep in the cloud where the water vapor column density reaches NH2O ≳ 3 × 1017 cm−2. Furthermore, because the H2O line ratios observed in QSO PJ231−20 are similar and because the three H2O transitions 321 − 312, 312 − 221, and 303 − 212 have similar frequencies and are connected by a cascade process, our result suggests that these lines are near statistical equilibrium. However, the low number of data points makes the result uncertain. In particular, the cloud density is poorly constrained with the fit. On the other hand, the high density value found for QSO PJ231−20 H2O lines is in the range that is typically inferred from H2O SLED modeling in local sources (see, e.g., González-Alfonso et al. 2014; Liu et al. 2017) and in high-z quasars (e.g., van der Werf et al. 2011).
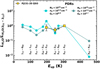 |
Fig. 16. Best-fit models of the H2O(321 − 312)-normalized SLED in QSO PJ231−20. Gold squares are the observed line ratios, and light and dark blue circles are the PDR best-fit models with NH = 1023 and 1024 cm−2, respectively. The best-fit parameters are indicated in the upper part of the panel. |
8.8. OH transitions
The hydroxyl radical (OH) is a key intermediary molecule that forms in warm PDRs exposed to FUV radiation through the endothermic reaction between atomic oxygen and vibrationally excited  . Further reaction with H2 leads to the formation of H2O. On the other hand, water vapor can photodissociate in gas unshielded from FUV radiation, producing OH. OH can also form in shocked gas where high gas temperatures can overcome the activation barrier of the O + H2 reaction, or in quiescent obscured regions irradiated by cosmic rays or X-rays through ion-neutral reactions starting from
  (Hollenbach & Tielens 1997; Agúndez et al. 2010). The OH molecule has a high dipole moment (1.668 Debye), therefore the radiative rates of its rotational transitions are generally higher than those of CO. The critical densities of OH transitions are about 109 − 1010 cm−3 (Destombes et al. 1977; Dewangan et al. 1987), implying that OH excitation cannot be driven by collisions. Radiative pumping by IR photons is typically invoked to explain its emission. The electronic ground state has two fine-structure levels, 2Π3/2 (the ground state) and 2Π1/2, each of which has two Λ-doubling levels (further split into two hyperfine sublevels). Furthermore, the OH molecule can also have a rotational angular momentum (J), resulting in a ladder of rotational states with increasing J. The OH ground state 2Π3/2 (J = 3/2) can absorb IR radiation near 119 μm, 79 μm, 53 μm, and 35 μm, followed by spontaneous radiative decay that repopulates the four ground sublevels, including the FIR OH cross-ladder transitions whose radiative rates are ∼100× weaker than the rotational transitions. OH transitions, either in absorption or emission, were detected in local Seyfert galaxies, including M 82 (Colbert et al. 1999), NGC 253 (Fischer et al. 1999; Bradford et al. 1999), IRAS 20100−4156 and 3Zw35 (Kegel et al. 1999), Arp 220 (González-Alfonso et al. 2004), NGC 1068 (Smith et al. 2004; Spinoglio et al. 2005), Mrk 231 (González-Alfonso et al. 2008), and NGC 4418 (González-Alfonso et al. 2014). Systematic searches for OH emission have revealed that some OH lines exhibit P-Cygni profiles, suggesting massive molecular outflows in samples of local (U)LIRGs and quasars (Fischer et al. 2010; González-Alfonso et al. 2010, 2012, 2013, 2017; Sturm et al. 2011; Spoon et al. 2013; Veilleux et al. 2013; Herrera-Camus et al. 2020). OH emission has also been detected at z ≳ 6 in the SMG HFLS 3 (Riechers et al. 2013) and in the quasar J1319+0950 (Herrera-Camus et al. 2020), demonstrating the feasibility of detecting these lines at very high-z with ground-based observations.
We present detections of the Λ-doublet OH163 μm in QSO PJ231−20 and the companion galaxy together with a tentative detection in QSO PJ308−21. When this doublet was detected in other galaxies, it was mostly observed in emission. These lines are likely produced by a fluorescence-like mechanism through absorption of IR photons at 35 μm and 75 μm emitted by warm dust, and thus they trace the warm moderate-dense molecular medium (T ∼ 150 − 300 K, nH2 ≲ 104 − 105 cm−3) in star-forming regions (e.g., Goicoechea & Cernicharo 2002; Goicoechea et al. 2005). The observed OH line fluxes in our systems are comparable with those of mid-J CO and are greater than those of the H2O lines, showing that OH can be a powerful tracer of the molecular medium at z ∼ 6. We find similar LOH-to-LTIR ratios ∼2 − 4 × 10⁻⁵ in quasars PJ231−20 and PJ308−21, and we estimate a higher value ∼10−4 in the PJ231−20 companion galaxy. A similar value is found in the SMG AzTEC-3 and HFSL 3 at z = 5.3 and z = 6.34, respectively (Riechers et al. 2013, 2014).
8.9. H2O-to-OH163 μm ratio
To obtain further constraints on the molecular medium in the targeted systems, we inspected the line intensity ratios of the observed H2O lines and the OH163 μm doublet. The formation of the OH molecule can occur through the neutral-neutral reaction H2 + O → OH + H, which can successively react to form H2O, or by destruction of water (see, e.g., Elitzur & de Jong 1978; Poelman & Spaans 2005; Meijerink et al. 2011). Furthermore, the H2O and OH molecules have very high critical densities ≳108 cm−3, and IR pumping might have a dominant role in their excitation. Therefore the H2O lines and OH163 μm are expected to arise in regions with similar physical properties.
In Fig. 17 we compare the observed values of the H2O-to-OH163 μm line ratios with our CLOUDY predictions in a diagnostic plot. We considered OH163 μm as the sum of the luminosity of the two Λ-doubling transitions of OH163 μm, including the hyperfine structure lines. For QSO PJ231−20, the model predictions are fully consistent with what we found in Sect. 8.7. This indicates a high-density medium exposed to a strong FUV field. We also found similar constraints for the companion galaxy and QSO PJ308−21, with G0 > 104 and nH < 1.5 × 10⁴ − 0.5 × 106 cm−3, respectively. These findings, albeit for a lower column density, also broadly agree with the constraints obtained from [CII]158 μm-to-[CI]369 μm ratios and the CO SLED modeling (see Sects. 7.3 and 8.3).
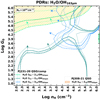 |
Fig. 17. CLOUDY models of H2O/OH163 μm luminosity ratios. Model predictions are reported for QSO PJ231−20 (solid and dotted lines indicate values and their uncertainties) and 3σ upper limits for its companion (dashed lines). The dashed gold area reports the constraints retrieved from QSO PJ308−21 detections. The clouds’ column density of the models is NH = 1024 cm−2. |
9. Mass budgets
Starting from the FSL luminosities obtained in this work (see Table 3) and adopting simplistic assumptions, we can estimate the mass contributions in our systems in the form of ionized, atomic, and molecular mediums. In the two-level approximation, assuming LTE and in the optically thin limit and Rayleigh-Jeans regime, the beam-averaged column density of a species s in the upper level u is (see, e.g., Goldsmith & Langer 1999)
 (7)
(7)
with
 (8)
(8)
Here, SΔv is the observed line velocity-integrated flux, Aul is the Einstein coefficient, Q(Tex) is the partition function of the species s (depending on the excitation temperature Tex), and gu and Eu are the statistical weight and the energy of the upper level, respectively. The total number of particles of species s is obtained by integrating over the size of the emitting region. Using the definition of line luminosity (Solomon et al. 1992), we can express the total mass of the species s as
 (9)
(9)
where C = 9.52 × 1041 is the conversion factor between km pc2 and cm3, and ms is the mass of the species s.
Using Eq. (9), we derive the CI mass following Weiß et al. (2003) through
![Mathematical equation: $$ \begin{aligned} M_{\rm CI}[M_{\odot }] = 4.566\times 10^{-4}Q(T_{\rm ex})\frac{1}{5}e^{62.5/T_{\rm ex}}L\prime _{\rm [CI]_{\rm 369\,\upmu m}}, \end{aligned} $$](/articles/aa/full_html/2021/08/aa39696-20/aa39696-20-eq187.gif) (10)
(10)
where Q(Tex) = 1 + 3e−T1/Tex + 5e−T2/Tex is the CI partition function, and T1 = 23.6 K, T2 = 62.5 K are the energies (per unit of kB) above the ground state of the two [CI] (3P1 → 3P0) and (3P2 → 3P1) transitions, respectively. Assuming an excitation temperature of Tex = 30 K (see, e.g., Walter et al. 2011), we find for QSO PJ231−20 a neutral carbon mass of MCI = (0.7 ± 0.3) × 107 M⊙, and carbon mass limit of MCI < 0.4 − 0.5 × 10⁷ M⊙ for its companion and the sources in system PJ308−21. We note that if we assumed a higher excitation temperature Tex = 50 K, the derived MCI would be ∼40% lower. Using these mass estimates, we can place constraints on the molecular gas mass (MH2) using the atomic carbon-to-molecular hydrogen abundance ratio derived by Walter et al. (2011) for a sample of z = 2 − 3 FIR-bright sources (SMGs and quasar host galaxies), X[CI]/X[H2]=MCI/(6MH2) = (8.4 ± 3.5) × 10−5. Applying this abundance, we obtain a molecular gas mass of  for QSO PJ231−20 and MH2 < 1.8 × 10¹⁰ M⊙ for the companion galaxy and the other sources in system PJ308−21.
Following Ferkinhoff et al. (2011), in the high-temperature limit, we can also derive the minimum mass of ionized hydrogen (H+) assuming that all nitrogen in HII regions is singly ionized as
![Mathematical equation: $$ \begin{aligned} M_{\rm min}(\mathrm{H^+}) = \frac{L_{\mathrm{[NII]}\mathrm{205\,\upmu m}} m_{\rm H}}{(g_1/Q(T_{\rm ex}))A_{10}h\nu _{10}\chi (\mathrm{N^+})}\approx 2.27\frac{L_{\mathrm{[NII]}\mathrm{205\,\upmu m}}}{L_{\odot }}M_{\odot }, \end{aligned} $$](/articles/aa/full_html/2021/08/aa39696-20/aa39696-20-eq189.gif) (11)
(11)
where A10 is the Einstein coefficient for spontaneous emission of the [NII]205 μm (3P1 → 3P0) transition (2.08 × 10⁻⁶ s−1), g1 = 3 is the statistical weight of the J = 1 level, ν10 = 1461.1318 GHz is the rest-frame frequency of the transition, mH is the mass of the hydrogen atom, and χ(N+) is the N+-to-H+ abundance ratio. For the minimum mass case, in our working assumption χ(N+) = χ(N). When we assume solar metallicity, the HII-region gas-phase nitrogen abundance therefore is χ(N) = 9.3 × 10⁻⁵ (Savage & Sembach 1996). This gives Mmin(H+) = (4.1 ± 1.6) × 108 M⊙, and (1.8 ± 1.2)×108 M⊙ for the PJ231−20 QSO host and companion galaxy, respectively.
Starting from the dust mass budgets derived in Sect. 5, we can also obtain independent measurements of the gas masses adopting the local gas-to-dust ratio of δgdr ∼ 70 − 100 (see, e.g., Draine et al. 2007; Sandstrom et al. 2013; Genzel et al. 2015). A similar gas-to-dust ratio of ∼70 has also been found in high-z starburst galaxies (e.g., Riechers et al. 2013; Wang et al. 2016). Adopting the local value, we obtain (atomic and molecular) gas masses of Mgas = (3.6 − 5.1) × 1010 M⊙ and (1.6 − 3.4) × 1010 M⊙ for the PJ231−20 QSO host and companion galaxy, respectively, and Mgas = (3.8 − 5.4) × 109 M⊙ and (0.7 − 2.0) × 109 M⊙ for the PJ308−20 QSO host and companion galaxy, respectively. When we further assume that ∼75% of the dust-derived gas mass is in molecular form (e.g., Riechers et al. 2013; Wang et al. 2016), these values are consistent with those derived above from MCI applying the CI-to-H2 abundance ratio.
Finally, from the gas mass values derived above, we obtain a lower limit on the gas ionization percentage of Mmin(H+)/MH2 > 1 − 3%. For comparison, Ferkinhoff et al. (2011) found values < 1% for nearby galaxies (in the sample of Brauher et al. 2008), while high-ionization percentages suggest a high SFR density (> 102 − 103 M⊙ yr−1 kpc−2, see Ferkinhoff et al. 2011).
10. Summary and conclusions
We have presented ALMA observations of two quasar host–companion galaxy pairs PJ231−20 and PJ308−21 at z > 6, captured when the Universe is < 900 Myr old. The companion galaxies were serendipitously discovered with previous ALMA observations in the field of known quasars, but they show no evidence of AGN activity. This multiline study investigated the effect of the star formation and AGN activity on the ISM in massive galaxies at the cosmic dawn.
The lines covered in the ALMA observations include tracers of the atomic ionized or neutral and molecular medium, such as [NII]205 μm, [CI]369 μm, CO(7−6, 10−9, 15−14, 16−15), H2O 312 − 221, 321 − 312, 303 − 212, and the OH163 μm doublet. However, for system PJ308−21, only half of the program was executed. This work was complemented with previously collected ALMA [CII]158 μm observations (Decarli et al. 2018) that were analyzed in a consistent way. In order to interpret our results and place quantitative constraints on the physical properties of the ISM in galaxies, we ran a set of PDR/XDR models by employing the CLOUDY radiative transfer code for which we varied the volume hydrogen density, radiation field strength, and total hydrogen column density. The main results obtained in this work are summarized below.
-
We modeled the FIR dust continuum on all the four targeted galaxies. We modeled this emission as a modified blackbody and inferred dust masses, spectral indexes, total IR luminosities, and SFRs (see Sect. 5 and Table 4).
-
From the analysis of the [CII]158 μm and [NII]205 μm lines, we found that ≳80% of [CII]158 μm emission in the quasar and companion galaxies of system PJ231−20 arises from neutral gas in the photodissociation regions rather from the fully (diffuse) ionized medium. Furthermore, the observed line deficits are comparable with those of local LIRGs.
-
The [CI]369 μm/TIR luminosity ratios in the targeted systems are similar to those measured in z ∼ 2 − 4 SMGs and quasars, revealing a high star-formation efficiency in our galaxies.
-
CLOUDY models suggest that [CII]158 μm and [CI]369 μm emission predominantly arises in PDRs illuminated by the FUV radiation field. In particular, constraints obtained from the [CII]158 μm-to-TIR and [CI]369 μm-to-TIR luminosity ratios for QSO PJ231−20 indicate a high FUV field intensity of G0 ∼ 105 (∼1.6 × 10² erg s−1 cm−2) and density of nH > 103. We found similar constraints for the other sources.
-
From the atomic fine-structure lines, we retrieved constraints on atomic carbon, ionized hydrogen, and molecular gas masses. The latter are consistent with the dust-derived gas masses assuming the local gas-to-dust ratio and that ∼75% of the gas mass is in molecular form. For the quasar and companion in system PJ231−20, we also inferred gas ionization percentages of > 1 − 3%, which is greater than the typical values observed in nearby galaxies, suggesting a high SFR density > 102 − 103 M⊙ yr−1 kpc−2.
-
The multiple mid- and high-J CO line detections allowed us to study the CO SLEDs (see Sect. 8.2). Despite large uncertainties, the QSO PJ231−20 SLED resembles those of local AGNs. A similar result is obtained for the companion galaxy. On the other hand, when we assumed a low dust temperature of 35 K, the CO SLED of the companion appears similar to the average SLED of local starburst galaxies. However, the mere detections of high-J (Jup = 16, 15) CO lines in the PJ231−20 and PJ308−21 quasars suggest an additional heating source that is not the PDRs. The CO SLED of QSO PJ231−20 is well reproduced by a CLOUDY PDR+XDR composite model. The result indicates that PDRs dominate the low- and mid-J CO line luminosities and account for ∼90% of the CO mass, while XDRs, which may be the main drivers of high-J CO emission lines, contribute to ∼10% of the mass. The latter likely resides in the central regions of the PJ231−20 QSO host galaxy, exposed to strong X-ray radiation due to the BH accretion. The best-fit PDR component indicates
 cm−3 and G0 ∼ 1 × 10⁵, and the XDR component is determined by
  cm−3 and FX ∼ 10 erg s−1 cm−2. However, because we have only a few data points, these results are affected by degeneracies.
 -
We detected three H2O lines (312 − 221, 321 − 312, and 303 − 212) in QSO PJ231−20, and H2O 303 − 212 in QSO PJ308−21. The QSO PJ231−20 lies on the
 trend found for low-z sources, suggesting that the H2O 321 − 312 line is predominantly excited by pumping of IR photons of the dust UV-reprocessed radiation field. The LH2O-to-LTIR ratios in the PJ231−20 and PJ308−21 systems are ∼10−5, which is within the range observed in starburst galaxies at low z. The observed H2O SLED in QSO PJ231−20 indicates that collisional excitation of the upper energy levels of the observed water vapor transitions is likely minor. Furthermore, the SLED is similar to that of other high-z sources. CLOUDY best-fit models are obtained using a single PDR component with nH ∼ 0.8 × 105 cm−3, G0 ∼ 5 × 10⁵ and a high hydrogen column density of NH = 1024 cm−2, indicating that H2O emission arises deeply in the molecular clouds with a high density, exposed to a strong radiation field.
 -
The H2O-to-OH163 μm ratios in QSO PJ231−20 predicted by CLOUDY are fully consistent with the results obtained from the H2O SLED modeling, indicating that OH163 μm doublet emission likely arises from similar regions traced by water vapor. We found similar constraints, but with large uncertainties, for the PJ231−20 companion galaxy and QSO PJ308−21, indicating that the ISM is exposed to strong FUV radiation field with G0 > 104. These results also broadly agree with the analysis of CO and atomic fine-structure lines.
In conclusion, in quasars PJ231−20 and PJ308−21, the AGN activity is mainly revealed through high-J CO line emission, requiring an additional source of heating other than PDRs, which might be provided by a strong X-ray radiation field. The CO SLEDs in conjunction with the nondetections of high-J CO lines in companions, at least for PJ231−20, suggest a less excited medium, possibly as a consequence of the lack of a strong AGN as suggested by previous optical/UV and X-rays observations. Then, the analysis of the atomic fine-structure and molecular lines, in conjunction with the analysis of H2O and OH163 μm transitions, indicates a strong radiation field in the quasar host and companion galaxies associated with massive episodes of star formation, as reflected by the enormous amount of dust (Mdust ≈ 0.5 × 10⁸ − 0.5 × 10⁹ M⊙) heated at relatively high temperature and huge gas reservoir (Mgas ≳ 1010 M⊙) and high star-formation efficiencies. However, although our analysis of the ISM properties highlights differences in the quasars and their companion galaxies, the current data do not allow us to definitively rule out the presence of an AGN in the companions, especially for the PJ308−21 companion galaxy, for which there is little information due to the lack of line detections.
This work demonstrates that a large variety of investigations can be carried out in the ISM of quasar hosts and SMGs at this high redshift by targeting emission lines arising from different gas phases and environments. Future deeper follow-up observations have to be conducted in order to achieve a higher S/N and sample additional FIR emission lines to provide a better understanding of the ISM in these systems. Moreover, more comparisons between AGN and non-AGN environments have to be made by observing more objects in this rich set of lines in the same redshift, thus providing us with a better statistics and an in-depth exploration of the interplay between AGN and star formation in extreme conditions at early epochs.
For a typical S/N ∼ 60 − 100 over a bandwidth of ∼4 GHz in ALMA band 3−6, the continuum emission is well described by a zeroth-order polynomial within the uncertainties.
The density at which the rate of collisional depopulation of a quantum level equals the spontaneous radiative decay rate.
See Table 2 in Carniani et al. (2019) and Table 1 in Venemans et al. (2017c) for the complete collection of measurements.
Acknowledgments
We thank the anonymous referee for the useful comments that significantly improve the paper. This paper makes use of the following ALMA data: ADS/JAO.ALMA#2015.1.01115.S, ADS/JAO.ALMA#2017.1.00139.S, ADS/JAO.ALMA#2019.1.00147.S. ALMA is a partnership of ESO (representing its member states), NSF (USA) and NINS (Japan), together with NRC (Canada), MOST and ASIAA (Taiwan), and KASI (Republic of Korea), in cooperation with the Republic of Chile. The Joint ALMA Observatory is operated by ESO, AUI/NRAO and NAOJ. MN and BV acknowledge support from the ERC Advanced Grant 740246 (Cosmic Gas). XF and JY acknowledge the supports from the US NSF grant AST 15-15115 and AST 19-08284. DR acknowledges support from the National Science Foundation under grant numbers AST-1614213 and AST-1910107. DR also acknowledges support from the Alexander von Humboldt Foundation through a Humboldt Research Fellowship for Experienced Researchers. RW acknowledges supports from the National Science Foundation of China (11721303, 11991052) and the National Key R&D Program of China (2016YFA0400703). This research made use of Astropy (http://www.astropy.org), a community-developed core Python package for Astronomy (Astropy Collaboration 2013, 2018), and Matplotlib (Hunter 2007).
References
- Abel, N. P., van Hoof, P. A. M., Shaw, G., Ferland, G. J., & Elwert, T. 2008, ApJ, 686, 1125 [Google Scholar]
- Abel, N. P., Dudley, C., Fischer, J., Satyapal, S., & van Hoof, P. A. M. 2009, ApJ, 701, 1147 [NASA ADS] [CrossRef] [Google Scholar]
- Agúndez, M., Goicoechea, J. R., Cernicharo, J., Faure, A., & Roueff, E. 2010, ApJ, 713, 662 [NASA ADS] [CrossRef] [Google Scholar]
- Alaghband-Zadeh, S., Chapman, S. C., Swinbank, A. M., et al. 2013, MNRAS, 435, 1493 [Google Scholar]
- Angulo, R. E., Springel, V., White, S. D. M., et al. 2012, MNRAS, 426, 2046 [CrossRef] [Google Scholar]
- Astropy Collaboration (Robitaille, T. P., et al.) 2013, A&A, 558, A33 [NASA ADS] [CrossRef] [EDP Sciences] [Google Scholar]
- Astropy Collaboration (Price-Whelan, A. M., et al.) 2018, AJ, 156, 123 [Google Scholar]
- Bañados, E., Decarli, R., Walter, F., et al. 2015, ApJ, 805, L8 [NASA ADS] [CrossRef] [Google Scholar]
- Bañados, E., Venemans, B. P., Decarli, R., et al. 2016, ApJS, 227, 11 [NASA ADS] [CrossRef] [Google Scholar]
- Bañados, E., Venemans, B. P., Mazzucchelli, C., et al. 2018, Nature, 553, 473 [NASA ADS] [CrossRef] [Google Scholar]
- Balmaverde, B., Gilli, R., Mignoli, M., et al. 2017, A&A, 606, A23 [NASA ADS] [CrossRef] [EDP Sciences] [Google Scholar]
- Becker, G. D., Bolton, J. S., & Lidz, A. 2015, PASA, 32, e045 [NASA ADS] [CrossRef] [Google Scholar]
- Beelen, A., Cox, P., Benford, D. J., et al. 2006, ApJ, 642, 694 [NASA ADS] [CrossRef] [Google Scholar]
- Begelman, M. C., Volonteri, M., & Rees, M. J. 2006, MNRAS, 370, 289 [NASA ADS] [CrossRef] [Google Scholar]
- Bergin, E. A., Kaufman, M. J., Melnick, G. J., Snell, R. L., & Howe, J. E. 2003, ApJ, 582, 830 [NASA ADS] [CrossRef] [Google Scholar]
- Bertoldi, F., Carilli, C. L., Cox, P., et al. 2003a, A&A, 406, L55 [NASA ADS] [CrossRef] [EDP Sciences] [Google Scholar]
- Bertoldi, F., Cox, P., Neri, R., et al. 2003b, A&A, 409, L47 [NASA ADS] [CrossRef] [EDP Sciences] [Google Scholar]
- Birkin, J. E., Weiss, A., Wardlow, J. L., et al. 2021, MNRAS, 501, 3926 [Google Scholar]
- Bisbas, T. G., Bell, T. A., Viti, S., Yates, J., & Barlow, M. J. 2012, MNRAS, 427, 2100 [NASA ADS] [CrossRef] [Google Scholar]
- Blain, A. W., Barnard, V. E., & Chapman, S. C. 2003, MNRAS, 338, 733 [NASA ADS] [CrossRef] [Google Scholar]
- Bolatto, A. D., Wolfire, M., & Leroy, A. K. 2013, ARA&A, 51, 207 [Google Scholar]
- Bonoli, S., Marulli, F., Springel, V., et al. 2009, MNRAS, 396, 423 [NASA ADS] [CrossRef] [Google Scholar]
- Bonoli, S., Mayer, L., & Callegari, S. 2014, MNRAS, 437, 1576 [NASA ADS] [CrossRef] [Google Scholar]
- Boogaard, L. A., van der Werf, P., Weiss, A., et al. 2020, ApJ, 902, 109 [CrossRef] [Google Scholar]
- Bothwell, M. S., Chapman, S. C., Tacconi, L., et al. 2010, MNRAS, 405, 219 [NASA ADS] [Google Scholar]
- Bothwell, M. S., Aguirre, J. E., Chapman, S. C., et al. 2013, ApJ, 779, 67 [Google Scholar]
- Bothwell, M. S., Aguirre, J. E., Aravena, M., et al. 2017, MNRAS, 466, 2825 [Google Scholar]
- Bradford, C. M., Stacey, G. J., Fischer, J., et al. 1999, in The Universe as Seen by ISO, eds. P. Cox, & M. Kessler, ESA Spec. Publ., 427, 861 [Google Scholar]
- Bradford, C. M., Bolatto, A. D., Maloney, P. R., et al. 2011, ApJ, 741, L37 [NASA ADS] [CrossRef] [Google Scholar]
- Brauher, J. R., Dale, D. A., & Helou, G. 2008, ApJS, 178, 280 [NASA ADS] [CrossRef] [Google Scholar]
- Cañameras, R., Yang, C., Nesvadba, N. P. H., et al. 2018, A&A, 620, A61 [NASA ADS] [CrossRef] [EDP Sciences] [Google Scholar]
- Carilli, C. L., & Walter, F. 2013, ARA&A, 51, 105 [Google Scholar]
- Carniani, S., Marconi, A., Maiolino, R., et al. 2017, A&A, 605, A105 [NASA ADS] [CrossRef] [EDP Sciences] [Google Scholar]
- Carniani, S., Gallerani, S., Vallini, L., et al. 2019, MNRAS, 489, 3939 [NASA ADS] [Google Scholar]
- Carral, P., Hollenbach, D. J., Lord, S. D., et al. 1994, ApJ, 423, 223 [NASA ADS] [CrossRef] [Google Scholar]
- Casey, C. M. 2012, MNRAS, 425, 3094 [Google Scholar]
- Cernicharo, J., Goicoechea, J. R., Pardo, J. R., & Asensio-Ramos, A. 2006, ApJ, 642, 940 [NASA ADS] [CrossRef] [Google Scholar]
- Chapman, S. C., Blain, A. W., Smail, I., & Ivison, R. J. 2005, ApJ, 622, 772 [Google Scholar]
- Charmandaris, V., Uchida, K. I., Weedman, D., et al. 2004, ApJS, 154, 142 [NASA ADS] [CrossRef] [Google Scholar]
- Colbert, J. W., Malkan, M. A., Clegg, P. E., et al. 1999, ApJ, 511, 721 [NASA ADS] [CrossRef] [Google Scholar]
- Combes, F., & Wiklind, T. 1997, ApJ, 486, L79 [NASA ADS] [CrossRef] [Google Scholar]
- Combes, F., Rex, M., Rawle, T. D., et al. 2012, A&A, 538, L4 [NASA ADS] [CrossRef] [EDP Sciences] [Google Scholar]
- Conley, A., Cooray, A., Vieira, J. D., et al. 2011, ApJ, 732, L35 [NASA ADS] [CrossRef] [Google Scholar]
- Connor, T., Bañados, E., Stern, D., et al. 2019, ApJ, 887, 171 [Google Scholar]
- Connor, T., Bañados, E., Mazzucchelli, C., et al. 2020, ApJ, 900, 189 [Google Scholar]
- Costa, T., Sijacki, D., Trenti, M., & Haehnelt, M. G. 2014, MNRAS, 439, 2146 [NASA ADS] [CrossRef] [Google Scholar]
- Cruddace, R., Paresce, F., Bowyer, S., & Lampton, M. 1974, ApJ, 187, 497 [NASA ADS] [CrossRef] [Google Scholar]
- da Cunha, E., Groves, B., Walter, F., et al. 2013, ApJ, 766, 13 [Google Scholar]
- Daddi, E., Bournaud, F., Walter, F., et al. 2010, ApJ, 713, 686 [Google Scholar]
- Daniel, F., Goicoechea, J. R., Cernicharo, J., Dubernet, M. L., & Faure, A. 2012, A&A, 547, A81 [NASA ADS] [CrossRef] [EDP Sciences] [Google Scholar]
- Decarli, R., Walter, F., Neri, R., et al. 2012, ApJ, 752, 2 [NASA ADS] [CrossRef] [Google Scholar]
- Decarli, R., Walter, F., Carilli, C., et al. 2014, ApJ, 782, L17 [NASA ADS] [CrossRef] [Google Scholar]
- Decarli, R., Walter, F., Venemans, B. P., et al. 2017, Nature, 545, 457 [NASA ADS] [CrossRef] [Google Scholar]
- Decarli, R., Walter, F., Venemans, B. P., et al. 2018, ApJ, 854, 97 [NASA ADS] [CrossRef] [Google Scholar]
- Decarli, R., Mignoli, M., Gilli, R., et al. 2019a, A&A, 631, L10 [CrossRef] [EDP Sciences] [Google Scholar]
- Decarli, R., Dotti, M., Bañados, E., et al. 2019b, ApJ, 880, 157 [NASA ADS] [CrossRef] [Google Scholar]
- De Rosa, G., Decarli, R., Walter, F., et al. 2011, ApJ, 739, 56 [NASA ADS] [CrossRef] [Google Scholar]
- Destombes, J. L., Marliere, C., Baudry, A., & Brillet, J. 1977, A&A, 61, 769 [Google Scholar]
- Dewangan, D. P., Flower, D. R., & Alexander, M. H. 1987, MNRAS, 226, 505 [NASA ADS] [Google Scholar]
- Díaz-Santos, T., Armus, L., Charmandaris, V., et al. 2013, ApJ, 774, 68 [NASA ADS] [CrossRef] [Google Scholar]
- Díaz-Santos, T., Armus, L., Charmandaris, V., et al. 2017, ApJ, 846, 32 [Google Scholar]
- Downes, D., & Solomon, P. M. 1998, ApJ, 507, 615 [Google Scholar]
- Downes, D., Radford, J. E., Greve, A., et al. 1992, ApJ, 398, L25 [NASA ADS] [CrossRef] [Google Scholar]
- Draine, B. T., Dale, D. A., Bendo, G., et al. 2007, ApJ, 663, 866 [Google Scholar]
- Dunne, L., Eales, S., Edmunds, M., et al. 2000, MNRAS, 315, 115 [NASA ADS] [CrossRef] [Google Scholar]
- Elbaz, D., Dickinson, M., Hwang, H. S., et al. 2011, A&A, 533, A119 [NASA ADS] [CrossRef] [EDP Sciences] [Google Scholar]
- Elitzur, M., & Asensio Ramos, A. 2006, MNRAS, 365, 779 [Google Scholar]
- Elitzur, M., & de Jong, T. 1978, A&A, 67, 323 [NASA ADS] [Google Scholar]
- Engel, H., Tacconi, L. J., Davies, R. I., et al. 2010, ApJ, 724, 233 [NASA ADS] [CrossRef] [Google Scholar]
- Faisst, A. L., Fudamoto, Y., Oesch, P. A., et al. 2020, MNRAS, 498, 4192 [CrossRef] [Google Scholar]
- Fan, X., Carilli, C. L., & Keating, B. 2006a, ARA&A, 44, 415 [NASA ADS] [CrossRef] [Google Scholar]
- Fan, X., Strauss, M. A., Becker, R. H., et al. 2006b, AJ, 132, 117 [NASA ADS] [CrossRef] [EDP Sciences] [Google Scholar]
- Farina, E. P., Venemans, B. P., Decarli, R., et al. 2017, ApJ, 848, 78 [NASA ADS] [CrossRef] [Google Scholar]
- Farina, E. P., Arrigoni-Battaia, F., Costa, T., et al. 2019, ApJ, 887, 196 [NASA ADS] [CrossRef] [Google Scholar]
- Farrah, D., Lebouteiller, V., Spoon, H. W. W., et al. 2013, ApJ, 776, 38 [Google Scholar]
- Faure, A., & Josselin, E. 2008, A&A, 492, 257 [NASA ADS] [CrossRef] [EDP Sciences] [Google Scholar]
- Faure, A., Crimier, N., Ceccarelli, C., et al. 2007, A&A, 472, 1029 [NASA ADS] [CrossRef] [EDP Sciences] [Google Scholar]
- Ferkinhoff, C., Brisbin, D., Nikola, T., et al. 2011, ApJ, 740, L29 [NASA ADS] [CrossRef] [Google Scholar]
- Ferland, G. J., Chatzikos, M., Guzmán, F., et al. 2017, Rev. Mex. Astron. Astrofis., 53, 385 [NASA ADS] [Google Scholar]
- Feruglio, C., Fiore, F., Carniani, S., et al. 2018, A&A, 619, A39 [NASA ADS] [CrossRef] [EDP Sciences] [Google Scholar]
- Fischer, J., Luhman, M. L., Satyapal, S., et al. 1999, Ap&SS, 266, 91 [NASA ADS] [CrossRef] [Google Scholar]
- Fischer, J., Sturm, E., González-Alfonso, E., et al. 2010, A&A, 518, L41 [NASA ADS] [CrossRef] [EDP Sciences] [Google Scholar]
- Fixsen, D. J., Bennett, C. L., & Mather, J. C. 1999, ApJ, 526, 207 [Google Scholar]
- Flower, D. R., & Pineau Des Forêts, G. 2010, MNRAS, 406, 1745 [NASA ADS] [Google Scholar]
- Foreman-Mackey, D., Hogg, D. W., Lang, D., & Goodman, J. 2013, PASP, 125, 306 [Google Scholar]
- Gallerani, S., Ferrara, A., Neri, R., & Maiolino, R. 2014, MNRAS, 445, 2848 [Google Scholar]
- Genzel, R., Tacconi, L. J., Lutz, D., et al. 2015, ApJ, 800, 20 [Google Scholar]
- Gerin, M., & Phillips, T. G. 2000, ApJ, 537, 644 [NASA ADS] [CrossRef] [Google Scholar]
- Glassgold, A. E., & Langer, W. D. 1974, ApJ, 193, 73 [NASA ADS] [CrossRef] [Google Scholar]
- Godard, B., Pineau des Forêts, G., Lesaffre, P., et al. 2019, A&A, 622, A100 [NASA ADS] [CrossRef] [EDP Sciences] [Google Scholar]
- Goicoechea, J. R., & Cernicharo, J. 2002, ApJ, 576, L77 [NASA ADS] [CrossRef] [Google Scholar]
- Goicoechea, J. R., Martín-Pintado, J., & Cernicharo, J. 2005, ApJ, 619, 291 [NASA ADS] [CrossRef] [Google Scholar]
- Goldsmith, P. F., & Langer, W. D. 1999, ApJ, 517, 209 [Google Scholar]
- Goldsmith, P. F., Langer, W. D., Pineda, J. L., & Velusamy, T. 2012, ApJS, 203, 13 [Google Scholar]
- González-Alfonso, E., Smith, H. A., Fischer, J., & Cernicharo, J. 2004, ApJ, 613, 247 [NASA ADS] [CrossRef] [Google Scholar]
- González-Alfonso, E., Smith, H. A., Ashby, M. L. N., et al. 2008, ApJ, 675, 303 [NASA ADS] [CrossRef] [Google Scholar]
- González-Alfonso, E., Fischer, J., Isaak, K., et al. 2010, A&A, 518, L43 [NASA ADS] [CrossRef] [EDP Sciences] [Google Scholar]
- González-Alfonso, E., Fischer, J., Graciá-Carpio, J., et al. 2012, A&A, 541, A4 [NASA ADS] [CrossRef] [EDP Sciences] [Google Scholar]
- González-Alfonso, E., Fischer, J., Bruderer, S., et al. 2013, A&A, 550, A25 [NASA ADS] [CrossRef] [EDP Sciences] [Google Scholar]
- González-Alfonso, E., Fischer, J., Aalto, S., & Falstad, N. 2014, A&A, 567, A91 [NASA ADS] [CrossRef] [EDP Sciences] [Google Scholar]
- González-Alfonso, E., Fischer, J., Spoon, H. W. W., et al. 2017, ApJ, 836, 11 [NASA ADS] [CrossRef] [Google Scholar]
- Graciá-Carpio, J., Sturm, E., Hailey-Dunsheath, S., et al. 2011, ApJ, 728, L7 [NASA ADS] [CrossRef] [Google Scholar]
- Graff, M. M., & Dalgarno, A. 1987, ApJ, 317, 432 [NASA ADS] [CrossRef] [Google Scholar]
- Habing, H. J. 1968, Bull. Astron. Inst. Neth., 19, 421 [Google Scholar]
- Habouzit, M., Volonteri, M., Somerville, R. S., et al. 2019, MNRAS, 489, 1206 [CrossRef] [Google Scholar]
- Hartquist, T. W., & Williams, D. A. 1998, The Molecular Astrophysics of Stars and Galaxies (Oxford: Oxford University Press), 4 [Google Scholar]
- Hashimoto, T., Inoue, A. K., Mawatari, K., et al. 2019a, PASJ, 71, 71 [Google Scholar]
- Hashimoto, T., Inoue, A. K., Tamura, Y., et al. 2019b, PASJ, 71, 109 [NASA ADS] [CrossRef] [Google Scholar]
- Helou, G., Khan, I. R., Malek, L., & Boehmer, L. 1988, ApJS, 68, 151 [NASA ADS] [CrossRef] [Google Scholar]
- Herrera-Camus, R., Bolatto, A., Smith, J. D., et al. 2016, ApJ, 826, 175 [Google Scholar]
- Herrera-Camus, R., Sturm, E., Graciá-Carpio, J., et al. 2018a, ApJ, 861, 94 [NASA ADS] [CrossRef] [Google Scholar]
- Herrera-Camus, R., Sturm, E., Graciá-Carpio, J., et al. 2018b, ApJ, 861, 95 [Google Scholar]
- Herrera-Camus, R., Sturm, E., Graciá-Carpio, J., et al. 2020, A&A, 633, L4 [NASA ADS] [CrossRef] [EDP Sciences] [Google Scholar]
- Hinshaw, G., Larson, D., Komatsu, E., et al. 2013, ApJS, 208, 19 [Google Scholar]
- Hollenbach, D., & McKee, C. F. 1989, ApJ, 342, 306 [NASA ADS] [CrossRef] [Google Scholar]
- Hollenbach, D. J., & Tielens, A. G. G. M. 1997, ARA&A, 35, 179 [NASA ADS] [CrossRef] [Google Scholar]
- Hollenbach, D. J., & Tielens, A. G. G. M. 1999, Rev. Mod. Phys., 71, 173 [Google Scholar]
- Hollenbach, D., Kaufman, M. J., Bergin, E. A., & Melnick, G. J. 2009, ApJ, 690, 1497 [CrossRef] [Google Scholar]
- Hunter, J. D. 2007, Comput. Sci. Eng., 9, 90 [NASA ADS] [CrossRef] [Google Scholar]
- Ikeda, M., Oka, T., Tatematsu, K., Sekimoto, Y., & Yamamoto, S. 2002, ApJS, 139, 467 [NASA ADS] [CrossRef] [Google Scholar]
- Indriolo, N., Geballe, T. R., Oka, T., & McCall, B. J. 2007, ApJ, 671, 1736 [NASA ADS] [CrossRef] [Google Scholar]
- Israel, F. P., Rosenberg, M. J. F., & van der Werf, P. 2015, A&A, 578, A95 [NASA ADS] [CrossRef] [EDP Sciences] [Google Scholar]
- Ivison, R. J., Papadopoulos, P. P., Smail, I., et al. 2011, MNRAS, 412, 1913 [Google Scholar]
- Jiang, L., Fan, X., Vestergaard, M., et al. 2007, AJ, 134, 1150 [NASA ADS] [CrossRef] [Google Scholar]
- Jiang, L., McGreer, I. D., Fan, X., et al. 2016, ApJ, 833, 222 [NASA ADS] [CrossRef] [Google Scholar]
- Jiao, Q., Zhao, Y., Zhu, M., et al. 2017, ApJ, 840, L18 [Google Scholar]
- Kaufman, M. J., Wolfire, M. G., Hollenbach, D. J., & Luhman, M. L. 1999, ApJ, 527, 795 [Google Scholar]
- Kaufman, M. J., Wolfire, M. G., & Hollenbach, D. J. 2006, ApJ, 644, 283 [Google Scholar]
- Kegel, W. H., Hertenstein, T., & Quirrenbach, A. 1999, A&A, 351, 472 [NASA ADS] [Google Scholar]
- Kirkpatrick, A., Pope, A., Sajina, A., et al. 2015, ApJ, 814, 9 [NASA ADS] [CrossRef] [Google Scholar]
- Korista, K., Baldwin, J., Ferland, G., & Verner, D. 1997, ApJS, 108, 401 [NASA ADS] [CrossRef] [Google Scholar]
- Kovács, A., Chapman, S. C., Dowell, C. D., et al. 2006, ApJ, 650, 592 [NASA ADS] [CrossRef] [Google Scholar]
- Krolik, J. H., & Begelman, M. C. 1988, ApJ, 329, 702 [Google Scholar]
- Krolik, J. H., & Kallman, T. R. 1983, ApJ, 267, 610 [NASA ADS] [CrossRef] [Google Scholar]
- Kroupa, P. 2001, MNRAS, 322, 231 [NASA ADS] [CrossRef] [Google Scholar]
- Langer, W. D. 1978, ApJ, 225, 860 [NASA ADS] [CrossRef] [Google Scholar]
- Leipski, C., Meisenheimer, K., Walter, F., et al. 2013, ApJ, 772, 103 [NASA ADS] [CrossRef] [Google Scholar]
- Leipski, C., Meisenheimer, K., Walter, F., et al. 2014, ApJ, 785, 154 [NASA ADS] [CrossRef] [Google Scholar]
- Lepp, S., & Dalgarno, A. 1996, A&A, 306, L21 [NASA ADS] [Google Scholar]
- Lepp, S., & McCray, R. 1983, ApJ, 269, 560 [NASA ADS] [CrossRef] [Google Scholar]
- Li, J., Wang, R., Cox, P., et al. 2020a, ApJ, 900, 131 [CrossRef] [Google Scholar]
- Li, J., Wang, R., Riechers, D., et al. 2020b, ApJ, 889, 162 [CrossRef] [Google Scholar]
- Liang, L., Feldmann, R., Kereš, D., et al. 2019, MNRAS, 489, 1397 [NASA ADS] [CrossRef] [Google Scholar]
- Lis, D. C., Neufeld, D. A., Phillips, T. G., Gerin, M., & Neri, R. 2011, ApJ, 738, L6 [NASA ADS] [CrossRef] [Google Scholar]
- Liu, L., Weiß, A., Perez-Beaupuits, J. P., et al. 2017, ApJ, 846, 5 [NASA ADS] [CrossRef] [Google Scholar]
- Lord, S. D., Hollenbach, D. J., Haas, M. R., et al. 1996, ApJ, 465, 703 [NASA ADS] [CrossRef] [Google Scholar]
- Luhman, M. L., Satyapal, S., Fischer, J., et al. 2003, ApJ, 594, 758 [Google Scholar]
- Lupu, R. E., Scott, K. S., Aguirre, J. E., et al. 2012, ApJ, 757, 135 [NASA ADS] [CrossRef] [Google Scholar]
- Ma, X., Hayward, C. C., Casey, C. M., et al. 2019, MNRAS, 487, 1844 [NASA ADS] [CrossRef] [Google Scholar]
- Maiolino, R., Cox, P., Caselli, P., et al. 2005, A&A, 440, L51 [NASA ADS] [CrossRef] [EDP Sciences] [Google Scholar]
- Maiolino, R., Caselli, P., Nagao, T., et al. 2009, A&A, 500, L1 [NASA ADS] [CrossRef] [EDP Sciences] [Google Scholar]
- Maiolino, R., Carniani, S., Fontana, A., et al. 2015, MNRAS, 452, 54 [NASA ADS] [CrossRef] [Google Scholar]
- Malhotra, S., Helou, G., Stacey, G., et al. 1997, ApJ, 491, L27 [NASA ADS] [CrossRef] [Google Scholar]
- Maloney, P. R., Hollenbach, D. J., & Tielens, A. G. G. M. 1996, ApJ, 466, 561 [Google Scholar]
- Mashian, N., Sturm, E., Sternberg, A., et al. 2015, ApJ, 802, 81 [Google Scholar]
- Mathis, J. S. 1997, in Composition and Size of Interstellar Dust, ed. Y. J. Pendleton, ASP Conf. Ser., 122, 87 [Google Scholar]
- Matsuoka, Y., Strauss, M. A., Kashikawa, N., et al. 2018, ApJ, 869, 150 [NASA ADS] [CrossRef] [Google Scholar]
- Mazzucchelli, C., Bañados, E., Venemans, B. P., et al. 2017a, ApJ, 849, 91 [NASA ADS] [CrossRef] [Google Scholar]
- Mazzucchelli, C., Bañados, E., Decarli, R., et al. 2017b, ApJ, 834, 83 [NASA ADS] [CrossRef] [Google Scholar]
- Mazzucchelli, C., Decarli, R., Farina, E. P., et al. 2019, ApJ, 881, 163 [Google Scholar]
- McKee, C. F., & Ostriker, J. P. 1977, ApJ, 218, 148 [NASA ADS] [CrossRef] [Google Scholar]
- McMullin, J. P., Waters, B., Schiebel, D., Young, W., & Golap, K. 2007, ASP Conf. Ser., 376, 127 [Google Scholar]
- Meijerink, R., & Spaans, M. 2005, A&A, 436, 397 [NASA ADS] [CrossRef] [EDP Sciences] [Google Scholar]
- Meijerink, R., Spaans, M., & Israel, F. P. 2007, A&A, 461, 793 [NASA ADS] [CrossRef] [EDP Sciences] [Google Scholar]
- Meijerink, R., Spaans, M., Loenen, A. F., & van der Werf, P. P. 2011, A&A, 525, A119 [NASA ADS] [CrossRef] [EDP Sciences] [Google Scholar]
- Meijerink, R., Kristensen, L. E., Weiß, A., et al. 2013, ApJ, 762, L16 [NASA ADS] [CrossRef] [Google Scholar]
- Meixner, M., & Tielens, A. G. G. M. 1993, ApJ, 405, 216 [NASA ADS] [CrossRef] [Google Scholar]
- Menten, K. M., Lundgren, A., Belloche, A., Thorwirth, S., & Reid, M. J. 2008, A&A, 477, 185 [NASA ADS] [CrossRef] [EDP Sciences] [Google Scholar]
- Mingozzi, M., Vallini, L., Pozzi, F., et al. 2018, MNRAS, 474, 3640 [NASA ADS] [CrossRef] [Google Scholar]
- Morselli, L., Mignoli, M., Gilli, R., et al. 2014, A&A, 568, A1 [NASA ADS] [CrossRef] [EDP Sciences] [Google Scholar]
- Murphy, E. J., Condon, J. J., Schinnerer, E., et al. 2011, ApJ, 737, 67 [NASA ADS] [CrossRef] [Google Scholar]
- Narayanan, D., & Krumholz, M. R. 2014, MNRAS, 442, 1411 [NASA ADS] [CrossRef] [Google Scholar]
- Neeleman, M., Bañados, E., Walter, F., et al. 2019, ApJ, 882, 10 [NASA ADS] [CrossRef] [Google Scholar]
- Neufeld, D. A., & Kaufman, M. J. 1993, ApJ, 418, 263 [NASA ADS] [CrossRef] [Google Scholar]
- Neufeld, D. A., Lepp, S., & Melnick, G. J. 1995, ApJS, 100, 132 [NASA ADS] [CrossRef] [Google Scholar]
- Neufeld, D. A., Kaufman, M. J., Goldsmith, P. F., Hollenbach, D. J., & Plume, R. 2002, ApJ, 580, 278 [Google Scholar]
- Noeske, K. G., Weiner, B. J., Faber, S. M., et al. 2007, ApJ, 660, L43 [Google Scholar]
- Novak, M., Bañados, E., Decarli, R., et al. 2019, ApJ, 881, 63 [NASA ADS] [CrossRef] [Google Scholar]
- Oberst, T. E., Parshley, S. C., Stacey, G. J., et al. 2006, ApJ, 652, L125 [NASA ADS] [CrossRef] [MathSciNet] [Google Scholar]
- Obreschkow, D., Heywood, I., Klöckner, H. R., & Rawlings, S. 2009, ApJ, 702, 1321 [CrossRef] [Google Scholar]
- Omont, A., Neri, R., Cox, P., et al. 2011, A&A, 530, L3 [NASA ADS] [CrossRef] [EDP Sciences] [Google Scholar]
- Omont, A., Yang, C., Cox, P., et al. 2013, A&A, 551, A115 [NASA ADS] [CrossRef] [EDP Sciences] [Google Scholar]
- Onoue, M., Bañados, E., Mazzucchelli, C., et al. 2020, ApJ, 898, 105 [Google Scholar]
- Overzier, R. A., Guo, Q., Kauffmann, G., et al. 2009, MNRAS, 394, 577 [NASA ADS] [CrossRef] [Google Scholar]
- Papadopoulos, P. P., Thi, W. F., & Viti, S. 2004, MNRAS, 351, 147 [NASA ADS] [CrossRef] [Google Scholar]
- Pavesi, R., Riechers, D. A., Capak, P. L., et al. 2016, ApJ, 832, 151 [NASA ADS] [CrossRef] [Google Scholar]
- Pentericci, L., Fan, X., Rix, H.-W., et al. 2002, AJ, 123, 2151 [NASA ADS] [CrossRef] [Google Scholar]
- Pereira-Santaella, M., Spinoglio, L., Busquet, G., et al. 2013, ApJ, 768, 55 [NASA ADS] [CrossRef] [Google Scholar]
- Poelman, D. R., & Spaans, M. 2005, A&A, 440, 559 [NASA ADS] [CrossRef] [EDP Sciences] [Google Scholar]
- Pound, M. W., & Wolfire, M. G. 2008, in The Photo Dissociation Region Toolbox, eds. R. W. Argyle, P. S. Bunclark, & J. R. Lewis, ASP Conf. Ser., 394, 654 [Google Scholar]
- Priddey, R. S., & McMahon, R. G. 2001, MNRAS, 324, L17 [NASA ADS] [CrossRef] [Google Scholar]
- Rangwala, N., Maloney, P. R., Glenn, J., et al. 2011, ApJ, 743, 94 [NASA ADS] [CrossRef] [Google Scholar]
- Riechers, D. A., Walter, F., Bertoldi, F., et al. 2009, ApJ, 703, 1338 [NASA ADS] [CrossRef] [Google Scholar]
- Riechers, D. A., Carilli, L. C., Walter, F., et al. 2011, ApJ, 733, L11 [Google Scholar]
- Riechers, D. A., Bradford, C. M., Clements, D. L., et al. 2013, Nature, 496, 329 [Google Scholar]
- Riechers, D. A., Carilli, C. L., Capak, P. L., et al. 2014, ApJ, 796, 84 [NASA ADS] [CrossRef] [Google Scholar]
- Riechers, D. A., Hodge, J. A., Pavesi, R., et al. 2020, ApJ, 895, 81 [Google Scholar]
- Rosenberg, M. J. F., van der Werf, P. P., Aalto, S., et al. 2015, ApJ, 801, 72 [NASA ADS] [CrossRef] [Google Scholar]
- Rowan-Robinson, M. 1995, MNRAS, 272, 737 [NASA ADS] [Google Scholar]
- Rybak, M., Calistro Rivera, G., Hodge, J. A., et al. 2019, ApJ, 876, 112 [NASA ADS] [CrossRef] [Google Scholar]
- Saintonge, A., Catinella, B., Tacconi, L. J., et al. 2017, ApJS, 233, 22 [Google Scholar]
- Saintonge, A., Wilson, C. D., Xiao, T., et al. 2018, MNRAS, 481, 3497 [NASA ADS] [CrossRef] [Google Scholar]
- Sanders, D. B., Mazzarella, J. M., Kim, D. C., Surace, J. A., & Soifer, B. T. 2003, AJ, 126, 1607 [Google Scholar]
- Sandstrom, K. M., Leroy, A. K., Walter, F., et al. 2013, ApJ, 777, 5 [NASA ADS] [CrossRef] [Google Scholar]
- Savage, B. D., & Sembach, K. R. 1996, ARA&A, 34, 279 [NASA ADS] [CrossRef] [Google Scholar]
- Schleicher, D. R. G., Spaans, M., & Klessen, R. S. 2010, A&A, 513, A7 [NASA ADS] [CrossRef] [EDP Sciences] [Google Scholar]
- Schreiber, C., Elbaz, D., Pannella, M., et al. 2018, A&A, 609, A30 [NASA ADS] [CrossRef] [EDP Sciences] [Google Scholar]
- Shao, Y., Wang, R., Carilli, C. L., et al. 2019, ApJ, 876, 99 [CrossRef] [Google Scholar]
- Sijacki, D., Vogelsberger, M., Genel, S., et al. 2015, MNRAS, 452, 575 [NASA ADS] [CrossRef] [Google Scholar]
- Smith, H., Gonzalez-Alfonso, E., Fischer, J., et al. 2004, in The Neutral ISM in Starburst Galaxies, eds. S. Aalto, S. Huttemeister, & A. Pedlar, ASP Conf. Ser., 320, 49 [Google Scholar]
- Solomon, P. M., Radford, S. J. E., & Downes, D. 1992, Nature, 356, 318 [NASA ADS] [CrossRef] [Google Scholar]
- Spaans, M. 1996, A&A, 307, 271 [NASA ADS] [Google Scholar]
- Spinoglio, L., Malkan, M. A., Smith, H. A., González-Alfonso, E., & Fischer, J. 2005, ApJ, 623, 123 [NASA ADS] [CrossRef] [Google Scholar]
- Spinoglio, L., Pereira-Santaella, M., Busquet, G., et al. 2012, ApJ, 758, 108 [NASA ADS] [CrossRef] [Google Scholar]
- Spoon, H. W. W., Farrah, D., Lebouteiller, V., et al. 2013, ApJ, 775, 127 [Google Scholar]
- Stefan, I. I., Carilli, C. L., Wagg, J., et al. 2015, MNRAS, 451, 1713 [NASA ADS] [CrossRef] [Google Scholar]
- Strandet, M. L., Weiss, A., De Breuck, C., et al. 2017, ApJ, 842, L15 [Google Scholar]
- Sturm, E., González-Alfonso, E., Veilleux, S., et al. 2011, ApJ, 733, L16 [Google Scholar]
- Tacconi, L. J., Genzel, R., Smail, I., et al. 2008, ApJ, 680, 246 [Google Scholar]
- Tacconi, L. J., Genzel, R., Saintonge, A., et al. 2018, ApJ, 853, 179 [NASA ADS] [CrossRef] [Google Scholar]
- Tacconi, L. J., Genzel, R., & Sternberg, A. 2020, ARA&A, 58, 157 [CrossRef] [Google Scholar]
- Tielens, A. G. G. M., & Hollenbach, D. 1985a, ApJ, 291, 722 [Google Scholar]
- Tielens, A. G. G. M., & Hollenbach, D. 1985b, ApJ, 291, 747 [NASA ADS] [CrossRef] [Google Scholar]
- Tomassetti, M., Porciani, C., Romano-Diaz, E., Ludlow, A. D., & Papadopoulos, P. P. 2014, MNRAS, 445, L124 [NASA ADS] [CrossRef] [Google Scholar]
- Trakhtenbrot, B., Lira, P., Netzer, H., et al. 2017, ApJ, 836, 8 [NASA ADS] [CrossRef] [Google Scholar]
- Valentino, F., Magdis, G. E., Daddi, E., et al. 2018, ApJ, 869, 27 [Google Scholar]
- Valentino, F., Magdis, G. E., Daddi, E., et al. 2020, ApJ, 890, 24 [Google Scholar]
- Vallini, L., Pallottini, A., Ferrara, A., et al. 2018, MNRAS, 473, 271 [NASA ADS] [CrossRef] [Google Scholar]
- Vallini, L., Tielens, A. G. G. M., Pallottini, A., et al. 2019, MNRAS, 490, 4502 [NASA ADS] [CrossRef] [Google Scholar]
- van der Tak, F. F. S., Black, J. H., Schöier, F. L., Jansen, D. J., & van Dishoeck, E. F. 2007, A&A, 468, 627 [NASA ADS] [CrossRef] [EDP Sciences] [Google Scholar]
- van der Vlugt, D., & Costa, T. 2019, MNRAS, 490, 4918 [CrossRef] [Google Scholar]
- van der Werf, P. P., Isaak, K. G., Meijerink, R., et al. 2010, A&A, 518, L42 [NASA ADS] [CrossRef] [EDP Sciences] [Google Scholar]
- van der Werf, P. P., Berciano Alba, A., Spaans, M., et al. 2011, ApJ, 741, L38 [NASA ADS] [CrossRef] [Google Scholar]
- Veilleux, S., Meléndez, M., Sturm, E., et al. 2013, ApJ, 776, 27 [NASA ADS] [CrossRef] [Google Scholar]
- Venemans, B. P., Walter, F., Decarli, R., et al. 2017a, ApJ, 851, L8 [NASA ADS] [CrossRef] [Google Scholar]
- Venemans, B. P., Walter, F., Decarli, R., et al. 2017b, ApJ, 837, 146 [NASA ADS] [CrossRef] [Google Scholar]
- Venemans, B. P., Walter, F., Decarli, R., et al. 2017c, ApJ, 845, 154 [Google Scholar]
- Venemans, B. P., Decarli, R., Walter, F., et al. 2018, ApJ, 866, 159 [NASA ADS] [CrossRef] [Google Scholar]
- Venemans, B. P., Neeleman, M., Walter, F., et al. 2019, ApJ, 874, L30 [NASA ADS] [CrossRef] [Google Scholar]
- Vito, F., Brandt, W. N., Bauer, F. E., et al. 2019, A&A, 628, L6 [NASA ADS] [CrossRef] [EDP Sciences] [Google Scholar]
- Volonteri, M. 2012, Science, 337, 544 [NASA ADS] [CrossRef] [Google Scholar]
- Wagner, A. F., & Graff, M. M. 1987, ApJ, 317, 423 [NASA ADS] [CrossRef] [Google Scholar]
- Walter, F., Bertoldi, F., Carilli, C., et al. 2003, Nature, 424, 406 [Google Scholar]
- Walter, F., Carilli, C., Bertoldi, F., et al. 2004, ApJ, 615, L17 [CrossRef] [Google Scholar]
- Walter, F., Riechers, D., Cox, P., et al. 2009, Nature, 457, 699 [NASA ADS] [CrossRef] [PubMed] [Google Scholar]
- Walter, F., Weiß, A., Downes, D., Decarli, R., & Henkel, C. 2011, ApJ, 730, 18 [Google Scholar]
- Walter, F., Riechers, D., Novak, M., et al. 2018, ApJ, 869, L22 [NASA ADS] [CrossRef] [Google Scholar]
- Wang, R., Wagg, J., Carilli, C. L., et al. 2008, AJ, 135, 1201 [NASA ADS] [CrossRef] [Google Scholar]
- Wang, R., Carilli, C. L., Neri, R., et al. 2010, ApJ, 714, 699 [Google Scholar]
- Wang, R., Wagg, J., Carilli, C. L., et al. 2013, ApJ, 773, 44 [Google Scholar]
- Wang, R., Wu, X.-B., Neri, R., et al. 2016, ApJ, 830, 53 [Google Scholar]
- Wang, F., Wang, R., Fan, X., et al. 2019, ApJ, 880, 2 [CrossRef] [Google Scholar]
- Wang, F., Yang, J., Fan, X., et al. 2021, ApJ, 907, L1 [Google Scholar]
- Weiß, A., Henkel, C., Downes, D., & Walter, F. 2003, A&A, 409, L41 [NASA ADS] [CrossRef] [EDP Sciences] [Google Scholar]
- Weiß, A., Downes, D., Henkel, C., & Walter, F. 2005, A&A, 429, L25 [NASA ADS] [CrossRef] [EDP Sciences] [Google Scholar]
- Weiß, A., Requena-Torres, M. A., Güsten, R., et al. 2010, A&A, 521, L1 [NASA ADS] [CrossRef] [EDP Sciences] [Google Scholar]
- Willott, C. J., Bergeron, J., & Omont, A. 2015a, ApJ, 801, 123 [NASA ADS] [CrossRef] [Google Scholar]
- Willott, C. J., Carilli, C. L., Wagg, J., & Wang, R. 2015b, ApJ, 807, 180 [NASA ADS] [CrossRef] [Google Scholar]
- Willott, C. J., Bergeron, J., & Omont, A. 2017, ApJ, 850, 108 [NASA ADS] [CrossRef] [Google Scholar]
- Yang, C., Gao, Y., Omont, A., et al. 2013, ApJ, 771, L24 [NASA ADS] [CrossRef] [Google Scholar]
- Yang, C., Omont, A., Beelen, A., et al. 2016, A&A, 595, A80 [NASA ADS] [CrossRef] [EDP Sciences] [Google Scholar]
- Yang, C., Omont, A., Beelen, A., et al. 2017, A&A, 608, A144 [NASA ADS] [CrossRef] [EDP Sciences] [Google Scholar]
- Yang, J., Venemans, B., Wang, F., et al. 2019a, ApJ, 880, 153 [CrossRef] [Google Scholar]
- Yang, C., Gavazzi, R., Beelen, A., et al. 2019b, A&A, 624, A138 [NASA ADS] [CrossRef] [EDP Sciences] [Google Scholar]
- Yang, J., Wang, F., Fan, X., et al. 2020a, ApJ, 897, L14 [Google Scholar]
- Yang, C., González-Alfonso, E., Omont, A., et al. 2020b, A&A, 634, L3 [CrossRef] [EDP Sciences] [Google Scholar]
- Zhao, Y., Lu, N., Xu, C. K., et al. 2013, ApJ, 765, L13 [NASA ADS] [CrossRef] [Google Scholar]
- Zhao, Y., Lu, N., Xu, C. K., et al. 2016, ApJ, 819, 69 [NASA ADS] [CrossRef] [Google Scholar]
All Tables
Information about targeted objects and characteristics of ALMA observations for each frequency setup.
Measurements and derived quantities from the ALMA spectra of the QSOs and their companion galaxies.
All Figures
|
Fig. 1. Detections and nondetections in system PJ231−20. We show the observed integrated spectra for the quasar and its companion galaxy in a frequency range around the targeted transition. In the panels showing the spectra, we show the best-fit model (red line), the fit residuals (at the bottom of each panel), the expected frequency of the line (vertical dashed black line) and the channels used to obtain the continuum-subtracted line velocity-integrated maps (over 360 km s−1) that are shown to the right of each spectrum (red shaded area). When the line is not detected, the best-fit model is a constant polynomial fitting the continuum emission alone. In the spectra covering the CO(16−15) line, we performed the fit after subtracting the best-fit model for the OH doublet (bottom panels). The spectra we show were extracted at the position of the quasar and companion galaxy. The positions of the sources are indicated in the line velocity-integrated maps with cyan and white crosses, respectively. The solid contours in the maps show the [2, 3, 4, 5, 6, 7, 8] × σ levels, and dashed contours indicate the −2σ level. |
| In the text | |
|
Fig. 2. Detections and nondetections in system PJ308−21. See Fig. 1 for a description of the various panels. |
| In the text | |
|
Fig. 3. Continuum maps in the four frequency setups of PJ231−20 (upper panels), and the two setups of system PJ308−21 (lower panels). The central frequencies of each setup are reported at the top of each panel. The white ellipses indicate the ALMA FWHM synthesized beam. The positions of the quasars and the companions from which we extracted the spectra from line cubes are marked by cyan and white crosses, respectively. The solid contours indicate [2, 4, 8, 16, 32, 64] × σ, and dashed contours are the −2σ value. |
| In the text | |
|
Fig. 4. Models of the dust SEDs of sources PJ231−20 (left panels) and PJ308−21 (right panels). Upper panels: circles and diamonds indicate continuum data obtained in this work and those obtained from the ALMA Cycle 6 [CII]158 μm observations (Decarli et al. 2017), respectively. Downward arrows indicate 3σ upper limits. The best-fit modified blackbody model is indicated with a solid red line for the quasars, and the blue and cyan lines show the models for companion galaxies assuming Tdust = 47 K and 35 K, respectively. The shadowed areas show the 1σ confidence intervals. Green bands indicate the ALMA frequency bands redshifted to the quasar-companion pair rest frame (zpair = [zQSO + zcomp]/2). Lower panels: posterior probability distributions of the free parameters (red for quasars, blue and cyan for companions). The vertical lines indicate the best-fit values computed as 50th percentiles of the distributions. The best-fit values with their uncertainties are also reported. |
| In the text | |
|
Fig. 5. Fraction of [CII]158 μm arising from the PDR as a function of dust temperature, color-coded by the logarithm of the total IR luminosity. The QSO PJ231−20 and its companion galaxy are marked by stars. For the companion we report the cases with an assumed dust temperature of 47 K and 35 K. These points are connected by a dashed line. The diamond marks the 3σ upper limit on quasar ULAS J1342+0928 at z = 7.54 (Novak et al. 2019), while the square is the upper limit on SDSS J2310+1855 at z = 6.00 (Li et al. 2020a,b). The latter limits are computed using the [NII]122 μm/[NII]205 μm line luminosity ratio to estimate the electron density and then the fraction of [CII]158 μm from the ionized gas from Oberst et al. (2006). Tdust and LTIR for SDSS J2310+1855 are derived via a dust SED fitting by Shao et al. (2019), and for ULAS J1342+0928, LTIR is estimated in Novak et al. (2019) by assuming Tdust = 47 K (here slightly shifted for better visualization). Circles represent the LIRG sample presented in Díaz-Santos et al. (2017). The solid black line shows the best-fit model |
| In the text | |
|
Fig. 6. [NII]205 μm and [CII]158 μm line deficits (top and bottom panel, respectively) with respect to the total IR luminosity (LTIR(8 − 1000 μm)) for quasars PJ231−20 and PJ308−21 and the companion galaxies and the LIRG sample of Díaz-Santos et al. (2017) as a function of dust temperature and color-coded by log LTIR. We also report the measurements obtained for the z = 7.54 quasar ULAS J1342+0928 (Novak et al. 2019). The sources in system PJ231−20 are indicated by stars, and those in system PJ308−21 are marked with crosses. For the companion galaxies we report the cases with assumed dust temperatures of 47 K and 35 K. These points are connected by a dashed line. The solid lines are the best fit to the LIRG sample performed in Díaz-Santos et al. (2017) using the model Lline/LFIR = ϵ0exp[( − S63/S158)/δ] with (ϵ0, δ) = ((1.26 ± 0.16) × 10−3, 0.50 ± 0.04) for the [NII]205 μm line, and (ϵ0, δ) = ((14.0 ± 0.9) × 10−3, 0.68 ± 0.04) for [CII]158 μm line. We scaled the best fits by a constant factor because different FIR luminosity definitions were employed by Díaz-Santos et al. (2017). The best-fit scaling values are 0.56 for [NII]205 μm line and 0.44 for [CII]158 μm line. The gray shaded area represents the 1σ scatter of the relation. The Novak et al. (2019) points were slightly shifted along the dust temperature axis (assumed to be 47 K) for a better visualization of the data. |
| In the text | |
|
Fig. 7. Comparison of L[CI]369 μm/LTIR and dust temperature (Tdust) observed in systems PJ231−20 and PJ308−21 with various local and high-z galaxies. Data points are color-coded by log LTIR. The reported sample is taken from Valentino et al. (2020) (and references therein) and comprises local star-forming (SF) galaxies (circles) and AGN (diamonds); main-sequence (MS) galaxies (upright triangles) and starburst galaxies (upside-down triangles) at z ∼ 1; and z ∼ 2 − 4 SMGs (pentagons) and QSOs (squares). The QSO PJ231−20 and its companion are indicated with stars, and the PJ308−21 sources are marked with crosses. For the companions we report the cases with an assumed dust temperature of 47 K and 35 K. These points are connected by a dashed line. The upper limit in our sources corresponds to 3σ. We also report measurements in quasar ULAS J1342+0928 at z = 7.54 (see Novak et al. 2019) and quasar J0439+1634 at z ≃ 6.5 (Yang et al. 2019a). |
| In the text | |
|
Fig. 8. Grids of the [CII]158 μm/[CI]369 μm intensity line ratio as a function of the strength of the radiation field (G0 or FX) and total hydrogen density (nH) in the PDR (left panel) and XDR case (right panel). The adopted total hydrogen column density is NH = 1023 cm−2. Model values are indicated by gray contours (linear scale), and constraints on the observed line ratios are superimposed. The dashed gold area indicates the [CII]158 μm-to-[CI]369 μm luminosity ratio measured in QSO PJ231−20 within its uncertainties, and 3σ lower limits on the other sources are reported (see the legend in the bottom left corner of the left panel). The [CII]158 μm-to-[CI]369 μm ratios in QSO PJ231−20 and its companion are scaled according to the estimated fraction of [CII]158 μm arising from PDRs. The XDR case does not reproduce the observed ratios in any source, except for a small range of values corresponding to the lower limit measured in QSO PJ308−21. We also report the [CI]369 μm-to-TIR and [CII]158 μm-to-TIR luminosity ratio estimates in QSO PJ231−20 as filled gold and light brown areas, respectively. This provides additional constraints on the radiation field flux. |
| In the text | |
|
Fig. 9. Average CO(1−0)-normalized SLEDs (in L⊙). Colored circles and diamonds are measurements obtained in this work for systems PJ231−20 and PJ308−21. For the companion galaxies we show the two SLEDs obtained assuming Tdust = 47 K (filled half-top symbols) and 35 K (filled half-bottom symbols). Empty symbols refer to the CO ladders of other high-z quasars and one SMG (HFLS 3) from the literature (see Riechers et al. 2013; Venemans et al. 2017c; Carniani et al. 2019; Yang et al. 2019a; Li et al. 2020b, and references therein). Average CO SLEDs of local AGN and starburst galaxies from the literature (Mashian et al. 2015; Rosenberg et al. 2015) are reported by the dashed orange and dotted blue lines, respectively. Shaded areas are the confidence limits (computed as the 16th and 85th percentile of the distribution, respectively). Violet squares are the Milky Way Galactic center CO-normalized ladders from Fixsen et al. (1999). Average CO SLEDs of starburst galaxies at z ∼ 1 − 1.6 and z ∼ 2 − 2.6 from ASPECS are shown as green and red lines, respectively. The dashed gray line is the expected thermalized CO SLED in the Rayleigh-Jeans limit. |
| In the text | |
|
Fig. 10. CLOUDY CO(1−0)-normalized SLED models in the PDR (left panels) and XDR regime (right panels) for which the intensity of the incident radiation field was varied over the entire parameter space and for two reference values of total hydrogen density (nH = 102.9, 105.1 cm−3) and column density NH = 1023 cm−2. PDR cases are shown in blue, and XDRs are in red. Both are color-coded according to the values of the radiation field flux. The dashed gray line indicates the J3 curve, which is the expected trend of the CO SLED in LTE (in the optically thick and high-temperature or low-frequency limit). |
| In the text | |
|
Fig. 11. CO(1−0)-normalized SLED fits of QSO PJ231−20. Gold circles indicate the CO luminosity ratios measured in the quasar. The dot-dashed black line is the best-fit model using a single XDR model. The composite (PDR+XDR) model described in the text is represented with the solid black line. The dashed blue and red lines show the PDR and XDR component, respectively. The shadowed area indicates the 1σ uncertainties on the normalization values. Best-fit parameters are reported in the legends at the bottom of the figure. The dashed gray line is the theoretical trend (∝J3) of the CO SLED in the LTE, optically thick, and high-temperature (or low frequency) limit. The red and blue diamonds (slightly shifted horizontally for clarity) are the CO(1−0)-normalized SLED in the PJ231−20 companion galaxy and QSO PJ308−21, respectively. For the PJ231−20 companion we report the CO SLEDs obtained assuming Tdust = 47 K (half-top filled magenta diamonds) and 35 K (half-bottom filled magenta diamonds, see Sect. 8.2). |
| In the text | |
|
Fig. 12. Part of the H2O energy level diagram. Para- and ortho-H2O ladders are shown together with the detected H2O line transitions (blue arrows). The magenta arrow indicates the IR radiative-pumped transition at 75 μm that populates the 321 level (see González-Alfonso et al. 2014; Liu et al. 2017). |
| In the text | |
|
Fig. 13. Upper panel: LH2O(321 − 312) − LTIR relation. The solid black line shows the best power-law fit from Yang et al. (2013) considering the low-z HII+mild and strong AGN sample (blue and red squares, respectively). The gray area is the 1σ confidence limit. The gold and magenta squares indicate the quasar host PJ231−20 and its companion, respectively. In the case of the companion, we report the cases assuming Tdust = 47 K (left half-filled magenta square) and 35 K (right half-filled magenta square). These points are connected by a dotted black line. Purple squares are the mid-z Hy/ULIRGs of Yang et al. (2016). We also report measurements of APM 08279+5255 (van der Werf et al. 2011), the z ∼ 6.3 SMG HFLS 3 (Riechers et al. 2013), and the z ∼ 6.5 J0439+1634 quasar (Yang et al. 2019a). Empty squares indicate measurements that were not corrected for gravitational lensing. Lower panel: LH2O/LTIR vs. total IR luminosity. Symbols are the same as in the upper panel. Together with LH2O/LTIR for the 321 − 312 transition, we also report those for 312 − 221 and 303 − 212 for QSO PJ231−20, the companion galaxy, QSO PJ308−21, and the quasar J0439+1634, as indicated in the legend. |
| In the text | |
|
Fig. 14. H2O(321 − 312)-normalized H2O intensities (in Jy km s−1) as a function of the excitation temperature of the upper level. Gold circles are the H2O ratios measured in the PJ231−20 QSO. The solid black line reports the average H2O SLED of the whole sample of Yang et al. (2013). The gray shadowed area represents the 1σ uncertainty. The dashed red and blue lines indicate the average values of strong-AGN- and HII+mild-AGN-dominated galaxies, respectively, as classified by Yang et al. (2013). We also report data retrieved from the literature for the two nearby sources Arp 220 (Rangwala et al. 2011) and the AGN-dominated Mrk 231 (González-Alfonso et al. 2010). For comparison, we also show the H2O flux ratios observed in high-z sources such as APM 08279+5255 (van der Werf et al. 2011), the lensed z > 6 quasar J0439+1634 (Yang et al. 2019a), and the SMG HFLS3 (Riechers et al. 2013). The energy of the upper levels of the 220 − 211 and 312 − 303 transitions were shifted for clarity to −20 and +20 K, respectively. |
| In the text | |
|
Fig. 15. CLOUDY H2O(321 − 312)-normalized SLED models in the PDR (left panels) and XDR regime (right panels), for which we varied the intensity of the incident radiation field over the entire parameter space and for two reference values of total hydrogen density (nH = 102.3, 104.6 cm−3), and column density NH = 1024 cm−2. PDR cases are shown in blue and XDRs are red. They are color-coded according to the values of the radiation field flux. The energy of the upper levels of the 220 − 211 and 312 − 303 transitions were shifted for clarity to −20 and +20 K, respectively. In order to exclude unphysical models, we report H2O SLEDs in which the H2O 312 − 221 intensity is > 10−2× that of the corresponding CO(10−9) line. |
| In the text | |
|
Fig. 16. Best-fit models of the H2O(321 − 312)-normalized SLED in QSO PJ231−20. Gold squares are the observed line ratios, and light and dark blue circles are the PDR best-fit models with NH = 1023 and 1024 cm−2, respectively. The best-fit parameters are indicated in the upper part of the panel. |
| In the text | |
|
Fig. 17. CLOUDY models of H2O/OH163 μm luminosity ratios. Model predictions are reported for QSO PJ231−20 (solid and dotted lines indicate values and their uncertainties) and 3σ upper limits for its companion (dashed lines). The dashed gold area reports the constraints retrieved from QSO PJ308−21 detections. The clouds’ column density of the models is NH = 1024 cm−2. |
| In the text | |
Current usage metrics show cumulative count of Article Views (full-text article views including HTML views, PDF and ePub downloads, according to the available data) and Abstracts Views on Vision4Press platform.
Data correspond to usage on the plateform after 2015. The current usage metrics is available 48-96 hours after online publication and is updated daily on week days.
Initial download of the metrics may take a while.