Fig. 10.
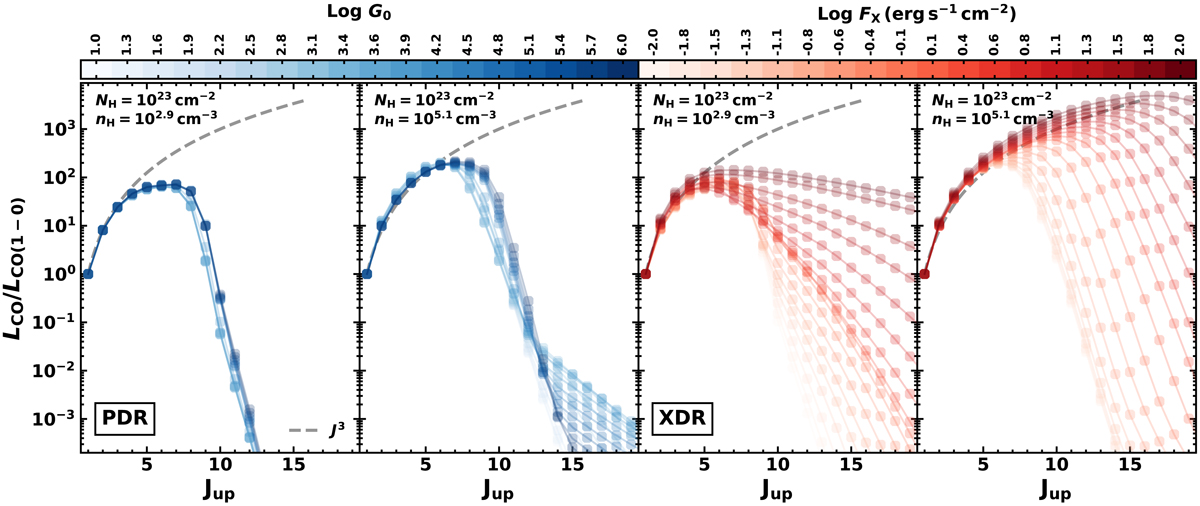
CLOUDY CO(1−0)-normalized SLED models in the PDR (left panels) and XDR regime (right panels) for which the intensity of the incident radiation field was varied over the entire parameter space and for two reference values of total hydrogen density (nH = 102.9, 105.1 cm−3) and column density NH = 1023 cm−2. PDR cases are shown in blue, and XDRs are in red. Both are color-coded according to the values of the radiation field flux. The dashed gray line indicates the J3 curve, which is the expected trend of the CO SLED in LTE (in the optically thick and high-temperature or low-frequency limit).
Current usage metrics show cumulative count of Article Views (full-text article views including HTML views, PDF and ePub downloads, according to the available data) and Abstracts Views on Vision4Press platform.
Data correspond to usage on the plateform after 2015. The current usage metrics is available 48-96 hours after online publication and is updated daily on week days.
Initial download of the metrics may take a while.