Fig. 5.
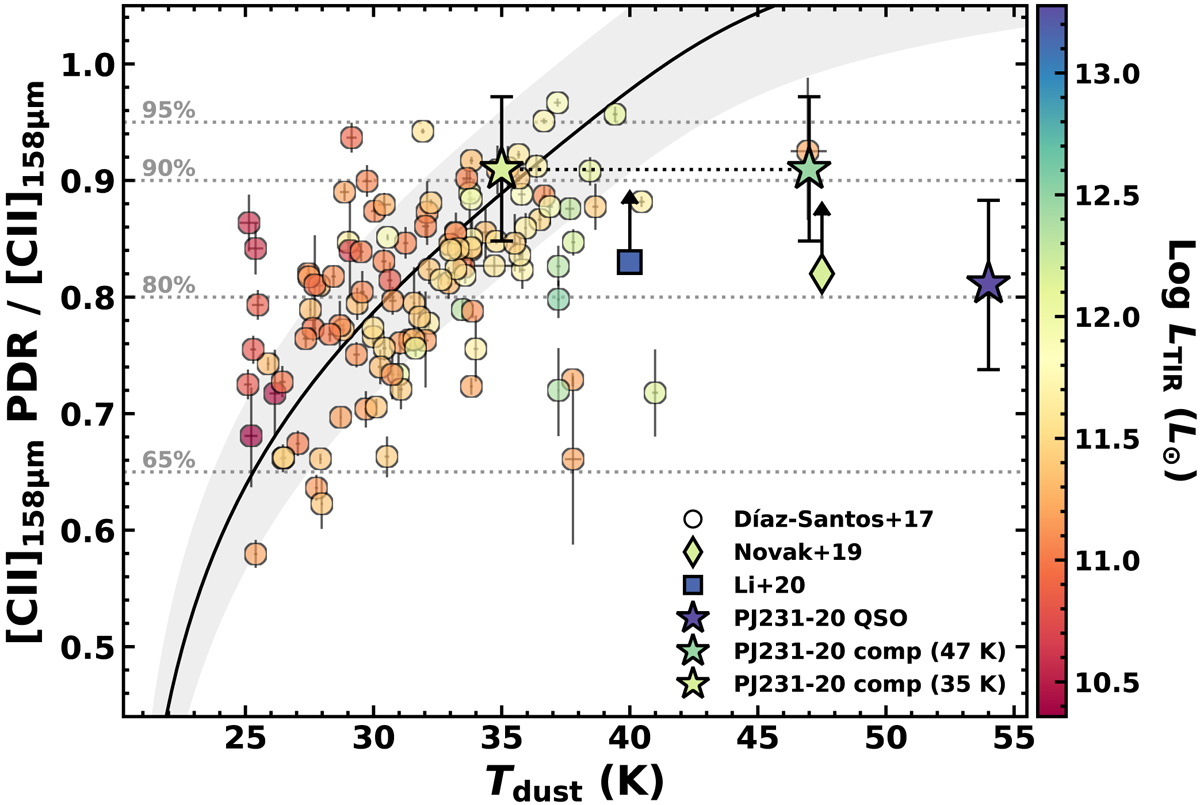
Fraction of [CII]158 μm arising from the PDR as a function of dust temperature, color-coded by the logarithm of the total IR luminosity. The QSO PJ231−20 and its companion galaxy are marked by stars. For the companion we report the cases with an assumed dust temperature of 47 K and 35 K. These points are connected by a dashed line. The diamond marks the 3σ upper limit on quasar ULAS J1342+0928 at z = 7.54 (Novak et al. 2019), while the square is the upper limit on SDSS J2310+1855 at z = 6.00 (Li et al. 2020a,b). The latter limits are computed using the [NII]122 μm/[NII]205 μm line luminosity ratio to estimate the electron density and then the fraction of [CII]158 μm from the ionized gas from Oberst et al. (2006). Tdust and LTIR for SDSS J2310+1855 are derived via a dust SED fitting by Shao et al. (2019), and for ULAS J1342+0928, LTIR is estimated in Novak et al. (2019) by assuming Tdust = 47 K (here slightly shifted for better visualization). Circles represent the LIRG sample presented in Díaz-Santos et al. (2017). The solid black line shows the best-fit model ![]() , where S63 and S158 are the continuum flux density at 63 μm and 158 μm, respectively. The gray shaded area is the 1σ confidence interval. The approximate relation between the flux density ratio and Tdust is provided by Díaz-Santos et al. (2017), Tdust = 20.24 + 14.54(S63/S158)−3.75(S63/S158)2 + 0.46(S63/S158)3.
, where S63 and S158 are the continuum flux density at 63 μm and 158 μm, respectively. The gray shaded area is the 1σ confidence interval. The approximate relation between the flux density ratio and Tdust is provided by Díaz-Santos et al. (2017), Tdust = 20.24 + 14.54(S63/S158)−3.75(S63/S158)2 + 0.46(S63/S158)3.
Current usage metrics show cumulative count of Article Views (full-text article views including HTML views, PDF and ePub downloads, according to the available data) and Abstracts Views on Vision4Press platform.
Data correspond to usage on the plateform after 2015. The current usage metrics is available 48-96 hours after online publication and is updated daily on week days.
Initial download of the metrics may take a while.