Fig. 1.
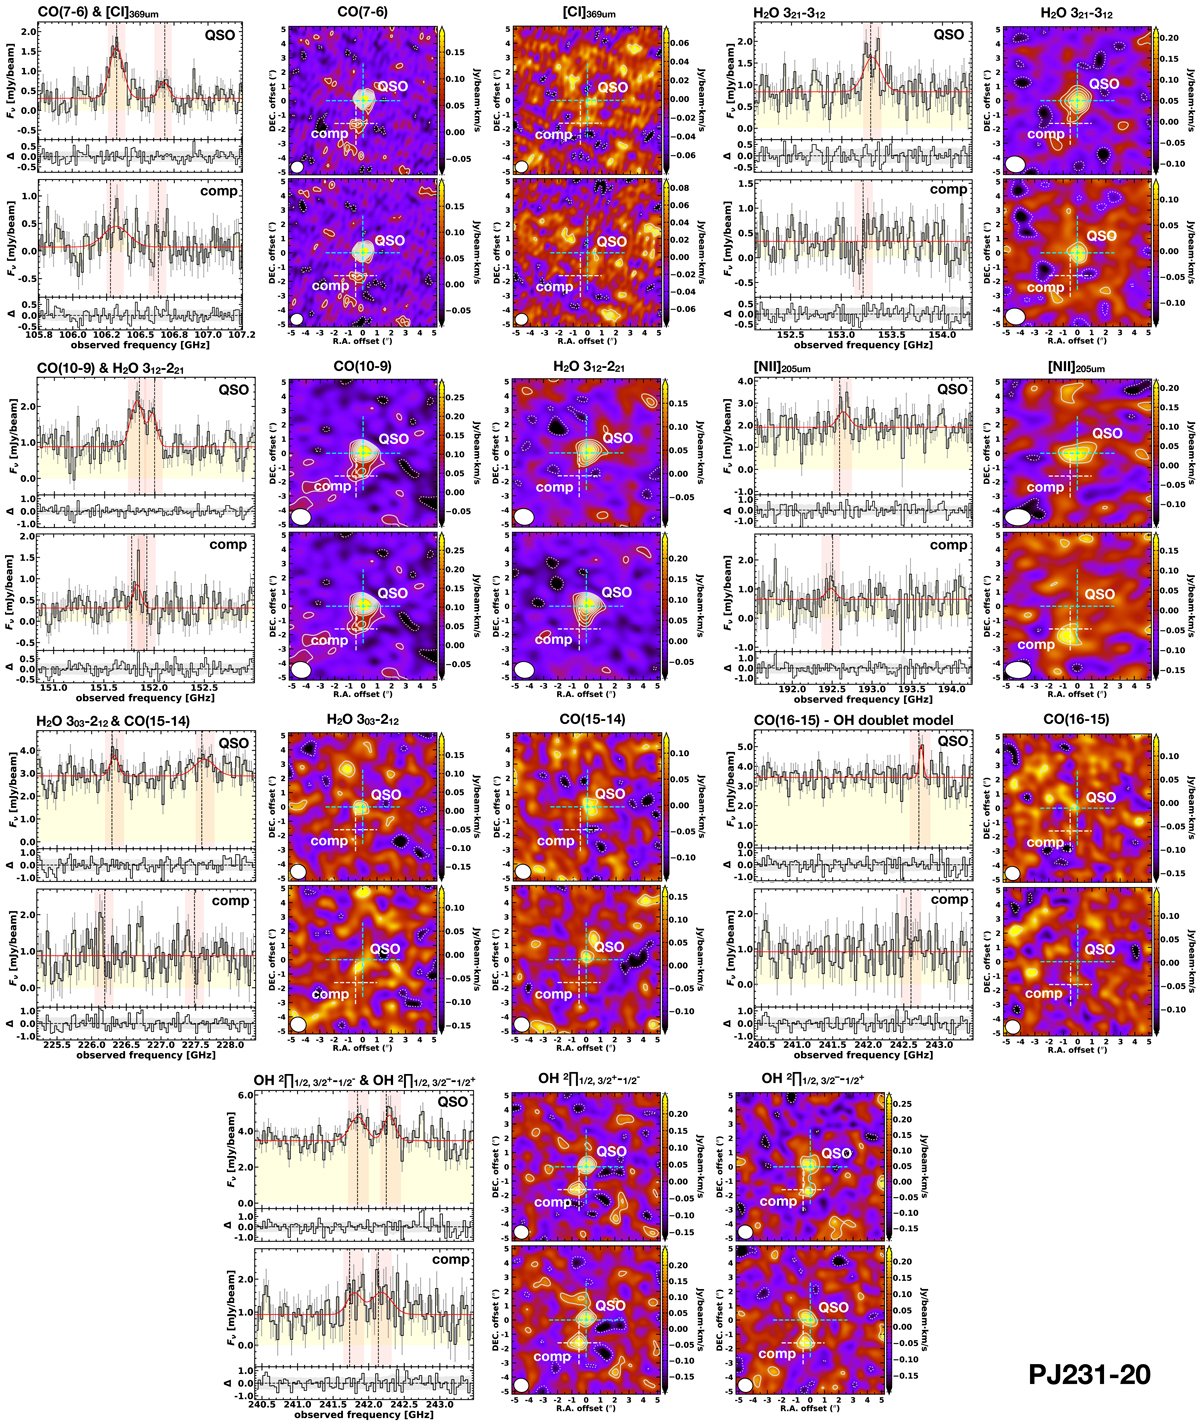
Detections and nondetections in system PJ231−20. We show the observed integrated spectra for the quasar and its companion galaxy in a frequency range around the targeted transition. In the panels showing the spectra, we show the best-fit model (red line), the fit residuals (at the bottom of each panel), the expected frequency of the line (vertical dashed black line) and the channels used to obtain the continuum-subtracted line velocity-integrated maps (over 360 km s−1) that are shown to the right of each spectrum (red shaded area). When the line is not detected, the best-fit model is a constant polynomial fitting the continuum emission alone. In the spectra covering the CO(16−15) line, we performed the fit after subtracting the best-fit model for the OH doublet (bottom panels). The spectra we show were extracted at the position of the quasar and companion galaxy. The positions of the sources are indicated in the line velocity-integrated maps with cyan and white crosses, respectively. The solid contours in the maps show the [2, 3, 4, 5, 6, 7, 8] × σ levels, and dashed contours indicate the −2σ level.
Current usage metrics show cumulative count of Article Views (full-text article views including HTML views, PDF and ePub downloads, according to the available data) and Abstracts Views on Vision4Press platform.
Data correspond to usage on the plateform after 2015. The current usage metrics is available 48-96 hours after online publication and is updated daily on week days.
Initial download of the metrics may take a while.