Fig. 4.
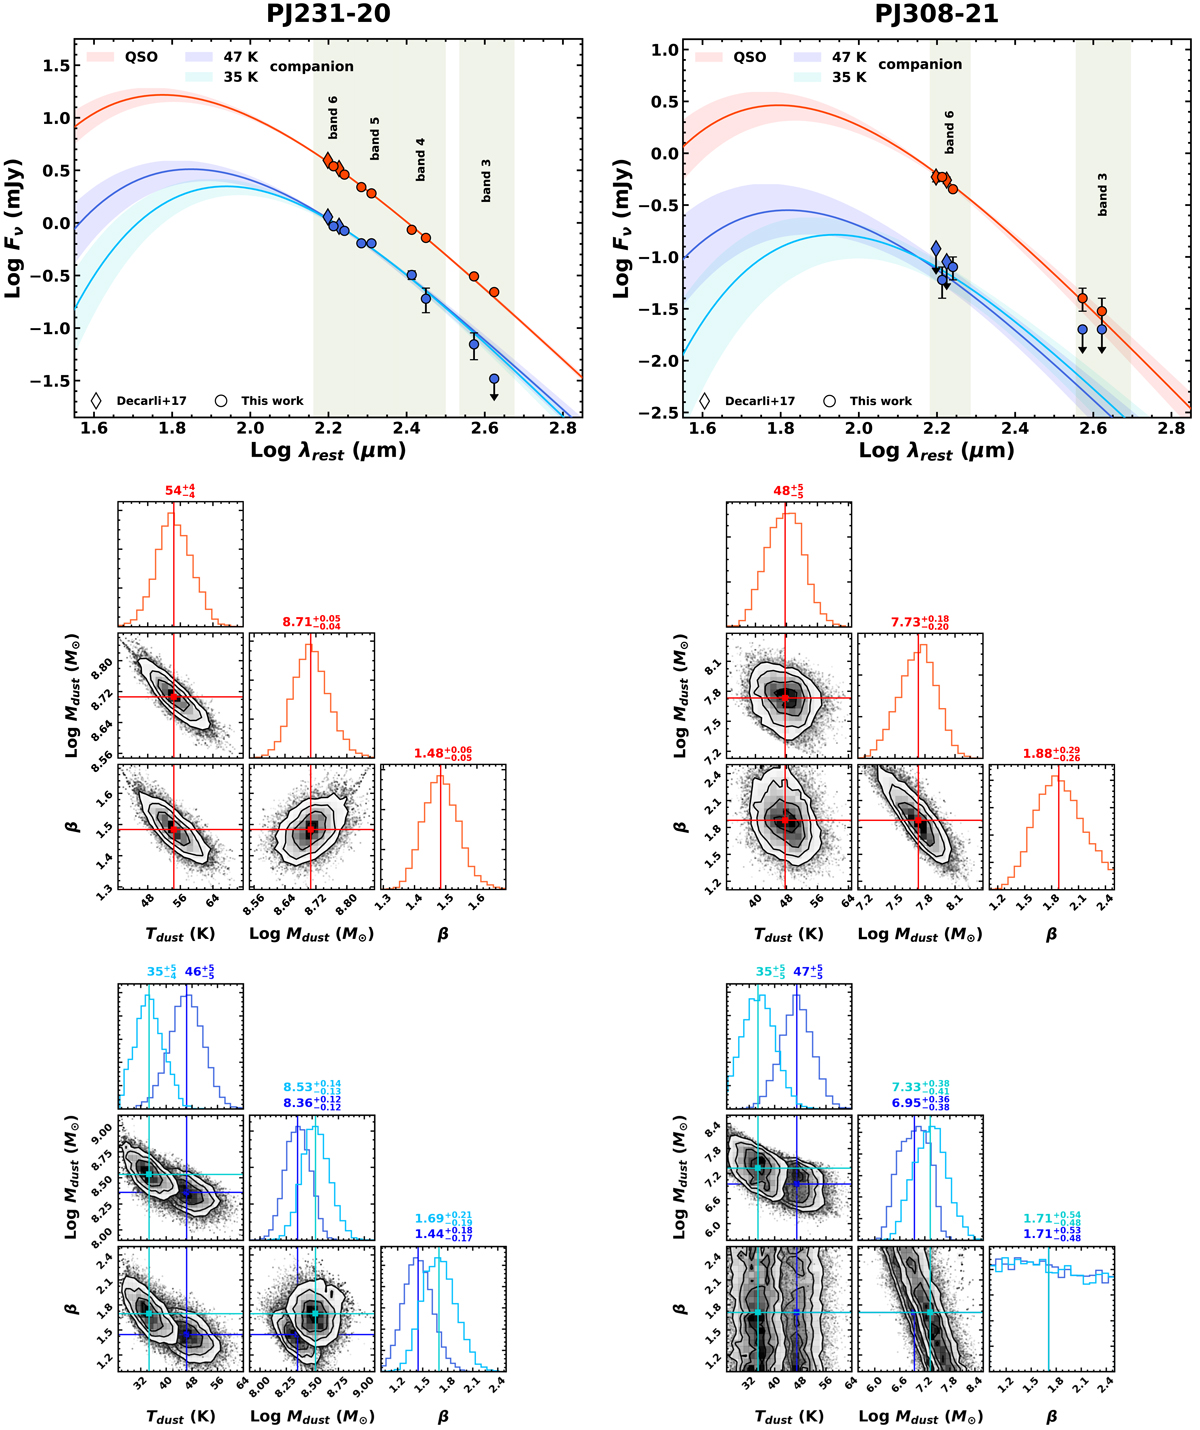
Models of the dust SEDs of sources PJ231−20 (left panels) and PJ308−21 (right panels). Upper panels: circles and diamonds indicate continuum data obtained in this work and those obtained from the ALMA Cycle 6 [CII]158 μm observations (Decarli et al. 2017), respectively. Downward arrows indicate 3σ upper limits. The best-fit modified blackbody model is indicated with a solid red line for the quasars, and the blue and cyan lines show the models for companion galaxies assuming Tdust = 47 K and 35 K, respectively. The shadowed areas show the 1σ confidence intervals. Green bands indicate the ALMA frequency bands redshifted to the quasar-companion pair rest frame (zpair = [zQSO + zcomp]/2). Lower panels: posterior probability distributions of the free parameters (red for quasars, blue and cyan for companions). The vertical lines indicate the best-fit values computed as 50th percentiles of the distributions. The best-fit values with their uncertainties are also reported.
Current usage metrics show cumulative count of Article Views (full-text article views including HTML views, PDF and ePub downloads, according to the available data) and Abstracts Views on Vision4Press platform.
Data correspond to usage on the plateform after 2015. The current usage metrics is available 48-96 hours after online publication and is updated daily on week days.
Initial download of the metrics may take a while.