Fig. 11.
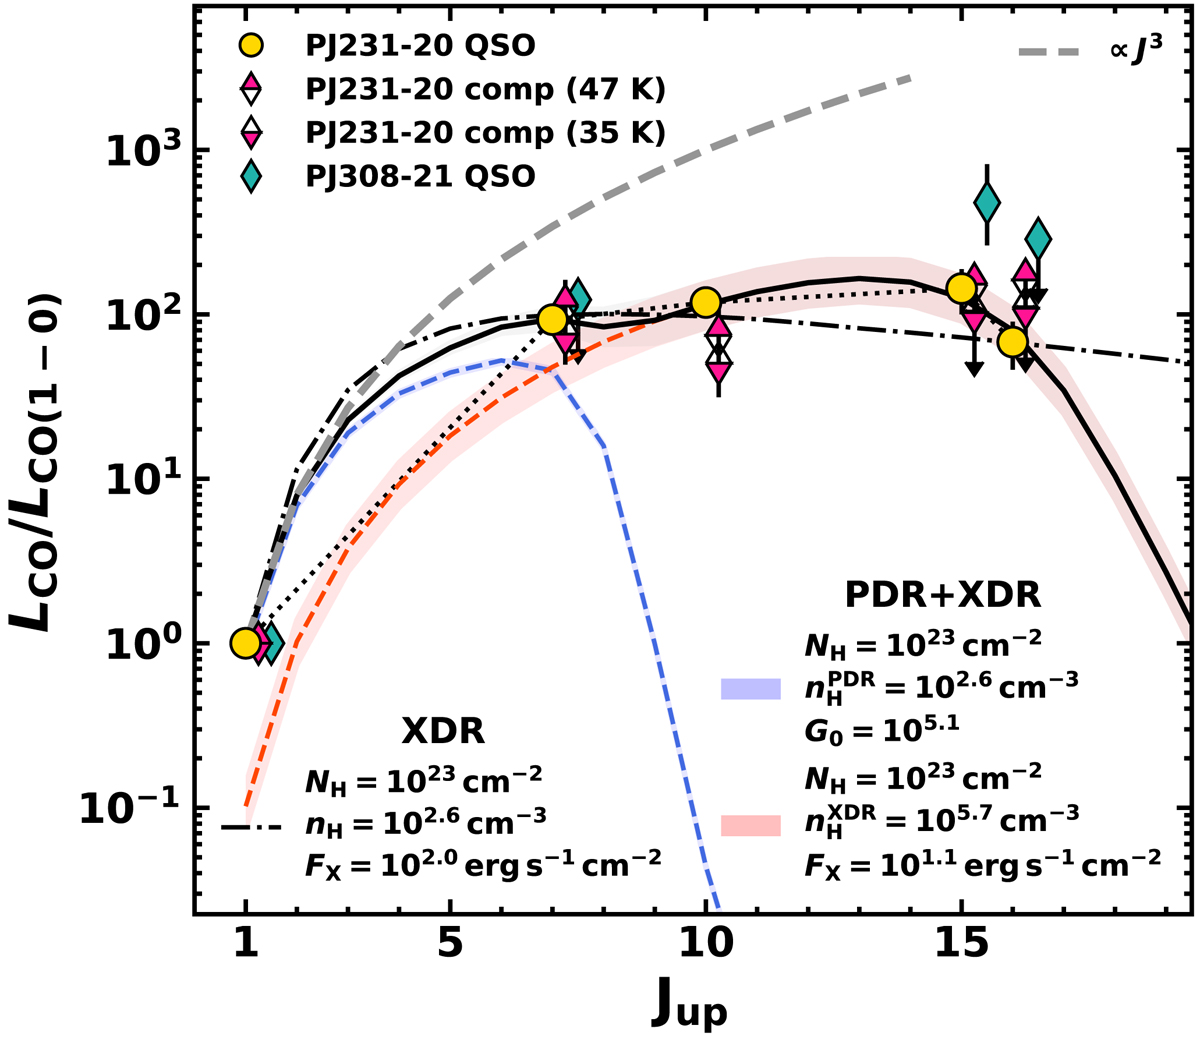
CO(1−0)-normalized SLED fits of QSO PJ231−20. Gold circles indicate the CO luminosity ratios measured in the quasar. The dot-dashed black line is the best-fit model using a single XDR model. The composite (PDR+XDR) model described in the text is represented with the solid black line. The dashed blue and red lines show the PDR and XDR component, respectively. The shadowed area indicates the 1σ uncertainties on the normalization values. Best-fit parameters are reported in the legends at the bottom of the figure. The dashed gray line is the theoretical trend (∝J3) of the CO SLED in the LTE, optically thick, and high-temperature (or low frequency) limit. The red and blue diamonds (slightly shifted horizontally for clarity) are the CO(1−0)-normalized SLED in the PJ231−20 companion galaxy and QSO PJ308−21, respectively. For the PJ231−20 companion we report the CO SLEDs obtained assuming Tdust = 47 K (half-top filled magenta diamonds) and 35 K (half-bottom filled magenta diamonds, see Sect. 8.2).
Current usage metrics show cumulative count of Article Views (full-text article views including HTML views, PDF and ePub downloads, according to the available data) and Abstracts Views on Vision4Press platform.
Data correspond to usage on the plateform after 2015. The current usage metrics is available 48-96 hours after online publication and is updated daily on week days.
Initial download of the metrics may take a while.