Fig. 8.
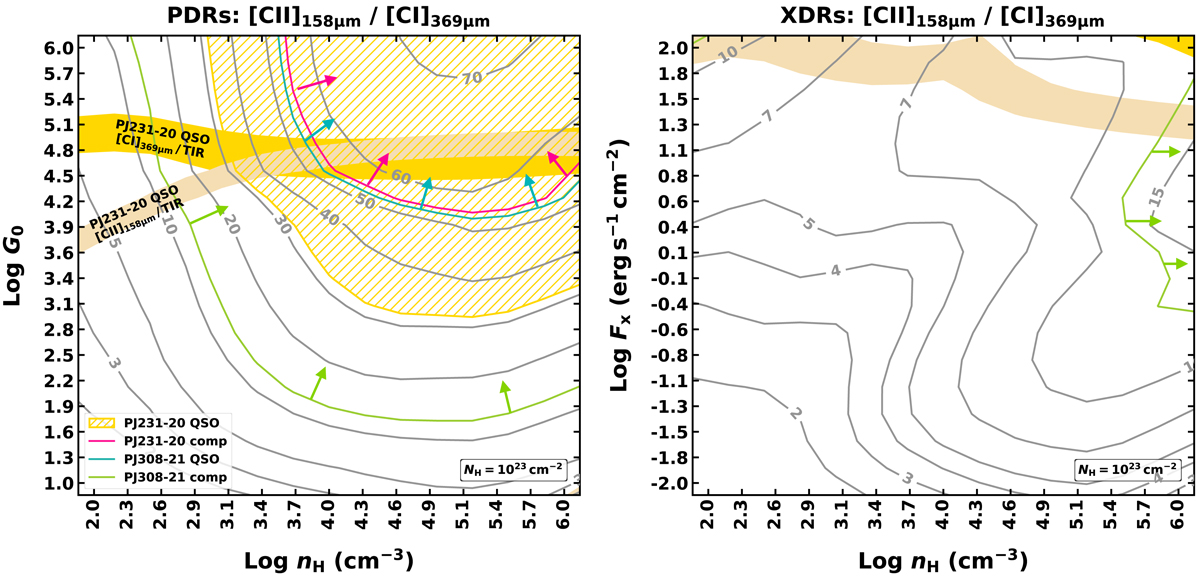
Grids of the [CII]158 μm/[CI]369 μm intensity line ratio as a function of the strength of the radiation field (G0 or FX) and total hydrogen density (nH) in the PDR (left panel) and XDR case (right panel). The adopted total hydrogen column density is NH = 1023 cm−2. Model values are indicated by gray contours (linear scale), and constraints on the observed line ratios are superimposed. The dashed gold area indicates the [CII]158 μm-to-[CI]369 μm luminosity ratio measured in QSO PJ231−20 within its uncertainties, and 3σ lower limits on the other sources are reported (see the legend in the bottom left corner of the left panel). The [CII]158 μm-to-[CI]369 μm ratios in QSO PJ231−20 and its companion are scaled according to the estimated fraction of [CII]158 μm arising from PDRs. The XDR case does not reproduce the observed ratios in any source, except for a small range of values corresponding to the lower limit measured in QSO PJ308−21. We also report the [CI]369 μm-to-TIR and [CII]158 μm-to-TIR luminosity ratio estimates in QSO PJ231−20 as filled gold and light brown areas, respectively. This provides additional constraints on the radiation field flux.
Current usage metrics show cumulative count of Article Views (full-text article views including HTML views, PDF and ePub downloads, according to the available data) and Abstracts Views on Vision4Press platform.
Data correspond to usage on the plateform after 2015. The current usage metrics is available 48-96 hours after online publication and is updated daily on week days.
Initial download of the metrics may take a while.