Free Access
Fig. 16.
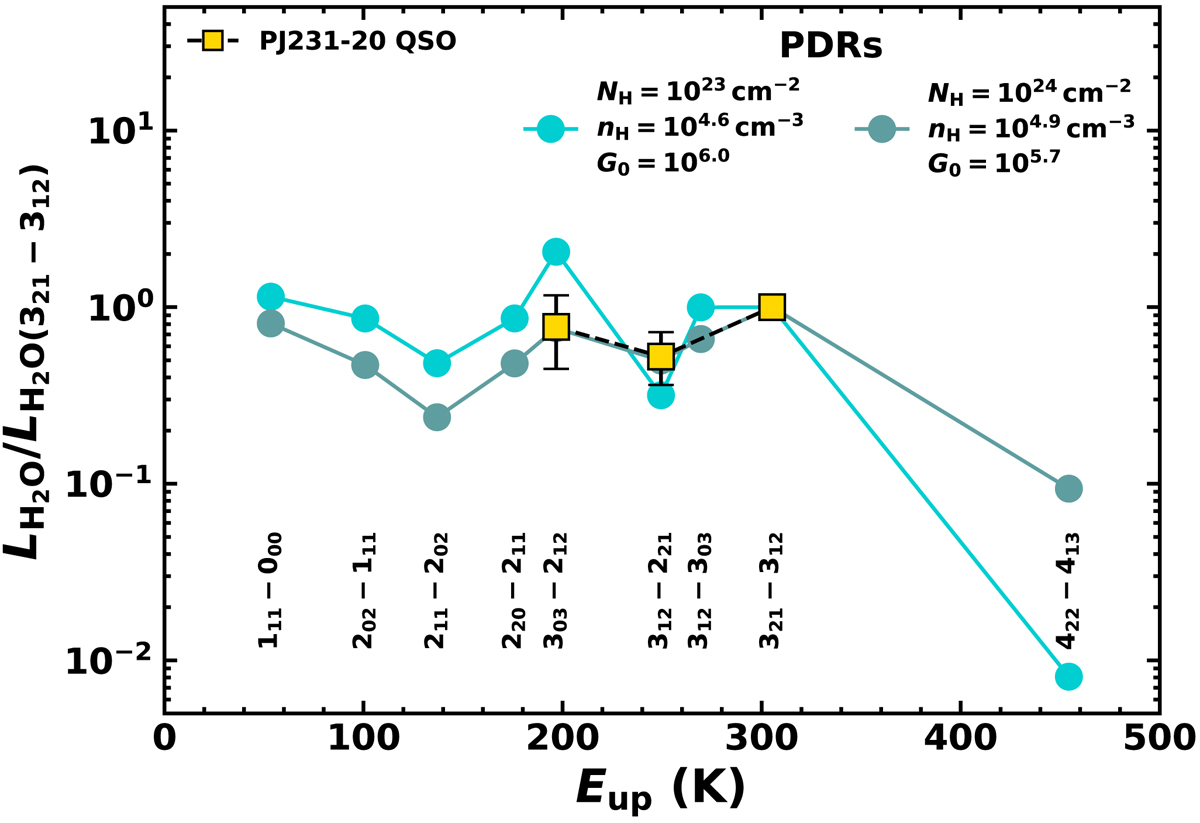
Best-fit models of the H2O(321 − 312)-normalized SLED in QSO PJ231−20. Gold squares are the observed line ratios, and light and dark blue circles are the PDR best-fit models with NH = 1023 and 1024 cm−2, respectively. The best-fit parameters are indicated in the upper part of the panel.
Current usage metrics show cumulative count of Article Views (full-text article views including HTML views, PDF and ePub downloads, according to the available data) and Abstracts Views on Vision4Press platform.
Data correspond to usage on the plateform after 2015. The current usage metrics is available 48-96 hours after online publication and is updated daily on week days.
Initial download of the metrics may take a while.