| Issue |
A&A
Volume 643, November 2020
|
|
|---|---|---|
| Article Number | A79 | |
| Number of page(s) | 13 | |
| Section | Stellar structure and evolution | |
| DOI | https://doi.org/10.1051/0004-6361/202038960 | |
| Published online | 06 November 2020 | |
Two stripped envelope supernovae with circumstellar interaction
But only one really shows it
1
Department of Astronomy, The Oskar Klein Center, Stockholm University, AlbaNova, 10691 Stockholm, Sweden
e-mail: jesper@astro.su.se
2
Cahill Center for Astrophysics, California Institute of Technology, 1200 E. California Blvd, Pasadena, CA 91125, USA
3
Racah Institute of Physics, The Hebrew University of Jerusalem, Jerusalem 91904, Israel
4
Department of Particle Physics and Astrophysics, Weizmann Institute of Science, 234 Herzl St, 76100 Rehovot, Israel
5
DIRAC Institute, Department of Astronomy, University of Washington, 3910 15th Avenue NE, Seattle, WA 98195, USA
6
Caltech Optical Observatories, California Institute of Technology, Pasadena, CA 91125, USA
7
Department of Astronomy, University of Maryland, College Park, MD 20742, USA
8
The eScience Institute, University of Washington, Seattle, WA 98195, USA
9
Astrophysics Group, Cavendish Laboratory, 19 J. J. Thomson Ave., Cambridge CB3 0HE, UK
10
Kavli Institute for Theoretical Physics, University of California, Santa Barbara, CA 93106, USA
11
IPAC, California Institute of Technology, 1200 E. California, Blvd, Pasadena, CA 91125, USA
12
Jodrell Bank Centre for Astrophysics, School of Physics and Astronomy, The University of Manchester, Manchester M13 9PL, UK
Received:
16
July
2020
Accepted:
15
September
2020
Context. We present observations of SN 2019tsf (ZTF19ackjszs) and SN 2019oys (ZTF19abucwzt). These two stripped envelope (SE) Type Ib supernovae (SNe) suddenly showed a (re-)brightening in their late light curves. We investigate this in the context of circumstellar material (CSM) interaction with previously ejected material, a phenomenon that is unusual among SE SNe.
Aims. We use our follow-up photometry and spectroscopy for these supernovae to demonstrate the presence of CSM interaction, estimate the properties of the CSM, and discuss why the signals are so different for the two objects.
Methods. We present and analyze observational data, consisting of optical light curves and spectra. For SN 2019oys, we also have detections in radio as well as limits from UV and X-rays.
Results. Both light curves show spectacular re-brightening after about 100 days. In the case of SN 2019tsf, the re-brightening is followed by a new period of decline, and the spectra never show signs of narrow emission lines that would indicate CSM interaction. On the contrary, SN 2019oys made a spectral makeover from a Type Ib to a spectrum clearly dominated by CSM interaction at the light curve brightening phase. Deep Keck spectra reveal a plethora of narrow high-ionization lines, including coronal lines, and the radio observations show strong emission.
Conclusions. The rather similar light curve behavior – with a late linear re-brightening – of these two Type Ib SE SNe indicate CSM interaction as the powering source. For SN 2019oys the evidence for a phase where the ejecta hit H-rich material, likely ejected from the progenitor star, is conspicuous. We observe strong narrow lines of H and He, but also a plethora of high-ionization lines, including coronal lines, revealing shock interaction. Spectral simulations of SN 2019oys show two distinct density components, one with density ≳109 cm−3, dominated by somewhat broader, low-ionization lines of H I, He I, Na I, and Ca II, and one with narrow, high-ionization lines at a density ∼106 cm−3. The former is strongly affected by electron scattering, while the latter is unaffected. The evidence for CSM interaction in SN 2019oys is corroborated by detections in radio. On the contrary, for SN 2019tsf, we find little evidence in the spectra for any CSM interaction.
Key words: supernovae: general
© ESO 2020
1. Introduction
Core-collapse (CC) supernovae (SNe) are explosions of massive stars (≳8 M⊙) reaching the end of their stellar life-cycles. The variety of CC SNe is largely determined by the progenitor mass at the time of CC, but also by the mass-loss history leading up to the explosion. Hydrogen-poor CC SNe originate from massive progenitor stars that have lost most – or even all – of their H envelopes prior to explosion. These include Type IIb SNe (some H left), SNe Ib (no H, some He), and SNe Ic (neither H nor He) as well as superluminous SNe of Type I (SLSNe-I). Collectively, SNe IIb, Ib, and Ic are called stripped-envelope (SE) SNe.
There are few observational constraints on mass loss for very massive stars, and the processes involved are poorly understood. Models argue that for a star to experience enough mass loss to become an SE SN, either strong stellar winds from very massive progenitors (≳30 M⊙, Groh et al. 2013) or binary interactions are needed. In the binary scenario the progenitors can be of somewhat lower mass (≲20 M⊙, e.g., Yoon 2015).
Evidence is emerging that a large fraction of SE SNe originate from binary systems. Both detailed studies of individual SNe, like the Type IIb SNe 1993J (Nomoto et al. 1993; Maund & Smartt 2009) and 2011dh (Ergon et al. 2014, 2015), as well as sample studies (Cano 2013; Taddia et al. 2015, 2018; Lyman et al. 2016; Prentice et al. 2019) indicate ejecta masses of just a few M⊙. This is too low to be consistent with the most massive stars that lose their envelopes due to winds (Groh et al. 2013). However, in either case, there must be ample material from the progenitor surrounding the stripped star at the time of explosion. The composition and distribution of this material contain information about the mass-loss process, as many of the binary stripping scenarios couple the phases of mass-transfer to the original binary separation (e.g., Smith 2014). The observational signatures would be evidence that the SN ejecta run into this circumstellar envelope material during some phase of the SN evolution. This interaction between the ejecta and the circumstellar material (CSM) can produce a significant contribution to the total luminosity (e.g., Chevalier et al. 2017).
Evidence for the presence of significant CSM has been found in some SE SNe of Type IIb; late spectra of SN 1993J showed a broad flat-topped hydrogen emission line that can be explained as being due to CSM interaction (Matheson et al. 2000; Houck & Fransson 1996; Fransson et al. 2005, see also Fremling et al. 2019 for similar signatures in ZTF18aalrxas).
The past years of observations have also revealed cooling phases similar to those observed in the early light curves (LCs) of SNe IIb, among other SE SN subtypes, indicating extended material outside these otherwise compact progenitors. Examples include the Type Ic SNe iPTF15dtg (Taddia et al. 2016) and iPTF14gqr (De et al. 2018), the latter of which also showed so-called flash spectroscopy signatures indicative of close-by CSM (Gal-Yam et al. 2014). Moreover, several SLSNe-I have been found to enter into an interaction phase with H-rich CSM in the years after explosion. In these cases, broad H features developed over time (Yan et al. 2017). Finally, SN 2014C (Milisavljevic et al. 2015), SN 2017ens (Chen et al. 2018), and SN 2017dio (Kuncarayakti et al. 2018) constitute three recent cases where SE SNe have spectroscopically metamorphosed into CSM interacting Type IIn SNe, revealing the presence of external CSM at later phases.
In this paper we present two SE SNe that were discovered after the peak in their evolution but started to (re-)brighten after a few months. The extra power needed for such a LC evolution is presumably CSM interaction simply because none of the other powering mechanisms at play at later phases are likely to display such a behavior (see e.g., Sollerman et al. 2019 for a discussion and assessment of some of the scenarios: magnetar, radioactivity, accretion).
The paper is organized as follows. In Sect. 2 we present the observations, including optical photometry and spectroscopy as well as some space-based observations and radio data. Section 3 presents a discussion of the similarities and differences between the two objects, and, finally, Section 4 presents our conclusions and contains a discussion where we put our observations in context with other SNe.
2. Observations
2.1. Detection and classification
SN 2019oys (a.k.a. ZTF19abucwzt) was first detected on August 28, 2019 (JD = 2458723.98), with the Palomar Schmidt 48-inch (P48) Samuel Oschin telescope as part of the Zwicky Transient Facility (ZTF) survey (Bellm et al. 2019; Graham et al. 2019). It was reported to the Transient Name Server (TNS1) on August 29. The first detection is in g band, with a host-subtracted magnitude of 19.14 ± 0.12 mag, at the J2000.0 coordinates α = 07h07m59.26s, δ = +31° 39′55.3″. This transient was subsequently also reported to the TNS by several other surveys; in September by Gaia and ATLAS and in November by Pan-STARRS.
SN 2019oys is positioned in the spiral galaxy CGCG 146-027 NED01 that had a reported redshift of z = 0.0165. Using a flat cosmology with H0 = 70 km s−1 Mpc−1 and Ωm = 0.3 this corresponds to a distance of 73.2 Mpc when accounting for peculiar velocities according to the NED2 infall model.
Our first ZTF photometry for SN 2019tsf (a.k.a. ZTF19ackjszs) was obtained on October 29, 2019 (JD = 2458786.03) with the P48. The first detection is in r band, with a host-subtracted magnitude of 17.40 ± 0.06 mag, at α = 11h08m32.80s, δ = −10° 28′54.4″ (J2000.0). This transient was first reported to the TNS by Gaia on October 30 (Hodgkin et al. 2019), and later also by ATLAS, ZTF and Pan-STARRS. The host galaxy of SN 2019tsf is NGC 3541, which has a well established redshift of z = 0.021 and a redshift independent distance of 83.9 Mpc from Springob et al. (2014), which we will adopt here.
None of these transients had constraining pre-explosion detections. For SN 2019tsf, Gaia reported upper limits from August, three months prior to discovery, and SN 2019oys had similarly non-constraining limits from the end of May. It seems that both SNe exploded when in Solar conjunction and were only discovered while already on the decline. The typical rise time for a Type Ib SN is ∼22 days (Taddia et al. 2015), so it is likely that we missed both the rise and the peak. Given the absolute r-band magnitude at discovery, they were likely found within a month from peak (compare Taddia et al. 2018, their Fig. 7). This is also consistent with the classification spectra. Since we do not know the time of explosion, throughout this paper we will always discuss both transients with phases with respect to first detection, as given above.
We classified SN 2019oys based on a spectrum obtained on August 29, 2019, with the Palomar 60-inch telescope (P60; Cenko et al. 2006) equipped with the Spectral Energy Distribution Machine (SEDM; Blagorodnova et al. 2018). It was the only spectrum we obtained of this transient in 2019, and we reported the classification to TNS as a Type Ib supernova. For SN 2019tsf, the classification was done by ePESSTO+ (Malesani et al. 2019). They reported a Type Ib SN close to peak brightness at a redshift of about 0.03, with no note of the NGC galaxy host.
Since both of these SNe were found declining, no additional attention was given to them for the next ∼100 days, but they were photometrically monitored as part of ZTF routine observations. The interest emerged again once the LCs all of a sudden started brightening at later phases.
2.2. Optical photometry
Following the discoveries, we thus obtained regular follow-up photometry during the declining phase in g and r band with the ZTF camera (Dekany et al. 2020) on the P48. Later on, after re-brightening started, we also obtained triggered photometry in gri with the SEDM on the P60. Light curves from the P48 come from the ZTF pipeline (Masci et al. 2019). Photometry from the P60 were produced with the image-subtraction pipeline described in Fremling et al. (2016), with template images from the Sloan Digital Sky Survey (SDSS; Ahn et al. 2014). This pipeline produces PSF magnitudes, calibrated against SDSS stars in the field. All magnitudes are reported in the AB system.
In our analysis we have corrected all photometry for Galactic extinction, using the Milky Way (MW) color excess E(B − V)MW = 0.06 mag toward the position of SN 2019tsf and E(B − V)MW = 0.08 mag toward the position of SN 2019oys (Schlafly & Finkbeiner 2011). All reddening corrections are applied using the Cardelli et al. (1989) extinction law with RV = 3.1. No further host galaxy extinction has been applied, since there is no sign of any NaID absorption in any of our spectra. The light curves are shown in Fig. 1.
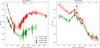 |
Fig. 1. Light curves of SN 2019oys (left) and SN 2019tsf (right) in g (green symbols) and r (red) band. These are observed (AB) magnitudes plotted versus observer frame time in days since first detection. Both these Type Ib SNe showed a dramatic increase in brightness after months of decline, and in the case of SN 2019oys that re-brightening continued over more than 100 days. The arrows on top indicate the epochs of spectroscopy, and the lines with error regions are Gaussian Process estimates of the interpolated LC, which were used to absolute calibrate the spectra. |
For SN 2019oys, the initial decline lasted at least 70 days (this is past discovery in the observer’s frame). It declined quickly in the r band at a rate of 3.0 mag per 100 days, and somewhat slower at 1.8 mag per 100 days in the g band, thus becoming less red with time. We then have a gap in our observations, and when imaging was resumed again after about a month in December 2019, it was clear that the decline had not continued, but that in fact the LC was now re-brightening. Once this was realized in mid-January 2020, a more intense follow-up was activated (Fig. 1). A few recent r-band data points have been added to the LC of SN 2019oys, which has remerged from solar conjunction and is still bright.
SN 2019tsf had a r-band decline over 60 days with a more normal (for SE SNe) rate of 1.4 mag per 100 days. The g-band LC is sparser, but is again shallower. For this SN we can more clearly see the onset of the brightening after about 70 days, the g-band LC rises most clearly by 0.46 mags over the next 26 days, whereas the r band increases by slightly less than 0.14 mag. The LC then peaks at  after 90 days after which it steadily declines again over the next 100+ days.
2.3. Swift observations
2.3.1. UVOT photometry
For SN 2019oys, which did show clear evidence for CSM interaction (see below), we triggered a series of ultraviolet (UV) and optical photometry observations with the UV Optical Telescope on board the Neil GehrelsSwift observatory (UVOT; Gehrels et al. 2004; Roming et al. 2005). Our first Swift-UVOT observation was performed on March 9, 2020, and provided detections in all the bands. However, upon inspection it is difficult to assess to what extent the emission is actually from the SN itself, or if it is diffuse emission from the surroundings. The last u-band detection appears to be real and point-like ( mag (AB) at JD = 2458986.81), but for the remaining bands we would need to await template subtracted images to get reliable photometry. Unfortunately, the SN was still brightening as it went behind the Sun.
2.3.2. X-rays
With Swift we also used the onboard X-Ray Telescope (XRT; Burrows et al. 2005). We used online analysis tools (Evans et al. 2009) to search for X-ray emission at the location of SN 2019oys. Combining the five epochs taken in March 2020 amounts to a total XRT exposure time of 12 251 s (3.4 h), and provides a marginal detection with  counts s−1 between 0.3 and 10 keV. However, again it is not possible to assess if this is emission from the transient or from the host galaxy. We can conservatively treat this as an upper limit on the possible X-ray luminosity of the SN itself. If we assume a power-law spectrum with a photon index of Γ = 2 and a Galactic hydrogen column density of 9.3 × 1020 cm−2 (HI4PI Collaboration 2016) this would correspond to an unabsorbed 0.3–10.0 keV flux of 7.5 × 10⁻¹³ erg cm−2 s−1. At the luminosity distance of SN 2019oys this corresponds to a luminosity of LX < 4.7 × 1041 erg s−1 at an epoch of ∼200 rest-frame days since discovery.
2.4. Optical spectroscopy
Spectroscopic follow-up was conducted with SEDM mounted on the P60. Further spectra were obtained with the Nordic Optical Telescope (NOT) using the A. Faint Object Spectrograph (ALFOSC), with the Keck-I telescope using the Low Resolution Imaging Spectrograph (LRIS; Oke et al. 1994), and with the Device Optimized for the LOw RESolution (DOLORES) on Telescopio Nazionale Galileo (TNG). A log of the spectral observations is provided in Table 1, which includes 19 epochs of spectrosopy (9 for SN 2019tfs and 10 for SN 2019oys). Two of the NOT spectra were obtained with a somewhat higher resolution than we normally use (grism 8 instead of grism 4) to probe the width of the narrower lines. These observations were taken for SN 2019oys on days 167 and 243. The LPipe reduction pipeline (Perley 2019) was used to process the LRIS data. SEDM spectra were reduced using the pipeline described by Rigault et al. (2019) and the spectra from La Palma were reduced using standard pipelines and procedures for each telescope and instrument. All spectral data and corresponding information will be made available via WISeREP3 (Yaron & Gal-Yam 2012).
Summary of spectroscopic observations.
2.5. Radio observations
Radio observations of the field of SN 2019oys were conducted using the Arcminute Microkelvin Imager – Large Array (AMI-LA; Zwart et al. 2008; Hickish et al. 2018). AMI-LA is an interferometer made up of eight 12.8 m antennas which operates with a 5 GHz bandwidth around a central frequency of 15.5 GHz. We conducted our first two AMI-LA observations of SN 2019oys on September 19 and 23, 2019. Initial data reduction, flagging, and calibration of the phase and flux, was carried out using a customized AMI data reduction software package. Phase calibration was done using interleaved observations of J0714+3534, while absolute flux calibration was achieved against 3C286. Additional flagging was performed using CASA. The first two radio observations resulted in detections of a source at the phase center with an estimated flux of 0.35 mJy at 15.5 GHz, but with no apparent flux evolution. Following the spectacular coronal line spectrum obtained for SN 2019oys at the Keck telescope, providing strong evidence for CSM interaction, we triggered AMI-LA again on March 6, 2020. This observation provided a strong detection of the SN with a significantly higher flux of 9 mJy at 15.5 GHz, and the radio image is shown in the inset of the radio LC in Fig. 2.
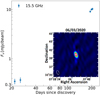 |
Fig. 2. Radio light curve of SN 2019oys at 15.5 GHz as observed with AMI-LA. The inset in the lower right shows the radio image from March 6, 2020, when the SN was detected at a level of 9 mJy. Fluxes are provided in Table 2. |
We also observed the field of SN 2019oys with the Karl G. Jansky Very Large Array (VLA) on March 16, 20204, while the VLA was in C configuration. The observations were performed in the S- (3 GHz), C- (5 GHz), X- (10 GHz), Ku- (15 GHz), K- (22 GHz) and Ka- (33 GHz) bands. We report here a spectral radio peak of Fν = 21.5 ± 1.0 mJy at a frequency ν = 23.5 ± 1.3 GHz. The log of the radio observations and measurements is provided in Table 2. We hope to continue monitoring SN 2019oys with the VLA.
SN 2019oys – radio observations.
3. Discussion
3.1. Light curves
The g- and r-band LCs of our two SNe are displayed in Fig. 1. The general behavior of the LCs was already discussed in Sect. 2.2, and the main characteristic is of course the linear decline which is suddenly turned into a re-brightening. In Fig. 3 we show both LCs together in absolute magnitudes (here in the r band). This shows that SN 2019tsf is more luminous than SN 2019oys by almost a magnitude at discovery, and remains brighter until about 150 days later, when the prolonged re-brightening of SN 2019oys catches up. For comparison we have also included a typical Type Ib SN, iPTF13bv from Fremling et al. (2016). This SN LC has been shifted by about two weeks for the maximum brightness to coincide with the discovery of our two SNe, and the distance and MW extinction have been adopted from Fremling et al. (2016). The maximum brightness for iPTF13bvn is similar to what we see at discovery for our two SNe, but after the diffusion phase the normal Type Ib fades faster. There is more late time photometry available for iPTF13bvn, and the line in the figure connects smoothly to these data at about 200 days when iPTF13bvn is much fainter than SNe 2019oys and 2019tsf. Our SNe clearly show very different LCs, and this is further discussed in Sect. 4.
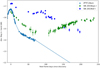 |
Fig. 3. Light curves in absolute r-band magnitude (Mr) for our two supernovae. This accounts for distance modulus and MW extinction as discussed in the text, but no additional corrections for host extinction. In addition we have plotted the Type Ibn SN iPTF13bvn (Fremling et al. 2016), which is a typical radioactively powered SE SN. This SN was shifted in time to match the peak to the discovery dates of our SNe. The photometry has been binned to nightly averages. |
We do not have enough photometric bands to construct a proper bolometric LC. We caution therefore that the strong brightening in the r band for SN 2019oys is to a large extent due to line emission in Hα. The g − r color got steadily bluer during the decline of the LC, while in the rising phase the color is again quite red. Between 150 and 172 days, Hα increased from ∼60% to ∼72% of the r-band flux. This is reminiscent of the LC of the Type IIn SN 2006jd, where the r−band flux reached a minimum at ∼190 days, and then again brightened by ∼1 mag. The quasi-bolometric LC of SN 2006jd showed a flat behavior and later a decline during this period (Stritzinger et al. 2012, their Fig. 9). A difference between SN 2019oys and SN 2006jd is that the dip in the r band is shallower and the minimum occurs at a later epoch for SN 2006jd.
3.2. Spectroscopy
For SN 2019tsf the classification spectrum revealed a Type Ib supernova (Malesani et al. 2019; Sect. 2.1). When we run SNID (Blondin & Tonry 2007) on this spectrum, the best match is SN 2008D, a well monitored Type Ib. We show this comparison in Fig. 4. The next spectrum was only obtained more than two months later, after the brightening, with the NOT using ALFOSC (Table 1). The aim of this second spectrum was to search for evidence for CSM interaction that could explain the rising LC. As can be seen in Fig. 4, no signatures of CSM interaction are present in the spectra. We continued the spectroscopic campaign with spectra from P60, TNG, Keck and NOT – until the SN faded out of spectroscopic sight. The spectral evolution was quite slow – no significant evolution is apparent in the sequence from 80 to 180 days from discovery. In Fig. 4 we also compare the late spectra of SN 2019tsf with that of another ZTF SN, the Type Ib SN 2019vsi. That spectrum was obtained with NOT+ALFOSC about 80 days past discovery and shows great similarity to the spectra of SN 2019tsf. Overall, we see little spectroscopic evidence that SN 2019tsf interacted with a CSM.
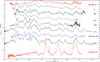 |
Fig. 4. Spectral sequence of SN 2019tsf demonstrating that the spectral evolution is quite slow. We show a selection of the spectra listed in Table 1. Phases given in rest-frame days are provided for each spectrum. The uppermost spectrum (in red) is of the Type Ib SN 2008D obtained 6 days past maximum light from Malesani et al. (2009). This gives the best match of the classification spectrum using SNID. The spectra obtained at ∼100 days when the SN was re-brightening are still quite similar to the typical Type Ib SN spectrum obtained close after discovery. The third to last spectrum (in blue) is of the Type Ib SN 2019vsi about 80 days past discovery, and shows great similarity with the spectra of SN 2019tsf. In addition, and as a an example of a more normal late time spectrum we also show SN 2008D at t = 132 d presented in Modjaz et al. (2009). SE SNe at these epochs are typically dominated by forbidden emission lines of Mg I], [O I], and [Ca II]. No signs of narrow lines or other features signaling CSM interaction can be found in the spectra of SN 2019tsf, in stark contrast to the case of SN 2019oys. The spectra are normalized and offset for clarity. All data will be made available via WISEREP. |
On the contrary, SN 2019oys displayed a spectacular metamorphosis. The first classification spectrum displayed a Type Ib SN with no signs of CSM interaction. Again, SN 2008D provides the best match by SNID, as illustrated in Fig. 5. That spectrum of SN 2008D was obtained 6 days past peak brightness, and is again an indication that our SNe were discovered past peak, but not by much. Also SN 2019oys was basically ignored for a long time, it was not considered interesting enough for spectroscopic follow-up given the lack of a well-determined explosion date. When we realized the SN was on the rise, we triggered the NOT, which revealed a booming narrow-line dominated spectrum. This was completely unlike the first spectrum. Wondering whether we might have missed some of these narrow features in the early very low dispersion SEDM spectrum, we took another SEDM spectrum just a few days later – and again got an emission line dominated spectrum, with a particularly strong Hα line. Whereas the SEDM spectra cannot reveal the dense forest of narrow lines, the metamorphosis was clearly apparent also in this comparison. The spectral sequence displayed in Fig. 5 illustrates this; the sudden transition from a Type Ib to what is better described as a Type IIn SN. To properly showcase the evolution of the spectra on the re-brightening part of the LC, we show these spectra on a logarithmic scale in Fig. 6. This allows displaying our best observations showing a sequence of dense narrow-line spectra rich in high-ionization coronal lines. This figure also includes a comparison with a spectrum of the spectacular coronal line supernova SN 2005ip, taken from Stritzinger et al. (2012). SN 2005ip was a SN that displayed many similarities to SN 2019oys. It was first classified as a Type II SN, although in hindsight it did display a number of narrow emission lines already close to discovery. The LC of SN 2005ip also lacked constraints on the time of explosion, but did after about 200 days stop declining and entered more of a flat plateau, rather than the more dramatic increase in brightness that SN 2019oys delivered. The richness of coronal lines in SN 2005ip was unprecedented (Smith et al. 2009). The spectrum of SN 2019oys is equally rich, and we provide a list of line identifications in Table 3. The SN displays high-ionization species such as for example [Ar XIV], [S XII], [Ne V] and [Fe XI]. We provide our line identifications on the merged day 172 and 204 spectrum of SN 2019oys in Fig. 7.
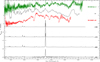 |
Fig. 5. Spectral sequence of SN 2019oys showing an abrupt change from the very first Type Ib spectrum obtain by the P60, to the later spectra acquired once the LC started to brighten. These latter spectra show clear evidence for CSM interaction as evidenced by the dominance of the narrow emission lines. We show a selection of the spectra listed in Table 1 for this SN. Phases in rest-frame days are provided for each spectrum. The third spectrum from the top is of the Type Ib SN 2008D (Malesani et al. 2009) at 30 days past maximum light (red), which gives the best match to our classification spectrum using SNID. In addition, we compare to the +1 days spectrum of SN 2001em from Shivvers et al. (2019; green). The spectra obtained at ≳150 days when the SN was re-brightening are quite similar to the spectra of the Type IIn SN 2015ip and this is highlighted in Fig. 6. |
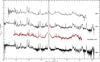 |
Fig. 6. Spectral sequence of SN 2019oys during re-brightening. A handful of the spectra listed in Table 1 are shown, and here on a logarithmic scale to highlight the bright narrow emission lines. Phases in rest-frame days are provided for each spectrum. A spectrum of the Type IIn SN 2015ip is shown for comparison (in red). This spectrum is from Stritzinger et al. (2012) taken at 138 days past discovery. Basically all high excitation coronal lines seen in SN 2005ip are also detected in SN 2019oys, a main difference being that our SN do not display the broad Hα line from hydrogen-rich ejecta. The spectra are normalized and offset for clarity. |
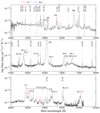 |
Fig. 7. Line identifications of the reddening corrected, merged spectrum of SN 2019oys from days 172 and 204. The narrow high-ionization lines are marked at the top. The H I and He I lines are marked with red and blue lines, respectively. |
Selected emission lines in SN 2019oys.
We measured the lines with Gaussian fits using iraf/splot on the Keck spectrum from day 172. This was combined with the spectrum from day 204 to increase the signal to noise since these two spectra were virtually identical, but the flux scale was set to that of the day 172 spectrum. We used the nearby continuum as the baseline, and slightly varying the position of the continuum provides an estimate on the uncertainty in the emission line flux. For example, the [Ne V] λ3426 has a flux of 5.4 × 10⁻¹⁶ erg s−1 cm−2 with an uncertainty of less than 7%. However, we caution that whereas this provides a good measure of the significance of the line, using such fluxes for diagnostics is better done in connection with a physical model that can justify the real baseline, and this is well illustrated in Fig. 8. The line measurements are provided in Table 3. We note that this is only a selection of the numerous lines, the spectra are made available for further measurements. The narrow lines are unresolved at the spectral resolution (7 Å) of LRIS with grisms 400/3400/8500.
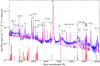 |
Fig. 8. Synthetic spectrum (magenta) together with the reddening corrected, merged spectrum of SN 2019oys from days 172 and 204 (blue) with line identifications. The assumed blackbody continuum is shown as the dashed cyan line. The red marks at the bottom indicates the forest of Fe II lines with heights reflecting the relative intensities adopted from Sigut & Pradhan (2003). These provide indications for where to expect contribution from iron lines, and which regions are not expected to be contaminated by such emission. |
Table 3 demonstrates that we detect and identify most of the multitude of emission lines also detected in SN 2005ip. Some notable exceptions are the [S II] λλ6717, 6731 that were strong in SN 2005ip, but are very weak in SN 2019oys. Overall, however, the conditions present in the line forming region(s) must be quite similar between these two SNe, these conditions were also studied in detail by Stritzinger et al. (2012) and earlier also for the Type IIn SNe 1995N (Fransson et al. 2002) and 2010jl (Fransson et al. 2014). We discuss some diagnostics of the emission lines in the subsections below.
There are of course also some differences between the two above-mentioned SNe. Figure 6 shows that SN 2005ip displayed a broad component of Hα, which is not present in SN 2019oys. This is a signature of the hydrogen-rich fast-moving ejecta that this Type II SN showed already from early times. SN 2019oys is instead an SE Type Ib SN, and such a SN is less likely to metamorphose into a rich coronal line dominated transient.
In fact, fewer than a handful of SE SNe are known to have transitioned to CSM interacting objects, as mentioned in the introduction. SN 2017ens (Chen et al. 2018) was a very/super luminous Type Ic-BL that hit CSM after 150 days. It also displayed some coronal lines, but the LC never re-brightened. This was a unique object, but indeed shares many properties with SN 2019oys. SN 2017dio (Kuncarayakti et al. 2018) was a Type Ic that already from the start showed evidence for CSM interaction in terms of narrow emission lines. Rather than showing a spectacular change in spectral properties, it displayed a double nature with pseudo-continuum Type Ic spectral features with narrow Balmer lines á la Type IIn superimposed.
Finally, we must mention SN 2014C (e.g., Milisavljevic et al. 2015) which is a well studied SE SN that ran into CSM and which transformed from a Type Ib to a Type IIn SN, just like SN 2019oys, a phenomenon also seen in SN 2001em (Chugai & Chevalier 2006; Chandra et al. 2020). Also in this case, late-time high-resolution spectra revealed coronal lines. This small family of changing type SNe demonstrates the existence of nearby dense hydrogen-rich CSM close to – but not too close to – the stripped progenitor star, possibly from binary evolution and/or violent eruptions (e.g., Sun et al. 2020). Recently, SN 2018ijp was also interpreted as an SE SN with “delayed interaction” (Tartaglia et al. 2020).
Having mentioned several SNe showing a similar spectroscopic transition as did SN 2019oys, it is worth reminding the reader that the LC of SN 2019oys is quite unique within this sample. Whereas SN 2005ip displayed a drastic change in decline when the CSM interaction started in earnest, the late LC was more of a plateau than an actual rise. SNe 2014C, 2017dio and 2017ens also did not show signs of re-brightening, although for SN 2017dio it is possible that we missed the early phases.
3.2.1. Lyman-alpha fluorescence
The near-infrared (NIR) part of the spectrum shown in Fig. 7 displays a strong complex of lines. This has been seen previously in other SNe, in particular in SN 1995N (Fransson et al. 2002) and also for SN 2005ip (Fox et al. 2020) and has been explained as the result of fluorescence of Fe II by Lyα. In this process, electrons in the a4De level of Fe II are excited to levels ∼11.2 eV above the ground state by accidental resonances with the Lyα line (Johansson & Jordan 1984; Sigut & Pradhan 1998, 2003). The cascade to lower levels results in a UV line and a line in the NIR. Because these levels with high excitation temperatures are difficult to excite by thermal collisions, the presence of these NIR lines is a strong signature of radiative pumping by Lyα. Although we do not have any UV spectra, our Keck spectra in particular allow us to examine the NIR features.
Because of the multitude of Fe II lines all over the optical and NIR ranges, spectral simulations are required in order to identify the most likely and strongest transitions. We use the predicted line fluxes from the Active Galactic Nuclei (AGN) simulations by Sigut & Pradhan (2003). The relative fluxes of all Fe II lines from the list of Sigut & Pradhan (2003) are shown as vertical bars in Fig. 8. While the model identifies most of the Fe II lines in the range below ∼5300 Å, which can be thermally excited, the interesting region is at ∼8400 − 9600 Å, as can be seen in the lower panel of Fig. 7. In addition to the broad Paschen lines up to at least the n = 14 → 3 transition, the Ca II triplet, and narrow [S III] λλ9069, 9531 lines, there are also a number of narrow lines from Fe II. While several of these are blended with lines from other ions, there are some lines which are not coming from lighter elements. In particular, the lines at 8927, 9123, 9132, 9176, 9178 Å can not be identified with other ions. These, together with the Fe IIλ8451 line, are also the ones expected to be strong in the model. The latter line is blended with a broad feature. While there is some contribution from high order Paschen lines, there is likely to be a strong contribution from O Iλ8446, which is expected as a result of fluorescence with Lyman β (Bowen 1947). There is thus strong evidence for narrow Fe II lines excited by Ly α.
3.2.2. Synthetic spectrum
To infer some basic properties of the CSM we have also calculated a synthetic spectrum of SN 2019oys. This was also very useful to help in the identification of the lines in view of the line blending and many Fe II lines present. In this analysis we follow the method in Fox et al. (2020), and here only summarize the main ingredients.
The analysis assumes a two-zone model with separate densities for the narrow-line region and for the region responsible for the broader, electron scattering affected lines. Temperature and densities of these zones are treated as parameters. Model atoms including both collisional and radiative rates are calculated for H I, He I, N II, O I, O III, Ne III-V, Ca II and FeVI-VII. As shown in Sect. 3.2.1, Fe II is strongly affected by line fluorescence by Lyα, and would require a much more sophisticated treatment. Instead we rely on the calculation by Sigut & Pradhan (2003), which although intended for AGN conditions, should give approximate fluxes for the strongest lines, helping in identification of the multitude of Fe II lines.
The temperature of the CSM was set to 20 000 K, and we have assumed a blackbody background continuum with a temperature of 9500 K. As shown in Dessart & Hillier (2005), the real spectrum is likely to depart from a blackbody, especially in the UV, but lacking more accurate calculations we use a blackbody as an approximation. For the line profiles we assume a Gaussian shape for the narrow high-ionization lines and an exponential line profile for the broad lines affected by electron scattering (Huang & Chevalier 2018). For Hα this is seen to extend to at least ∼ ± 4000 km s−1. The synthetic spectrum is displayed in Fig. 8, together with the reddening corrected, merged spectrum of SN 2019oys from days 172 and 204 (Fig. 7).
Starting with the broad electron-scattering dominated lines, the steep Balmer decrement with F(Hα)/F(Hβ)∼8.5 requires a high density to produce optically thick Balmer lines. The density depends on the temperature, and assuming 20 000 K requires a density of the broad line region of ∼ 2 × 109 cm−3. While this gives a good agreement for the Hα/Hβ ratio and the unblended Paschen lines, it under-produces the higher Balmer lines by a factor of ∼2. This is most likely a limitation of the one-zone model for the broad lines. In reality, the higher Balmer lines may arise deeper as compared to Hα, where the density and temperature is higher. The relative fluxes of the He Iλλ5876, 6678, 7065 lines are also well reproduced. The He Iλ5876 line has a different shape compared to the other He I and H I lines. This is well explained as a result of blending with the Na I D doublet, thus confirming the presence of these lines. In the NIR, the Ca II triplet is part of the feature at 8500 − 8650 Å, consistent with broad lines.
For the narrow line region we assume a density 105 − 106 cm−3. The lower density agrees with the large [O I] λλ 6300, 5577 ratio. The [O III] λλ5007, 4363, [S III] λλ9531, 6312 and [FeVI-VII] lines, on the other hand, indicate a higher density, ∼ 106 cm−3 is needed in order to explain the auroral lines. A similar density is also indicated by the [Ne III] λλ3869, 3342 lines, although the latter line is blended with [Ne V] λ3346. From the known ratio of [Ne V] λ3426 to [Ne V] λ3346 we can, however, determine an approximate flux of the [Ne III] λ3342 line. Both the H I and He I have also narrow components, coming from the same region as the high-ionization lines.
The main disagreement in the fit are the broad features at ∼7300 Å and ∼5000 Å. The former is centered around the [Ca II] λλ7291, 7324 lines. If this emission originates at deeper optical depth than the Balmer lines, the line profile could undergo more scatterings, resulting in broader wings without a central, narrow component. This may also explain the broad feature around ∼8600 Å, centered at the Ca II triplet.
Summarizing, we find evidence for two different density components. One inner component with high density and large column densities, responsible for the broad, low-ionization lines which are affected by electron scattering. The lower density component is instead the site where the narrow high-ionization lines are formed. The latter is unaffected by electron scattering, arguing for it being exterior to the high density region. An alternative may be an anisotropic geometry, where the broad component may arise from the interaction with the ejecta and e.g. a torus-like, dense CSM. A problem for such a scenario is that we do not see any evidence for macroscopic high velocity ejecta, although the orientation may hide this.
The good match of the synthetic spectrum has guided us in the line identifications provided in Figs. 7, 8 and in Table 3. This is particularly important in view of the many blends and “contamination” by especially Fe II lines.
4. Interpretation and conclusions
In this paper we have presented two SE Type Ib SNe whose LCs after months of decline suddenly started re-brightening. Such events are no doubt rare, and these discoveries heavily rely on the sky survey of ZTF which can not only discover many different kinds of transients, but also monitor them routinely enabling us to unravel unusual behavior also at later epochs. One of the supernovae, SN 2019tsf, brightens only for a month, and then returns to a declining phase of the LC. Even though we managed to obtain high quality optical spectra at the time of the LC bump, no clear spectral signatures of CSM interaction were seen. SN 2019oys, on the other hand, continued to rise, and the spectral metamorphosis is second to none of the few similar changing-type SE SNe known. The CSM interaction is evident and obvious and provide us with a plethora of diagnostic lines to investigate the surrounding environments. The dichotomy illustrated by this pair of SNe highlights a number of issues in contemporary SN studies.
There is in fact an under-abundance of studies of what spectral signatures CSM interaction should provide. In the context of SLSNe-I, extraordinary luminous hydrogen-free transients, CSM interaction has been considered unlikely. This was partly based on the lack of narrow emission lines in their spectra (Mazzali et al. 2016), although that particular work focused more on modeling spectra without interaction rather than demonstrating that interaction could happen without spectral signatures. There are also SE SNe where interaction became more evident at late stages, but where narrow emission lines never dominated the spectrum (e.g., Matheson et al. 2000, for SN 1993J). The discussion was exacerbated with the curious iPTF14hls, a Type II SN with a spectacularly long-lived LC (Arcavi et al. 2017) where most of the run of the mill explanations for powering mechanisms did not work out, and where CSM interaction was probably the last scenario standing (Sollerman et al. 2019). Andrews & Smith (2018) explained the fact that such a CSM interaction did not reveal itself in the spectral evolution as being due to a particular geometry hiding the interaction site, although actual modeling of such a mechanism remain unexplored. It is somewhat inherent in the problem that while we can do detailed diagnostics of the properties of the gas emitting the narrow lines, as illustrated in Sect. 3.2.2 for SN 2019oys, it is more difficult to deduce the reasons for not seeing such emission for objects lacking the diagnostic lines such as SN 2019tsf.
Possible explanations for the lack of circumstellar lines includes that the ionization is so high that all ions emitting in the optical band are ionized. A high ionization may be the result of either a high X-ray luminosity or a low density. Another possibility is that in order to see narrow lines there has to be a large enough region of low density material. A region with a large optical depth to electron scattering might wash out the lines completely into the continuum. We echo the conclusions of Chatzopoulos et al. (2012, 2013) in that more detailed modeling is needed to investigate such scenarios.
Whereas the powering scenarios required to sustain long-lived or superluminous LCs without displaying conspicuous spectral signals have been discussed in the literature, the problem is somewhat intensified by the two SNe presented in this work. They (re-)brighten significantly at late times, and it is quite challenging to envision any mechanism other than CSM interaction responsible for this behavior. The well-monitored re-brightening allowed spectroscopic observations at the time of the interaction. We are left with two stunningly different spectral signals – one CSM interaction scenario showing a loud and clear Type IIn spectrum while the other simply does not. This reinforces the need for better understanding of the CSM scenario.
Returning to the LCs, and comparing to a prototypical SN Ib, such as iPTF13bvn in Fig. 3. On the one hand, the peak absolute magnitude of iPTF13bvn is in the same ball-park as the brightest points for our two SNe. We note again that this is not a bolometric LC, but in the r band. For iPTF13bvn, there were enough data to build and model a bolometric LC, and the conclusion was that it could be powered by 0.072 M⊙ of 56Ni (Fremling et al. 2016). If we were to power the LCs of our SNe in the same way we would need more radioactive material. Assuming for example that we just missed the diffusion peaks of the SNe, we can match their LCs to that of iPTF13bvn by shifting them. Matching to the LC at about 50 days would require 0.2 and 0.6 M⊙ of 56Ni, respectively, for the two SNe, but the SN LCs could also have been affected by CSM powering already on the initial fading part.
In some sense, the interpretation of SN 2019oys in terms of CSM interaction as provided here puts it in the family of well explored SNe such as SNe 2015ip and 1988Z, and the formation of the coronal lines and the luminosity of the LC can be understood in that context. However, this leaves open several fundamental questions, since SN 2019oys was not the explosion of a hydrogen-rich progenitor forming a Type II SN. Instead it was initially classified as a Type Ib, which is more similar to for example SN 2014C. Milisavljevic et al. (2015) discussed three different scenarios for the origin of such a CSM; a brief Wolf-Rayet phase, eruptive ejection or confinement of CSM by surrounding stars. There is now ample evidence that CC SN progenitors often experience large eruptive ejections close to the time of core collapse, a phenomenon that has been anticipated, but for rather special cases (Woosley et al. 2007). There are many similarities between SN 2014C and SN 2019oys – like the coronal line spectrum and the FWHM of the intermediate width lines (∼1500 km s−1). SN 2014C also displayed strong radio emission picked up by AMI-LA (Anderson et al. 2017), even if the emission from SN 2019oys was 10 times brighter and still rising at 200 days when we obtained our latest radio observation. We also note the difference in that SN 2014C showed a nebular spectrum with sawtooth shaped broad emission lines from the underlying ejecta, which is less obvious in the narrow line dominated spectrum of SN 2019oys. Investigating more of these systems will help us understand why some stripped stars engage in CSM interaction (while most do not) and why some reveal this conspicuously as did SN 2019oys, whereas others, like SN 2019tsf only provide a LC bump with no spectral CSM interaction signatures.
Acknowledgments
We thank Brad Cenko for guidance on the Swift data. David Titterington helped with AMI data and made corrections to the manuscript. Based on observations obtained with the Samuel Oschin Telescope 48-inch and the 60-inch Telescope at the Palomar Observatory as part of the Zwicky Transient Facility project. ZTF is supported by the National Science Foundation under Grant No. AST-1440341 and a collaboration including Caltech, IPAC, the Weizmann Institute for Science, the Oskar Klein Center at Stockholm University, the University of Maryland, the University of Washington, Deutsches Elektronen- Synchrotron and Humboldt University, Los Alamos National Laboratories, the TANGO Consortium of Taiwan, the University of Wisconsin at Milwaukee, and Lawrence Berkeley National Laboratories. Operations are conducted by COO, IPAC, and UW. This work was supported by the GROWTH project (Kasliwal et al. 2019) funded by the National Science Foundation under PIRE Grant No 1545949. The Oskar Klein Centre was funded by the Swedish Research Council. Gravitational Radiation and Electromagnetic Astrophysical Transients (GREAT) is funded by the Swedish Research council (VR) under Dnr 2016-06012. CF is supported by the Swedish Research Council and Swedish National Space Board. Partially based on observations made with the Nordic Optical Telescope, operated by the Nordic Optical Telescope Scientific Association at the Observatorio del Roque de los Muchachos, La Palma, Spain, of the Instituto de Astrofisica de Canarias. Some of the data presented here were obtained with ALFOSC. Some of the data presented herein were obtained at the W. M. Keck Observatory, which is operated as a scientific partnership among the California Institute of Technology, the University of California, and NASA; the observatory was made possible by the generous financial support of the W. M. Keck Foundation. This paper is partly based on observations made with the Italian Telescopio Nazionale Galileo (TNG) operated on the island of La Palma by the Fundación Galileo Galilei of the INAF (Istituto Nazionale di Astrofisica) at the Spanish Observatorio del Roque de los Muchachos of the Instituto de Astrofisica de Canarias. The SED Machine is based upon work supported by the National Science Foundation under Grant No. 1106171. We thank the staff of the Mullard Radio Astronomy Observatory, University of Cambridge, for their support in the maintenance, and operation of AMI. We acknowledge support from the European Research Council under grant ERC-2012-StG-307215 LODESTONE. A.H. is grateful for the support by grants from the Israel Science Foundation, the US-Israel Binational Science Foundation, and the I-CORE Program of the Planning and Budgeting Committee and the Israel Science Foundation. We thank the referee for suggestions for how to improve Figs. 4 and 5.
References
- Ahn, C. P., Alexandroff, R., Allende Prieto, C., et al. 2014, ApJS, 211, 17 [NASA ADS] [CrossRef] [Google Scholar]
- Anderson, G. E., Horesh, A., Mooley, K. P., et al. 2017, MNRAS, 466, 3648 [CrossRef] [Google Scholar]
- Andrews, J. E., & Smith, N. 2018, MNRAS, 477, 74 [NASA ADS] [CrossRef] [Google Scholar]
- Arcavi, I., Howell, D. A., Kasen, D., et al. 2017, Nature, 551, 210 [NASA ADS] [CrossRef] [Google Scholar]
- Bellm, E. C., Kulkarni, S. R., Graham, M. J., et al. 2019, PASP, 131, 018002 [NASA ADS] [CrossRef] [Google Scholar]
- Blagorodnova, N., Neill, J. D., Walters, R., et al. 2018, PASP, 130, 035003 [NASA ADS] [CrossRef] [Google Scholar]
- Blondin, S., & Tonry, J. L. 2007, ApJ, 666, 1024 [NASA ADS] [CrossRef] [Google Scholar]
- Bowen, I. S. 1947, PASP, 59, 196 [NASA ADS] [CrossRef] [Google Scholar]
- Burrows, D. N., Hill, J. E., Nousek, J. A., et al. 2005, Space Sci. Rev., 120, 165 [NASA ADS] [CrossRef] [Google Scholar]
- Cano, Z. 2013, MNRAS, 434, 1098 [NASA ADS] [CrossRef] [Google Scholar]
- Cardelli, J. A., Clayton, G. C., & Mathis, J. S. 1989, ApJ, 345, 245 [NASA ADS] [CrossRef] [Google Scholar]
- Cenko, S. B., Fox, D. B., Moon, D.-S., et al. 2006, PASP, 118, 1396 [NASA ADS] [CrossRef] [Google Scholar]
- Chandra, P., Chevalier, R. A., Chugai, N., Milisavljevic, D., & Fransson, C. 2020, ApJ, 902, 55 [CrossRef] [Google Scholar]
- Chatzopoulos, E., Wheeler, J. C., & Vinko, J. 2012, ApJ, 746, 121 [NASA ADS] [CrossRef] [Google Scholar]
- Chatzopoulos, E., Wheeler, J. C., Vinko, J., Horvath, Z. L., & Nagy, A. 2013, ApJ, 773, 76 [NASA ADS] [CrossRef] [Google Scholar]
- Chen, T. W., Inserra, C., Fraser, M., et al. 2018, ApJ, 867, L31 [NASA ADS] [CrossRef] [Google Scholar]
- Chevalier, R. A., & Fransson, C. 2017, in Thermal and Non-thermal Emission from Circumstellar Interaction, eds. A. W. Alsabti, & P. Murdin, 875 [Google Scholar]
- Chugai, N. N., & Chevalier, R. A. 2006, ApJ, 641, 1051 [NASA ADS] [CrossRef] [Google Scholar]
- De, K., Kasliwal, M. M., Ofek, E. O., et al. 2018, Science, 362, 201 [NASA ADS] [CrossRef] [Google Scholar]
- Dekany, R., Smith, R. M., Riddle, R., et al. 2020, PASP, 132, 038001 [CrossRef] [Google Scholar]
- Dessart, L., & Hillier, D. J. 2005, A&A, 439, 671 [NASA ADS] [CrossRef] [EDP Sciences] [Google Scholar]
- Ergon, M., Sollerman, J., Fraser, M., et al. 2014, A&A, 562, A17 [NASA ADS] [CrossRef] [EDP Sciences] [Google Scholar]
- Ergon, M., Jerkstrand, A., Sollerman, J., et al. 2015, A&A, 580, A142 [NASA ADS] [CrossRef] [EDP Sciences] [Google Scholar]
- Evans, P. A., Beardmore, A. P., Page, K. L., et al. 2009, MNRAS, 397, 1177 [NASA ADS] [CrossRef] [Google Scholar]
- Fox, O. D., Fransson, C., Smith, N., et al. 2020, MNRAS, 498, 517 [CrossRef] [Google Scholar]
- Fransson, C., Chevalier, R. A., Filippenko, A. V., et al. 2002, ApJ, 572, 350 [NASA ADS] [CrossRef] [Google Scholar]
- Fransson, C., Challis, P. M., Chevalier, R. A., et al. 2005, ApJ, 622, 991 [NASA ADS] [CrossRef] [Google Scholar]
- Fransson, C., Ergon, M., Challis, P. J., et al. 2014, ApJ, 797, 118 [NASA ADS] [CrossRef] [Google Scholar]
- Fremling, C., Sollerman, J., Taddia, F., et al. 2016, A&A, 593, A68 [NASA ADS] [CrossRef] [EDP Sciences] [Google Scholar]
- Fremling, C., Ko, H., Dugas, A., et al. 2019, ApJ, 878, L5 [NASA ADS] [CrossRef] [Google Scholar]
- Gal-Yam, A., Arcavi, I., Ofek, E. O., et al. 2014, Nature, 509, 471 [NASA ADS] [CrossRef] [Google Scholar]
- Gehrels, N., Chincarini, G., Giommi, P., et al. 2004, ApJ, 611, 1005 [NASA ADS] [CrossRef] [Google Scholar]
- Graham, M. J., Kulkarni, S. R., Bellm, E. C., et al. 2019, PASP, 131, 078001 [NASA ADS] [CrossRef] [Google Scholar]
- Groh, J. H., Meynet, G., Georgy, C., & Ekström, S. 2013, A&A, 558, A131 [NASA ADS] [CrossRef] [EDP Sciences] [Google Scholar]
- HI4PI Collaboration (Ben Bekhti, N., et al.) 2016, A&A, 594, A116 [NASA ADS] [CrossRef] [EDP Sciences] [Google Scholar]
- Hickish, J., Razavi-Ghods, N., Perrott, Y. C., et al. 2018, MNRAS, 475, 5677 [CrossRef] [Google Scholar]
- Hodgkin, S. T., Breedt, E., Delgado, A., et al. 2019, Transient Name Server Discovery Rep., 2019-2225, 1 [Google Scholar]
- Houck, J. C., & Fransson, C. 1996, ApJ, 456, 811 [NASA ADS] [CrossRef] [Google Scholar]
- Huang, C., & Chevalier, R. A. 2018, MNRAS, 475, 1261 [NASA ADS] [CrossRef] [Google Scholar]
- Johansson, S., & Jordan, C. 1984, MNRAS, 210, 239 [NASA ADS] [Google Scholar]
- Kasliwal, M. M., Cannella, C., Bagdasaryan, A., et al. 2019, PASP, 131, 038003 [NASA ADS] [CrossRef] [Google Scholar]
- Kuncarayakti, H., Maeda, K., Ashall, C. J., et al. 2018, ApJ, 854, L14 [NASA ADS] [CrossRef] [Google Scholar]
- Lyman, J. D., Bersier, D., James, P. A., et al. 2016, MNRAS, 457, 328 [NASA ADS] [CrossRef] [Google Scholar]
- Malesani, D., Fynbo, J. P. U., Hjorth, J., et al. 2009, ApJ, 692, L84 [NASA ADS] [CrossRef] [Google Scholar]
- Malesani, D. B., Charalampopoulos, P., Angus, C., Izzo, L., & Yaron, O. 2019, Transient Name Server Classif. Rep., 2019–2284, 1 [Google Scholar]
- Masci, F. J., Laher, R. R., Rusholme, B., et al. 2019, PASP, 131, 018003 [NASA ADS] [CrossRef] [Google Scholar]
- Matheson, T., Filippenko, A. V., Ho, L. C., Barth, A. J., & Leonard, D. C. 2000, AJ, 120, 1499 [NASA ADS] [CrossRef] [Google Scholar]
- Maund, J. R., & Smartt, S. J. 2009, Science, 324, 486 [NASA ADS] [PubMed] [Google Scholar]
- Mazzali, P. A., Sullivan, M., Pian, E., Greiner, J., & Kann, D. A. 2016, MNRAS, 458, 3455 [NASA ADS] [CrossRef] [Google Scholar]
- Milisavljevic, D., Margutti, R., Kamble, A., et al. 2015, ApJ, 815, 120 [NASA ADS] [CrossRef] [Google Scholar]
- Modjaz, M., Li, W., Butler, N., et al. 2009, ApJ, 702, 226 [NASA ADS] [CrossRef] [Google Scholar]
- Nomoto, K., Suzuki, T., Shigeyama, T., et al. 1993, Nature, 364, 507 [NASA ADS] [CrossRef] [Google Scholar]
- Oke, J. B., Cohen, J. G., Carr, M., et al. 1994, in Instrumentation in Astronomy VIII, eds. D. L. Crawford, E. R. Craine, et al., SPIE Conf. Ser., 2198, 178 [CrossRef] [Google Scholar]
- Perley, D. A. 2019, PASP, 131, 084503 [CrossRef] [Google Scholar]
- Prentice, S. J., Ashall, C., James, P. A., et al. 2019, MNRAS, 485, 1559 [NASA ADS] [CrossRef] [Google Scholar]
- Rigault, M., Neill, J. D., Blagorodnova, N., et al. 2019, A&A, 627, A115 [CrossRef] [EDP Sciences] [Google Scholar]
- Roming, P. W. A., Kennedy, T. E., Mason, K. O., et al. 2005, Space Sci. Rev., 120, 95 [NASA ADS] [CrossRef] [Google Scholar]
- Schlafly, E. F., & Finkbeiner, D. P. 2011, ApJ, 737, 103 [NASA ADS] [CrossRef] [Google Scholar]
- Shivvers, I., Filippenko, A. V., Silverman, J. M., et al. 2019, MNRAS, 482, 1545 [CrossRef] [Google Scholar]
- Sigut, T. A. A., & Pradhan, A. K. 1998, ApJ, 499, L139 [NASA ADS] [CrossRef] [Google Scholar]
- Sigut, T. A. A., & Pradhan, A. K. 2003, ApJS, 145, 15 [NASA ADS] [CrossRef] [Google Scholar]
- Smith, N. 2014, ARA&A, 52, 487 [NASA ADS] [CrossRef] [MathSciNet] [Google Scholar]
- Smith, N., Silverman, J. M., Chornock, R., et al. 2009, ApJ, 695, 1334 [NASA ADS] [CrossRef] [Google Scholar]
- Sollerman, J., Taddia, F., Arcavi, I., et al. 2019, A&A, 621, A30 [NASA ADS] [CrossRef] [EDP Sciences] [Google Scholar]
- Springob, C. M., Magoulas, C., Colless, M., et al. 2014, MNRAS, 445, 2677 [CrossRef] [Google Scholar]
- Stritzinger, M., Taddia, F., Fransson, C., et al. 2012, ApJ, 756, 173 [NASA ADS] [CrossRef] [Google Scholar]
- Sun, N.-C., Maund, J. R., & Crowther, P. A. 2020, MNRAS, 497, 5118 [CrossRef] [Google Scholar]
- Taddia, F., Fremling, C., Sollerman, J., et al. 2016, A&A, 592, A89 [NASA ADS] [CrossRef] [EDP Sciences] [Google Scholar]
- Taddia, F., Sollerman, J., Leloudas, G., et al. 2015, A&A, 574, A60 [NASA ADS] [CrossRef] [EDP Sciences] [Google Scholar]
- Taddia, F., Stritzinger, M. D., Bersten, M., et al. 2018, A&A, 609, A136 [NASA ADS] [CrossRef] [EDP Sciences] [Google Scholar]
- Tartaglia, L., Sollerman, J., Barbarino, C., et al. 2020, A&A, submitted, [arXiv:2009.03331] [Google Scholar]
- Woosley, S. E., Blinnikov, S., & Heger, A. 2007, Nature, 450, 390 [NASA ADS] [CrossRef] [PubMed] [Google Scholar]
- Yan, L., Lunnan, R., Perley, D. A., et al. 2017, ApJ, 848, 6 [NASA ADS] [CrossRef] [Google Scholar]
- Yaron, O., & Gal-Yam, A. 2012, PASP, 124, 668 [NASA ADS] [CrossRef] [Google Scholar]
- Yoon, S.-C. 2015, PASA, 32, 15 [NASA ADS] [CrossRef] [Google Scholar]
- Zwart, J. T. L., Barker, R. W., Biddulph, P., et al. 2008, MNRAS, 391, 1545 [NASA ADS] [CrossRef] [Google Scholar]
All Tables
All Figures
|
Fig. 1. Light curves of SN 2019oys (left) and SN 2019tsf (right) in g (green symbols) and r (red) band. These are observed (AB) magnitudes plotted versus observer frame time in days since first detection. Both these Type Ib SNe showed a dramatic increase in brightness after months of decline, and in the case of SN 2019oys that re-brightening continued over more than 100 days. The arrows on top indicate the epochs of spectroscopy, and the lines with error regions are Gaussian Process estimates of the interpolated LC, which were used to absolute calibrate the spectra. |
| In the text | |
|
Fig. 2. Radio light curve of SN 2019oys at 15.5 GHz as observed with AMI-LA. The inset in the lower right shows the radio image from March 6, 2020, when the SN was detected at a level of 9 mJy. Fluxes are provided in Table 2. |
| In the text | |
|
Fig. 3. Light curves in absolute r-band magnitude (Mr) for our two supernovae. This accounts for distance modulus and MW extinction as discussed in the text, but no additional corrections for host extinction. In addition we have plotted the Type Ibn SN iPTF13bvn (Fremling et al. 2016), which is a typical radioactively powered SE SN. This SN was shifted in time to match the peak to the discovery dates of our SNe. The photometry has been binned to nightly averages. |
| In the text | |
|
Fig. 4. Spectral sequence of SN 2019tsf demonstrating that the spectral evolution is quite slow. We show a selection of the spectra listed in Table 1. Phases given in rest-frame days are provided for each spectrum. The uppermost spectrum (in red) is of the Type Ib SN 2008D obtained 6 days past maximum light from Malesani et al. (2009). This gives the best match of the classification spectrum using SNID. The spectra obtained at ∼100 days when the SN was re-brightening are still quite similar to the typical Type Ib SN spectrum obtained close after discovery. The third to last spectrum (in blue) is of the Type Ib SN 2019vsi about 80 days past discovery, and shows great similarity with the spectra of SN 2019tsf. In addition, and as a an example of a more normal late time spectrum we also show SN 2008D at t = 132 d presented in Modjaz et al. (2009). SE SNe at these epochs are typically dominated by forbidden emission lines of Mg I], [O I], and [Ca II]. No signs of narrow lines or other features signaling CSM interaction can be found in the spectra of SN 2019tsf, in stark contrast to the case of SN 2019oys. The spectra are normalized and offset for clarity. All data will be made available via WISEREP. |
| In the text | |
|
Fig. 5. Spectral sequence of SN 2019oys showing an abrupt change from the very first Type Ib spectrum obtain by the P60, to the later spectra acquired once the LC started to brighten. These latter spectra show clear evidence for CSM interaction as evidenced by the dominance of the narrow emission lines. We show a selection of the spectra listed in Table 1 for this SN. Phases in rest-frame days are provided for each spectrum. The third spectrum from the top is of the Type Ib SN 2008D (Malesani et al. 2009) at 30 days past maximum light (red), which gives the best match to our classification spectrum using SNID. In addition, we compare to the +1 days spectrum of SN 2001em from Shivvers et al. (2019; green). The spectra obtained at ≳150 days when the SN was re-brightening are quite similar to the spectra of the Type IIn SN 2015ip and this is highlighted in Fig. 6. |
| In the text | |
|
Fig. 6. Spectral sequence of SN 2019oys during re-brightening. A handful of the spectra listed in Table 1 are shown, and here on a logarithmic scale to highlight the bright narrow emission lines. Phases in rest-frame days are provided for each spectrum. A spectrum of the Type IIn SN 2015ip is shown for comparison (in red). This spectrum is from Stritzinger et al. (2012) taken at 138 days past discovery. Basically all high excitation coronal lines seen in SN 2005ip are also detected in SN 2019oys, a main difference being that our SN do not display the broad Hα line from hydrogen-rich ejecta. The spectra are normalized and offset for clarity. |
| In the text | |
|
Fig. 7. Line identifications of the reddening corrected, merged spectrum of SN 2019oys from days 172 and 204. The narrow high-ionization lines are marked at the top. The H I and He I lines are marked with red and blue lines, respectively. |
| In the text | |
|
Fig. 8. Synthetic spectrum (magenta) together with the reddening corrected, merged spectrum of SN 2019oys from days 172 and 204 (blue) with line identifications. The assumed blackbody continuum is shown as the dashed cyan line. The red marks at the bottom indicates the forest of Fe II lines with heights reflecting the relative intensities adopted from Sigut & Pradhan (2003). These provide indications for where to expect contribution from iron lines, and which regions are not expected to be contaminated by such emission. |
| In the text | |
Current usage metrics show cumulative count of Article Views (full-text article views including HTML views, PDF and ePub downloads, according to the available data) and Abstracts Views on Vision4Press platform.
Data correspond to usage on the plateform after 2015. The current usage metrics is available 48-96 hours after online publication and is updated daily on week days.
Initial download of the metrics may take a while.