Fig. 6.
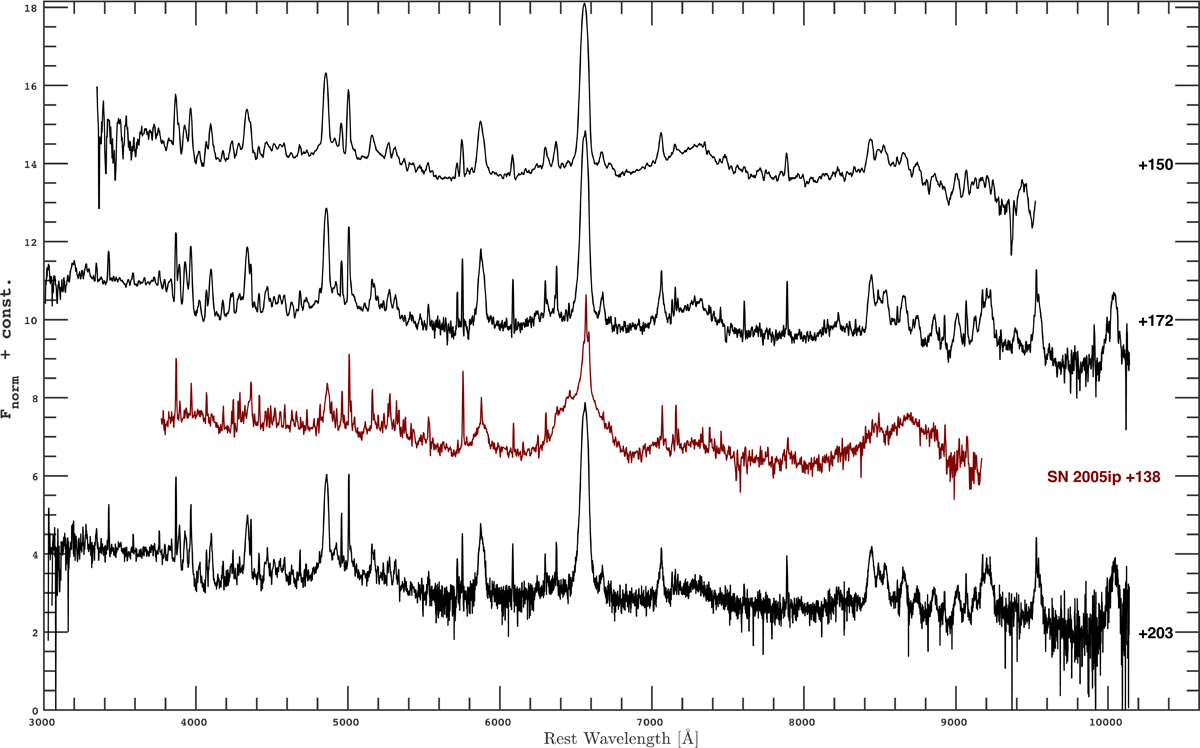
Spectral sequence of SN 2019oys during re-brightening. A handful of the spectra listed in Table 1 are shown, and here on a logarithmic scale to highlight the bright narrow emission lines. Phases in rest-frame days are provided for each spectrum. A spectrum of the Type IIn SN 2015ip is shown for comparison (in red). This spectrum is from Stritzinger et al. (2012) taken at 138 days past discovery. Basically all high excitation coronal lines seen in SN 2005ip are also detected in SN 2019oys, a main difference being that our SN do not display the broad Hα line from hydrogen-rich ejecta. The spectra are normalized and offset for clarity.
Current usage metrics show cumulative count of Article Views (full-text article views including HTML views, PDF and ePub downloads, according to the available data) and Abstracts Views on Vision4Press platform.
Data correspond to usage on the plateform after 2015. The current usage metrics is available 48-96 hours after online publication and is updated daily on week days.
Initial download of the metrics may take a while.