Fig. 5.
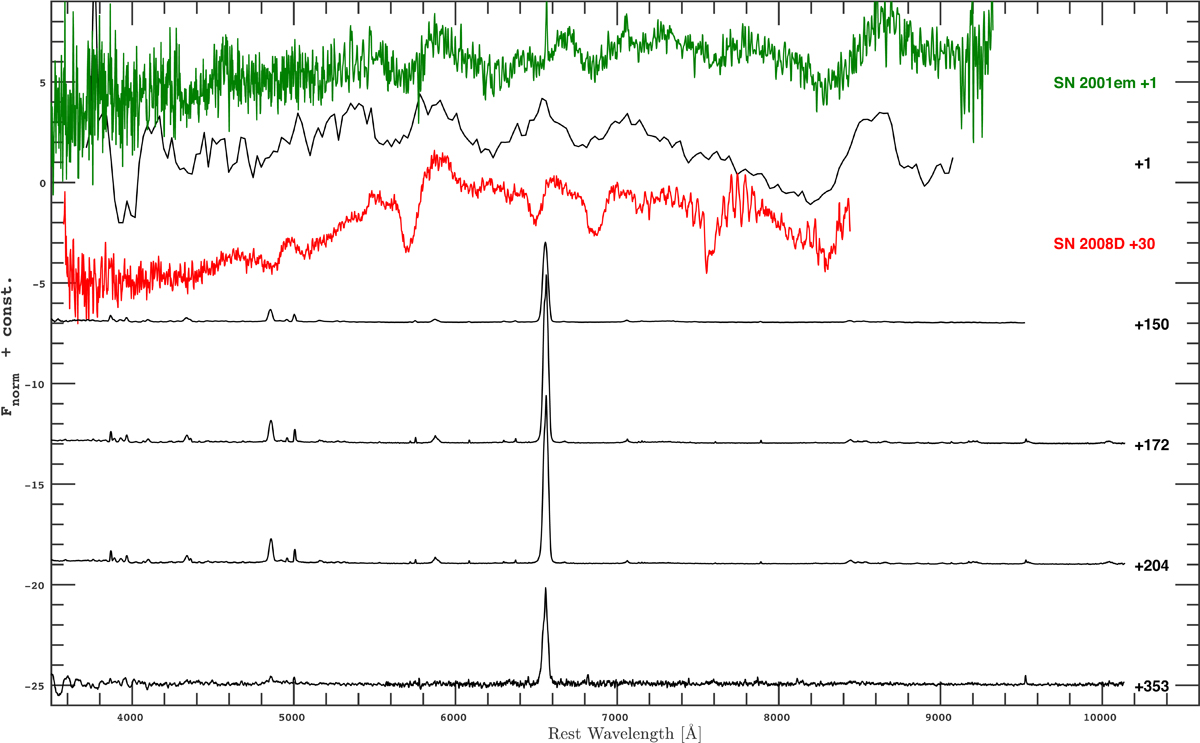
Spectral sequence of SN 2019oys showing an abrupt change from the very first Type Ib spectrum obtain by the P60, to the later spectra acquired once the LC started to brighten. These latter spectra show clear evidence for CSM interaction as evidenced by the dominance of the narrow emission lines. We show a selection of the spectra listed in Table 1 for this SN. Phases in rest-frame days are provided for each spectrum. The third spectrum from the top is of the Type Ib SN 2008D (Malesani et al. 2009) at 30 days past maximum light (red), which gives the best match to our classification spectrum using SNID. In addition, we compare to the +1 days spectrum of SN 2001em from Shivvers et al. (2019; green). The spectra obtained at ≳150 days when the SN was re-brightening are quite similar to the spectra of the Type IIn SN 2015ip and this is highlighted in Fig. 6.
Current usage metrics show cumulative count of Article Views (full-text article views including HTML views, PDF and ePub downloads, according to the available data) and Abstracts Views on Vision4Press platform.
Data correspond to usage on the plateform after 2015. The current usage metrics is available 48-96 hours after online publication and is updated daily on week days.
Initial download of the metrics may take a while.