Fig. 4.
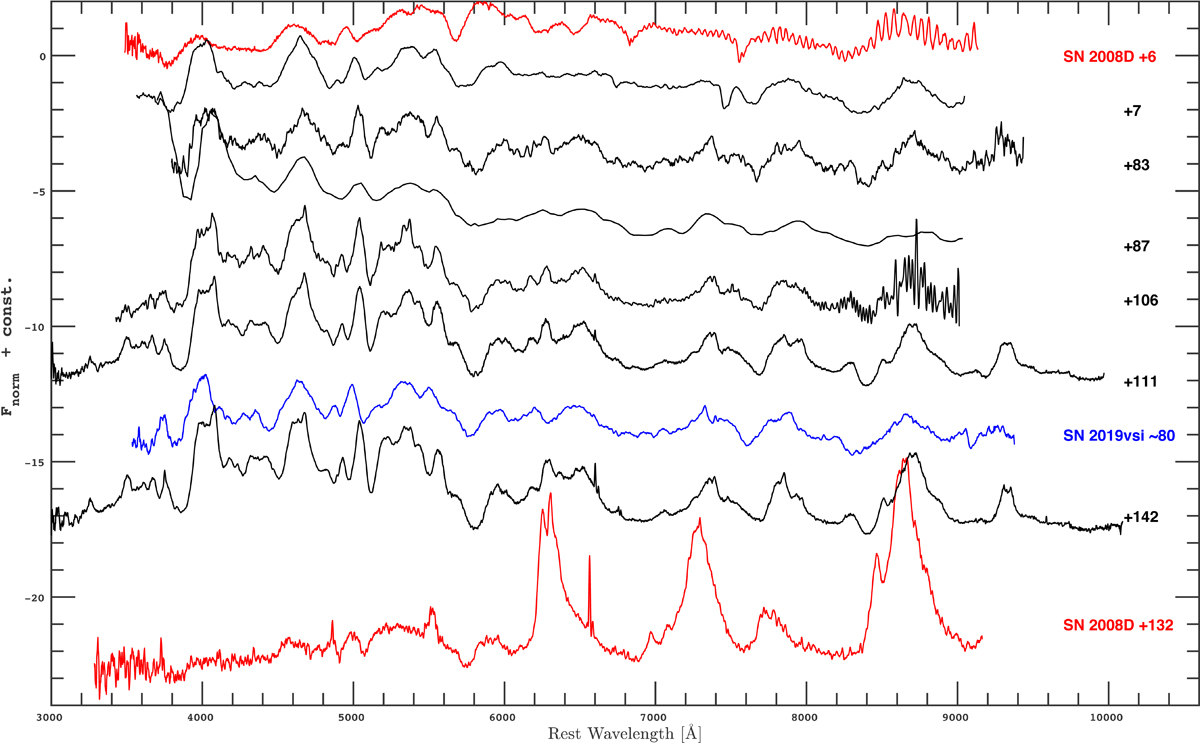
Spectral sequence of SN 2019tsf demonstrating that the spectral evolution is quite slow. We show a selection of the spectra listed in Table 1. Phases given in rest-frame days are provided for each spectrum. The uppermost spectrum (in red) is of the Type Ib SN 2008D obtained 6 days past maximum light from Malesani et al. (2009). This gives the best match of the classification spectrum using SNID. The spectra obtained at ∼100 days when the SN was re-brightening are still quite similar to the typical Type Ib SN spectrum obtained close after discovery. The third to last spectrum (in blue) is of the Type Ib SN 2019vsi about 80 days past discovery, and shows great similarity with the spectra of SN 2019tsf. In addition, and as a an example of a more normal late time spectrum we also show SN 2008D at t = 132 d presented in Modjaz et al. (2009). SE SNe at these epochs are typically dominated by forbidden emission lines of Mg I], [O I], and [Ca II]. No signs of narrow lines or other features signaling CSM interaction can be found in the spectra of SN 2019tsf, in stark contrast to the case of SN 2019oys. The spectra are normalized and offset for clarity. All data will be made available via WISEREP.
Current usage metrics show cumulative count of Article Views (full-text article views including HTML views, PDF and ePub downloads, according to the available data) and Abstracts Views on Vision4Press platform.
Data correspond to usage on the plateform after 2015. The current usage metrics is available 48-96 hours after online publication and is updated daily on week days.
Initial download of the metrics may take a while.