Fig. 8.
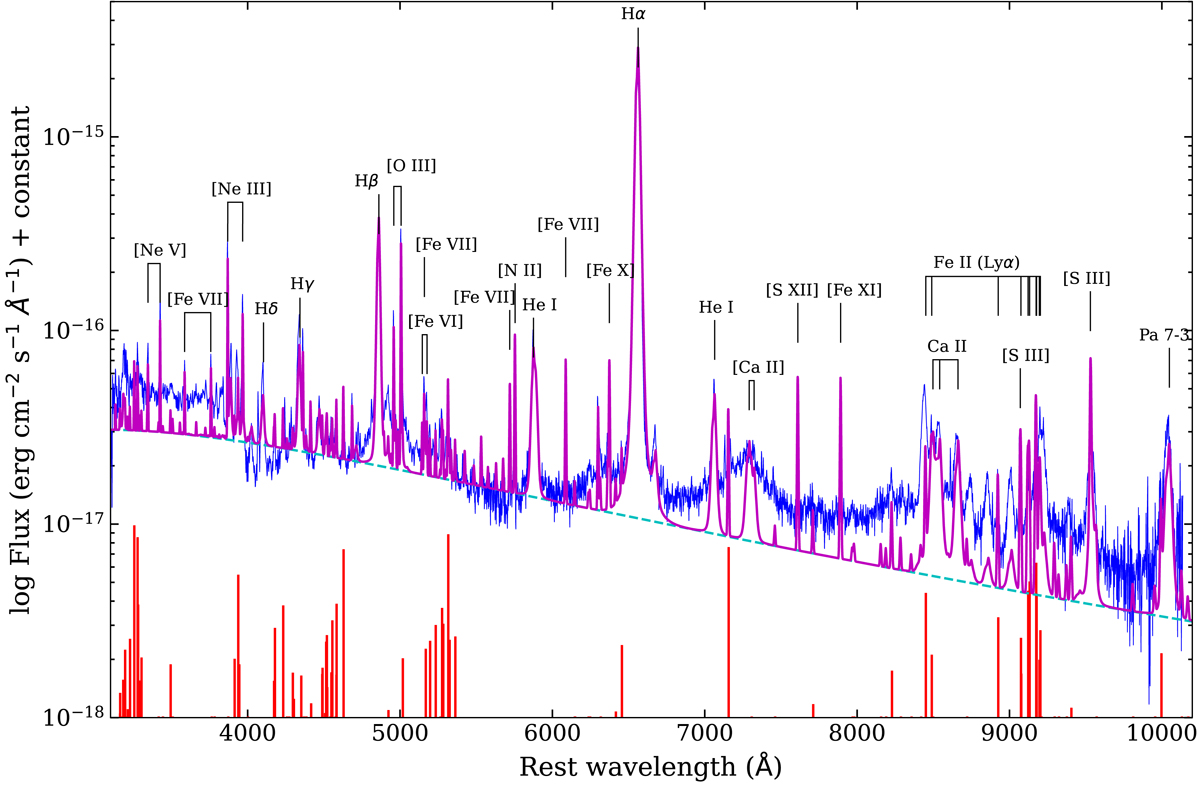
Synthetic spectrum (magenta) together with the reddening corrected, merged spectrum of SN 2019oys from days 172 and 204 (blue) with line identifications. The assumed blackbody continuum is shown as the dashed cyan line. The red marks at the bottom indicates the forest of Fe II lines with heights reflecting the relative intensities adopted from Sigut & Pradhan (2003). These provide indications for where to expect contribution from iron lines, and which regions are not expected to be contaminated by such emission.
Current usage metrics show cumulative count of Article Views (full-text article views including HTML views, PDF and ePub downloads, according to the available data) and Abstracts Views on Vision4Press platform.
Data correspond to usage on the plateform after 2015. The current usage metrics is available 48-96 hours after online publication and is updated daily on week days.
Initial download of the metrics may take a while.