Free Access
Fig. 2.
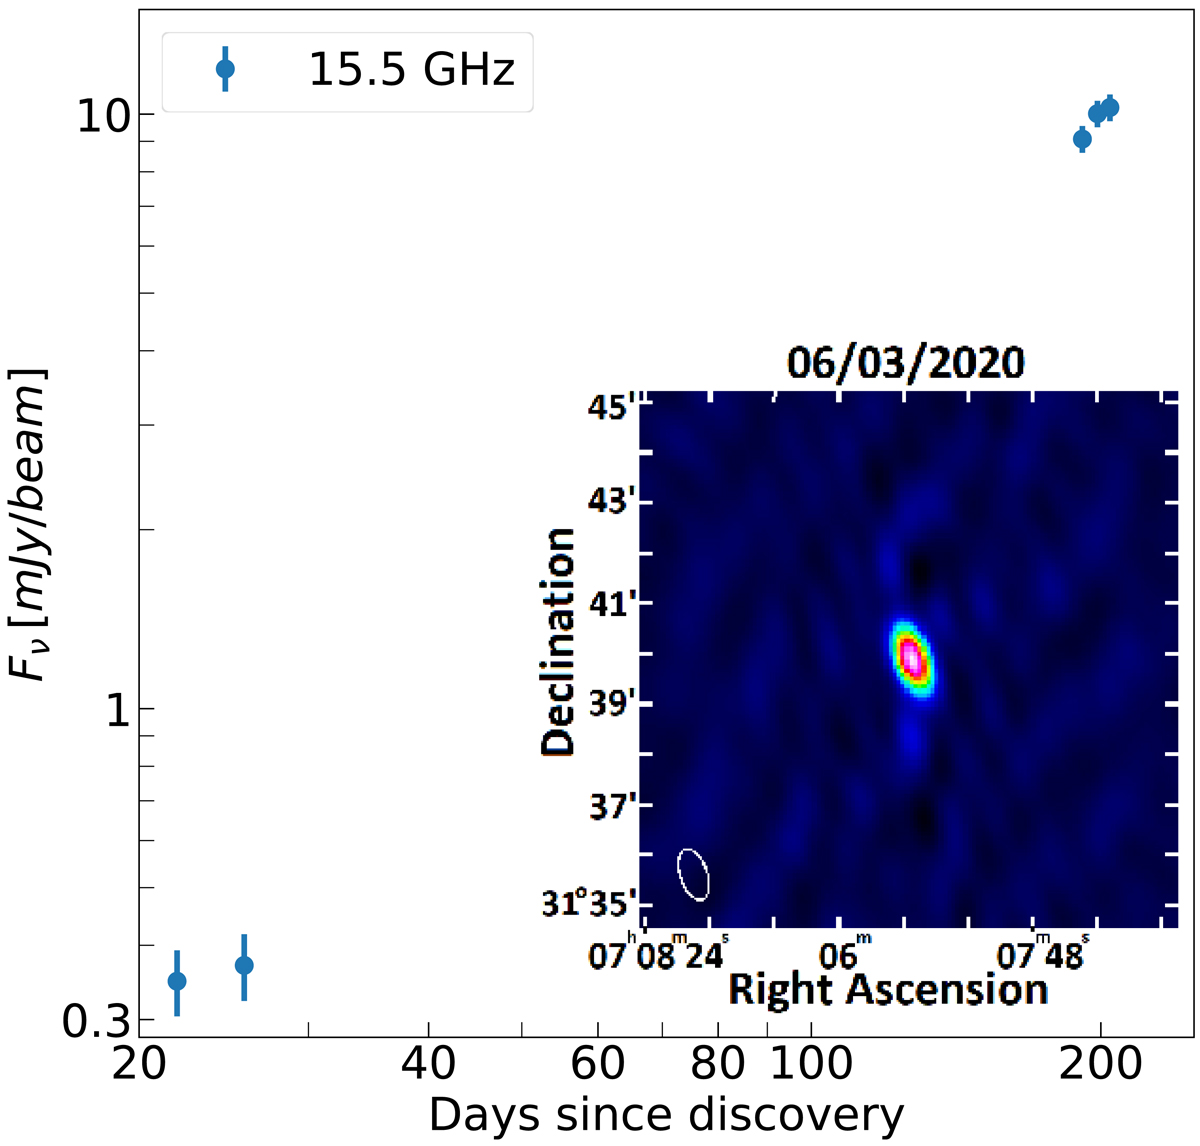
Radio light curve of SN 2019oys at 15.5 GHz as observed with AMI-LA. The inset in the lower right shows the radio image from March 6, 2020, when the SN was detected at a level of 9 mJy. Fluxes are provided in Table 2.
Current usage metrics show cumulative count of Article Views (full-text article views including HTML views, PDF and ePub downloads, according to the available data) and Abstracts Views on Vision4Press platform.
Data correspond to usage on the plateform after 2015. The current usage metrics is available 48-96 hours after online publication and is updated daily on week days.
Initial download of the metrics may take a while.