Fig. 1.
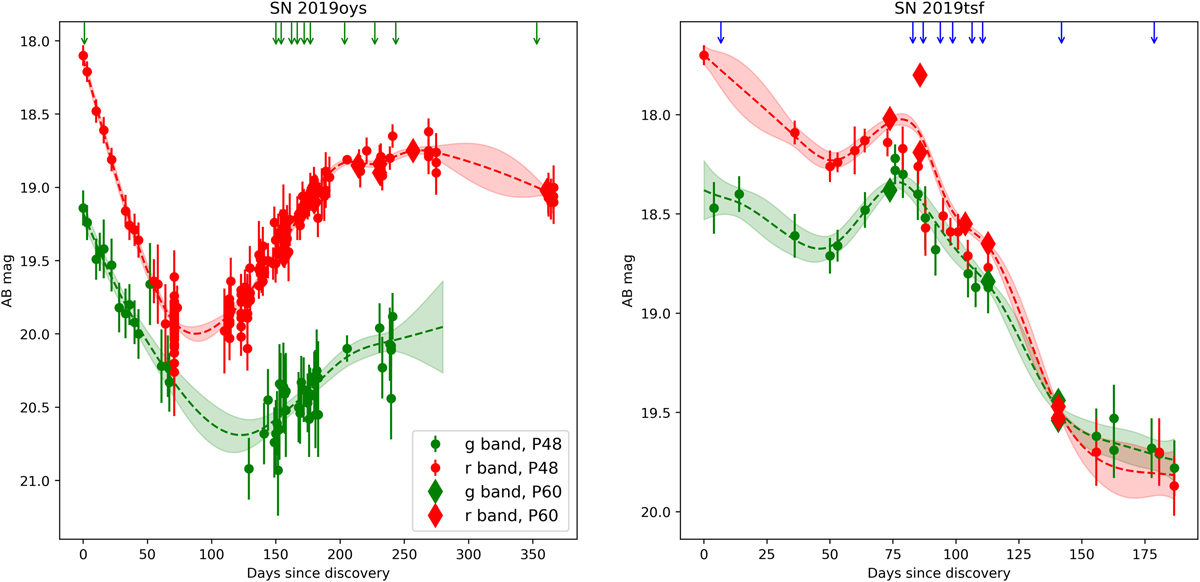
Light curves of SN 2019oys (left) and SN 2019tsf (right) in g (green symbols) and r (red) band. These are observed (AB) magnitudes plotted versus observer frame time in days since first detection. Both these Type Ib SNe showed a dramatic increase in brightness after months of decline, and in the case of SN 2019oys that re-brightening continued over more than 100 days. The arrows on top indicate the epochs of spectroscopy, and the lines with error regions are Gaussian Process estimates of the interpolated LC, which were used to absolute calibrate the spectra.
Current usage metrics show cumulative count of Article Views (full-text article views including HTML views, PDF and ePub downloads, according to the available data) and Abstracts Views on Vision4Press platform.
Data correspond to usage on the plateform after 2015. The current usage metrics is available 48-96 hours after online publication and is updated daily on week days.
Initial download of the metrics may take a while.