| Issue |
A&A
Volume 620, December 2018
|
|
|---|---|---|
| Article Number | A30 | |
| Number of page(s) | 26 | |
| Section | Interstellar and circumstellar matter | |
| DOI | https://doi.org/10.1051/0004-6361/201832954 | |
| Published online | 23 November 2018 | |
Role of environment and gas temperature in the formation of multiple protostellar systems: molecular tracers★
1
Leiden Observatory, Leiden University,
PO Box 9513,
2300 RA,
Leiden, The Netherlands
e-mail: nmurillo@strw.leidenuniv.nl
2
Max-Planck-Institut für extraterrestrische Physik,
Giessenbachstraße 1,
85748,
Garching bei München, Germany
3
Homer L. Dodge Department of Physics and Astronomy, University of Oklahoma,
440 W. Brooks Street, Norman,
Oklahoma
73019, USA
4
Max Planck Institute for Astronomy,
Königstuhl 17,
69117
Heidelberg, Germany
5
Centre for Astronomy, Nicolaus Copernicus University, Faculty of Physics, Astronomy and Informatics,
Grudziadzka 5,
87100
Torun, Poland
Received:
5
March
2018
Accepted:
12
September
2018
Context. Simulations suggest that gas heating due to radiative feedback is a key factor in whether or not multiple protostellar systems will form. Chemistry is a good tracer of the physical structure of a protostellar system, since it depends on the temperature structure.
Aims. We aim to study the relationship between envelope gas temperature and protostellar multiplicity.
Methods. Single dish observations of various molecules that trace the cold, warm, and UV-irradiated gas were used to probe the temperature structure of multiple and single protostellar systems on 7000 AU scales.
Results. Single, close binary, and wide multiples present similar current envelope gas temperatures, as estimated from H2CO and DCO+ line ratios. The temperature of the outflow cavity, traced by c-C3H2, on the other hand, shows a relation with bolometric luminosity and an anticorrelation with envelope mass. Although the envelope gas temperatures are similar for all objects surveyed, wide multiples tend to exhibit a more massive reservoir of cold gas compared to close binary and single protostars.
Conclusions. Although the sample of protostellar systems is small, the results suggest that gas temperature may not have a strong impact on fragmentation. We propose that mass, and density, may instead be key factors in fragmentation.
Key words: astrochemistry / stars: formation / stars: low-mass / ISM: molecules / methods: observational
The reduced spectra are only available at the CDS via anonymous ftp to cdsarc.u-strasbg.fr (130.79.128.5) or via http://cdsarc.u-strasbg.fr/viz-bin/qcat?J/A+A/620/A30
© ESO 2018
1 Introduction
Multiple protostellar systems are widely thought to be formed through fragmentation of the cloud core and/or disk within which they form. This process is expected to either be induced by turbulence (e.g., Offner et al. 2010) or through instabilities in the disk that can lead to fragmentation of the disk material (e.g., Stamatellos & Whitworth 2009; Kratter et al. 2010). Each of these mechanisms are proposed to produce multiple protostellar systems, but since they operate on different spatial scales (disks: ~100 AU vs. cloud core: ~1000 AU) they result in different separations between the sources. Turbulent fragmentation predicts the initial formation of wide companions, whereas disk fragmentation can produce close companions, on scales of the disk radius. The time when these processes occur, upon initial collapse or after one source has formed, can also alter the resulting multiple protostellar system and its evolution. Observational studies of massive star formation provide conflicting evidence regarding the role of turbulence in core fragmentation (e.g., Wang et al. 2014; Palau et al. 2015; Beuther et al. 2018). Another potentially relevant factor in regulating fragmentation may be magnetic support. This mechanism suggests that magnetic fields reduce the number of fragments formed in a cloud core (Commerçon et al. 2010; Hennebelle et al. 2011). Observations of fragmentation in massive dense cloud cores (Tan et al. 2013; Fontani et al. 2018), where both high- and low-mass protostars can form, suggest that magnetic fields can shape the fragment mass and distribution. The role that magnetic support plays in low-mass multiple star formation is not yet entirely understood.
The factors that enhance fragmentation of cloud cores need to be studied in order to understand how multiple protostellar systems form. Radiative feedback and gas heating have been raised as key factors in the fragmentation of protostellar cores (e.g., Krumholz 2006; Bate 2012; Krumholz et al. 2014). Simulations and models show that fragmentation is suppressed by heated gas due to the increase in the thermal Jeans mass needed for collapse. An accreting protostar heats up its surrounding gas, even as early as the first collapse of the core (Boss et al. 2000; Whitehouse & Bate 2006). Thus, it is expected that fragmentation can be considerably suppressed even as the protostellar object forms. Numerical simulations show that as stars begin to form they can heat surrounding gas out to a few thousand AU, with the gas being continuously heated out to larger expanses as more objects form (Bate 2012). This is expected to considerably reduce fragmentation, and consequently the formation of multiple protostellar systems on envelope scales (few thousand AU). Models considering the effect of accretion luminosity on the temperature structure of cloud cores suggest that cores can be heated above 100 K out to a few hundred AU, and 30 K out to a few thousand AU (Krumholz et al. 2014). This is thought to significantly hinder cloud core fragmentation and the consequent formation of multiple stellar systems (Krumholz 2006).
Observations of young low-mass embedded protostellar systems, however, seem to show a different picture. Construction of the SEDs of all known embedded protostellar systems in the Perseus star-forming region (d ~ 235 pc; Hirota et al. 2011) found, for separations larger than 7′′, that higher order multiples have a tendency for one of the sources to be at a different evolutionary stage than the rest, that is non-coeval systems (Murillo et al. 2016). For these non-coeval systems to occur, one of the sources was most likely formed after the other protostars were formed. During the star formation process, episodic accretion bursts produce quiescent phases, lasting on the order of 103−4 yr (Scholz et al. 2013; Visser et al. 2015), which allow enough time for the envelope to cool and thus be more conducive to fragmentation and collapse. However, objects undergoing episodic accretion do not always show multiplicity (e.g., very low luminosity objects, VeLLOs; Hsieh et al. 2018), and not all multiples present signatures of accretion bursts (e.g., Frimann et al. 2017). Furthermore, the recently fragmented circumbinary disk of the deeply embedded protostellar system L1448 N (Tobin et al. 2016a) suggests that instabilities could overcome heating-suppressed fragmentation, since this disk is most certainly heated by both the central binary and through accretion.
Observational evidence for gas and dust heating on scales of a few thousand AU by UV radiation escaping through outflow cavities comes from several lines of evidence. Multiwavelength observations of dust emission around low-mass protostars suggest indeed elevated temperatures out to such distances (e.g., Hatchell et al. 2013; Sicilia-Aguilar et al. 2013). More relevant are measurements of the gas temperature, since at low cloud densities (104 cm−3) gas and dust temperatures may be decoupled (Evans et al. 2001; Galli et al. 2002), and it is the gas temperature that enters the formulation for suppressing fragmentation (Offner et al. 2010). The best diagnostics are the 13CO mid-J lines, especially 13CO J = 6–5, first demonstrated by Spaans et al. (1995) and modeled in detail by Visser et al. (2012). The use of 13CO 6–5 as a temperature probe on extended scales has been quantified observationally by van Kempen et al. (2009) and Yıldız et al. (2013, 2015), showing temperatures of 30–50 K on scales of a few thousand AU.
Relating the temperature structure and multiplicity of a protostellar system can provide constraints on the temperature–fragmentation relation. Simulations including radiative feedback (e.g., Krumholz 2006; Bate 2012) would lead us to expect that non-coeval multiple protostellar systems may form in much colder cloud cores than single and coeval binary protostellar systems, in order to have further fragmentation. Thus, the temperature structure of protostellar systems needs to be characterized in order to test these models. Because heating is time-dependent and we cannot observe the temporal history of protostellar envelope heating, protostellar objects at different evolutionary stages and having recently undergone processes such as accretion bursts and fragmentation need to be studied and compared.
Molecular excitation and chemistry provide an excellent tool to probe the temperature structure of a protostellar system. Using selected molecules that trace the cold and warm envelope gas (e.g., Murillo et al. 2015, 2018), it can be established how the gas heating is being distributed throughout the cloud core. In addition, we use new 13CO 6–5 data combined with existing 13CO 3–2 spectra (Mottram et al. 2017) and 13CO 10–9 spectra from the WILL survey (Mottram et al. 2017), observed with the James Clerk Maxwell Telescope (JCMT) and Herschel Space Observatory (Pilbratt et al. 2010), respectively. Relating this to the multiplicity and coevality1 can then provide information on how temperature affects fragmentation.
This work presents single-dish observations of embedded multiple and single protostellar systems aiming to address the relation between temperature and fragmentation at the envelope scale (~7000 AU). The sample selection criteria for the protostellar systems studied in this work are described in Sect. 2. Section 3 describes the Atacama Pathfinder EXperiment (APEX; Güsten et al. 2006) observations. Results and analysis of the data obtained from the observations are given in Sects. 4 and 5, respectively. Comparison between single and multiple protostellar systems is made in Sect. 6, considering evolutionary stage and whether they are located in a crowded or isolated environment. The conclusions of this work are given in Sect. 7, along with the resulting insight on the temperature–fragmentation relation.
2 System sample
The Perseus molecular cloud (d = 235 pc) large-scale structure has been well studied in continuum (e.g., Hatchell et al. 2005; Enoch et al. 2006; Chen et al. 2016; Pokhrel et al. 2018) and molecular line emission (e.g., Arce et al. 2010; Curtis et al. 2010a,b; Curtis & Richer 2011; Walker-Smith et al. 2014; Hacar et al. 2017). The small-scale structure of the region has been studied through the characterization of individual systems (e.g., Kwon et al. 2006; Enoch et al. 2009; Mottram et al. 2013; Hirano & Liu 2014; Ching et al. 2016). The evolutionary classification of the protostars in the region has been carefully studied through molecular line and continuum observations (Enoch et al. 2009; Carney et al. 2016; Mottram et al. 2017). Recently, Tobin et al. (2016b) conducted an unbiased 8 mm survey of all protostars in Perseus down to 15 AU separation with the Karl G. Jansky Very Large Array (VLA), thus characterizing the multiplicity of the star-forming region.
The evolutionary stages of each source in embedded wide multiple protostellar systems in Perseus have been characterized through the construction of spectral energy distributions (SEDs) and the parameters derived from the SEDs including Herschel Space Observatory PACS maps (Murillo et al. 2016). This provides information on the coevality of wide multiple protostellar systems andcan help to understand how these systems are formed (Murillo et al. 2016). Further examination of coevality, core structure, and protostar distribution was done by Sadavoy & Stahler (2017), studying possible formation mechanisms. Dust emission observed with the VLA toward several disk-candidate embedded protostellar systems wasexamined by Segura-Cox et al. (2016), and the dust continuum was found to present disk-shaped structures. In addition, envelopes and outflows driven by protostars in Perseus have been studied both at scales larger than 4000 AU (Davis et al. 2008; Curtis et al. 2010a,b; Arce et al. 2010; Mottram et al. 2013, 2017; Karska et al. 2014; Yıldız et al. 2015) and below 2000 AU (Persson et al. 2012; Plunkett et al. 2013; Maret et al. 2014; Lee et al. 2016). Together, previous work provides an extensive database of information about the protostars in the Perseus molecular cloud.
For thisstudy, a sample of 12 low-mass protostellar systems in Perseus were selected from the work of Tobin et al. (2016b) and Murillo et al. (2016). The sample is listed in Table 1, along with coordinates, source separations, type of region where they are located, and the bolometric luminosity Lbol calculated from the SEDs. Figure 1 shows Herschel PACS thermal continuum mini-maps of the sample obtained from the Gould Belt Survey (André et al. 2010), along with the constructed SEDs from Murillo et al. (2016). The selected systems are young embedded protostars in the Classes 0 and I evolutionary stages. Both single and multiple (i.e., binary and higher order multiples) protostellar systems are included, with the multiple systems spanning a range of separations from ~0.1′′ to 46′′ (~23.5 to 11 000 AU). Thus, both close and wide multiple protostellar systems are considered in this study. Finally, the systems are located in both clustered (NGC 1333) and non-clustered regions (L1448, L1455 and B1). Selecting systems from both clustered and non-clustered regions (34 and 6 YSO pc−2, respectively; Plunkett et al. 2013) allows the impact of external heating on the measured gas temperatures to be assessed.
This sample then allows the evolutionary stage, multiplicity, and region to be compared with temperature, both from the UV-heated gas and the envelope gas temperature. Since the timescale for protostellar evolution (of order a few ×105 yr; Evans et al. 2009; Mottram et al. 2011; Heiderman & Evans 2015; Carney et al. 2016) is considerably longer than can be observed in human lifespan, the evolution of the protostellar temperature structure cannot be directly observed. Hence, systems in the Classes 0 and I evolutionary stages need to be compared, as well as single and multiple protostellar systems. Evolutionary classes are determined based on the shape of the SED, derived parameters such as bolometric temperature Tbol, and the structure of the system (e.g., envelope, outflow opening angle). Thus, the temperature–multiplicity–age relation can be studied, which can in turn provide constraints for hydrodynamical models with radiative feedback.
Sample of protostellar systems.
3 Observations
3.1 Single pointing
APEX observations of 10 out of 12 systems in our sample were carried out with the Swedish Heterodyne Facility Instrument (SHeFI; Nyström et al. 2009) in position switching mode. The APEX-1 band was used for observations on 1 December 2016 with a precipitable water vapor (PWV) ~1.6 mm (O-098.F-9320B.2016, NL GTO time) using one spectral setting with the central frequency set to 217.11258 GHz and a bandwidth of 4 GHz. This setting targeted the molecules DCO+, DCN, c-C3H2, and H2CO. In addition, transitions of SO and CH3OH were detected. Typical noise levels for the observations ranged between 15 and 70 mK for a channel width of 0.4 km s−1 and a HPBW of 28.7′′. The beam efficiency ηmb for observations at 230 GHz is 0.75.
APEX-2 band observations were carried out from 7 to 12 July 2017 with PWV between 0.37 and 1.5 mm (M-099.F-9516C-2017) using two spectral settings with central frequencies of 350.33746 and 361.16978 GHz, and bandwidth of 4 GHz. The molecules targeted were C2 H, DCO+, DCN, and H2CO. HNC was also detected. Typical noise levels range from 20 to 100 mK for a channel width of 0.4 km s−1, a HPBW of 18′′, and ηmb = 0.73. For both bands, calibration uncertainties are on the order of 20%. The molecules targeted in these observations probe the cold (DCO+, H2 CO 218.222 GHz) and warm (DCN, c-C3H2, C2 H, H2 CO) gas of the envelope at scales of 7000 AU and a gas temperature range of 10–100 K (Table 2).
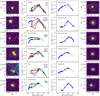 |
Fig. 1 Herschel PACS maps of the systems sampled in this work together with their respective SEDs. The 70 and 160 μm emissions are shown in color scale and contours, respectively. Each stamp spans a region of 80′′ × 80′′ and is centered on the position of the OTF maps, except for NGC 1333 IRAS 5 whose sources have a separation of 45.7′′. Red symbols represent the sources of a system and the positions of the APEX single-pointing observations. Circles denote systems with additional unresolved multiplicity. Diamonds indicate single sources within multiple protostellar systems. Crosses indicate single protostars. The SEDs are overlaid on the average SEDs from Enoch et al. (2009) for reference (dashed lines), with early Class 0 (red), late Class 0, early Class I, late Class I, and Class II (gray). |
3.2 OTF maps
On-the-fly (OTF) maps of all 12 systems were obtained with two instruments: CHAMP+ (Kasemann et al. 2006) and SEPIA B9 (Baryshev et al. 2015; Belitsky et al. 2018), in order to observe 13CO 6–5. 13CO 6–5 is a particularly useful tracer of UV heated gas, in contrast to 12CO 6–5 (van Kempen et al. 2010; Yıldız et al. 2012).
CHAMP+ was used to observe three systems: NGC 1333 IRAS 7, IC348 Per8+Per55, and IRAS 03292+3029, with a spectral set-up targeting 13CO 6–5 (661.06728 GHz) and a beam of 9.4′′ (HPBW). Maps of 45′′ × 45′′ were centered on the target system in the case of IC348 Per8+Per55 and IRAS 03292+3029. In the case of NGC 1333 IRAS 7, the maps were centered at a position equidistant from all sources. Observations took place in two epochs, from 26 August to 19 September 2014 (M-094.F-0006.2014), and 2 to 13 August 2015 (M-095.F-0023.2014).
SEPIA B9 maps (45′′ × 45′′) were made for the remaining 9 systems in our sample, with the spectral set-up targeting 13CO 6–5 (661.06728 GHz) and a beam of 9.4′′ (HPBW). Two maps were made for each of the systems NGC 1333 SVS 13 and NGC 1333 IRAS 5, given the separation between the sources. For NGC 1333 SVS 13, the maps were centered on the A and C sources. Observations took place from 13 August to 25 November 2016 (O-098.F-9320A.2016), with an additional science verification observation of B1-B on 29 July 2016 (E-097.F-9810A.2016).
The systems IRAS 03282+3035 and IRAS 03292+3029 were further observed using FLASH (Heyminck et al. 2006) with a spectral set-up targeting 13CO 4–3 (440.76517 GHz), since observations of 13CO 3–2 were not available with JCMT for these two systems. Observations were carried out on 26 August 2014 (M-094.F-0006.2014).
In order to compare the observations from FLASH, CHAMP+, and SEPIA B9 with the Herschel HIFI 13CO 10–9 observations (RMS noise: 0.03 K; Mottram et al. 2017), the data were averaged within a box of approximately 19.3′′, the HPBW of the HIFI observations, centered on the position of the HIFI observations. The FLASH observations provide RMS noise of 0.44 and 0.75 K for IRAS 03292+3029 and IRAS 03282+3035, respectively, for a channel width of 0.4 km s−1. For the CHAMP+ observations, typical RMS noise is between 0.03 and 0.08 K for a channel width of 0.4 km s−1. For the SEPIA B9 observations, the typical RMS noise level is between 0.1 and 0.2 K for a channel width of 0.4 km s−1. The main beam efficiencies ηmb being used are 0.60 for 440 GHz and 0.56 for 660 GHz. Typical calibration uncertainties are about 10–20%.
Molecular species in this work.
4 Results
4.1 Cold and warm gas
The observed molecular lines trace the cold and warmer envelope gas of the systems in our sample. For the multiple protostellar systems, single pointing observations for each source were taken. However, the beams of the observations (28.7′′ and 18′′) are comparable to the source separations, and the spectra of the individual sources in a wide multiple system are similar. As an example, the spectra of the individual sources for NGC 1333 IRAS 7 are shown in Fig. A.1. Thus, the spectra of all three sources in the wide multiple systems are averaged together, except for NGC 1333 IRAS 5 which has a separation of 45.7′′ and is treated in this work as two separate single protostars Per63 and Per52. The results of the averaged spectra are discussed and analyzed in this work. Figures 2 and 3 show the resulting spectra of the observed sample. Observed line peak temperatures, RMS noise, line widths, and integrated fluxes are listed in Tables B.1–B.6.
HNC was detected toward all the systems in the sample, however, the other observed molecules were not detected in the envelope of every system. Three out of the five wide multiple protostellar systems show detections with signal-to-noise (S/N) above 3σ in 0.4 km s−1 channels forall targeted molecular lines. B1-b, also a wide multiple system, shows above 3σ detections in all lines except H2CO 32,2 –21,2, DCN 5–4 and C2H 4–3 J = 7/2–5/2. SO and methanol (CH3OH) were detected toward four wide multiple systems. IRAS 5 Per63 has detections above 3σ only in DCO+ 3–2, H2 CO 30,3 –20,2, and H2CO 50,5 –40,4. In contrast, IRAS 5 Per52 presents detections in DCO+ 3–2, c-C3H2 3–2 and 6–5, and H2CO 30,3 –20,2.
The close binary system NGC 1333 IRAS 1 presents emission with S∕N > 3σ in SO, DCO+ 3–2, all transitions of the warm molecules c-C3H2 and C2H, as well as H2CO 30,3 –20,2. In contrast, IRAS 03282+3035 presents emission only in both transitions of DCO+, DCN 3–2, and H2CO 30,3 –20,2.
The single protostellar systems show little to no emission. NGC 1333 SK1 presents emission above 3σ in DCO+ 3–2, H2 CO 30,3 –20,2, and H2CO 50,5 –40,4; while L1455-Per25 shows only DCO+ 3–2 and HNC emission. The other single protostar, IRAS 03271+3013, presented no detection beyond HNC. This might be due to the protostar being a Class I protostar, however, NGC 1333 IRAS 1 and both sources of NGC 1333 IRAS 5 are also Class I objects but show more line detections than IRAS 03271+3013. In summary, wide multiple systems generally present more line emission than single protostars, most likely related to the higher envelope mass, and hence larger molecular column density.
DCO+ presents strong emission toward most systems. Since DCO+ is formed from the reaction of H2 D+ + CO, with H2 D+ greatly enhanced at low temperatures due to the freeze-out of CO (<30 K), DCO+ has been found to be a good tracer of cold gas (Jørgensen et al. 2005; Mathews et al. 2013; Murillo et al. 2015). It should be noted, however, that CO freezes out onto the dust grains at densities above 104 – 105 cm−3 (e.g., Caselli et al. 1999; Bergin et al. 2002; Jørgensen et al. 2005), thus at these densities DCO+ may be dependent on density as well as temperature. The low-lying transition of H2 CO 30,3 –20,2 is the strongest among the five transitions, with peaks a factor of ~10 higher than the higher lying H2CO transitions. The peaks of the H2CO 5–4 transitions appear stronger than the higher lying 3–2 transitions, this is due to the smaller HPBW of the APEX-2 observations (18′′). DCN is a warm gas tracer, which can be formed and fractionated through a higher temperature route starting with CH2D+ (e.g., Favre et al. 2015). Similarly to DCN, the higher lying transitions of H2 CO also trace warm gas. The weak emission of DCN and the higher lying transitions of H2 CO would suggest that the envelope gas is relatively cold and currently not being strongly heated. The molecules c-C3H2 and C2H trace the warm UV-irradiated gas (e.g., Nagy et al. 2015; Guzmán et al. 2015), most likely located along the outflow cavity (e.g., Fontani et al. 2012; Jørgensen et al. 2013; Murillo et al. 2018). The peak intensities of c-C3H2 vary by less than a factor of three among all three observed transitions. C2 H is detected in both spin doubling transitions with each transition showing a characteristic double hyperfine structure pattern. Methanol (CH3OH) and SO are mainly formed on grain surfaces, and either are sputtered off the grains by shocks (e.g., Buckle & Fuller 2002; Burkhardt et al. 2016) or sublimated into the gas phase in hot, dense regions of the outflow (e.g., van der Tak et al. 2000; Palau et al. 2017).
The different systemic velocities of each region within Perseus are reflected in the observed spectra (Figs. 2 and 3). For the systems located in NGC 1333, there is also a slight difference in the systemic velocity between the systems located closer to the cluster center (NGC 1333 SVS 13, NGC 1333 IRAS 7, and NGC 1333 IRAS 5; vLSR = 8.0–8.5 km s−1) and those located in the outer part of the cluster (NGC 1333 IRAS 1 and NGC 1333 SK1; vLSR ~ 7.3 km s−1).
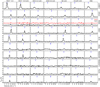 |
Fig. 2 APEX single pointing observations of DCO+, DCN, SO, CH3OH, and HNC. Except for DCO+ 3–2 and HNC, the spectra are multiplied by a factor of 3 to make the features more prominent. The spectra for the wide multiple systems are averaged for all the sources, except for NGC 1333 IRAS 5. The vertical blue line marks the systemic velocity. |
4.2 13CO maps
The results from the 13CO maps are described in this section. The spectra extracted from the maps are shown in Fig. B.1, along with the spectra from JCMT and Herschel HIFI observations, for comparison. Spectra from the JCMT and APEX observations are smoothed to the beam of the HIFI observations. Observed line peak temperatures, RMS noise, line widths, and integrated fluxes are listed in Table B.7.
13CO 4–3 was observed toward the close binary systems IRAS 03282+3035 and IRAS 03292+3039, with emission being detected only toward IRAS 03292+3039 (S∕N ~ 7σ). IRAS 03282+3035 does not show emission at the natural resolution of the FLASH observations (σ ~ 0.5 K), nor smoothed to the Herschel HIFI observations HPBW = 19.25′′ (σ ~ 1 K).
13CO 6–5 was mainly detected toward the wide multiple systems and one close binary system (Fig. B.1). NGC 1333 IRAS 7 and IC348 Per8+Per55, observed with CHAMP+, present strong emission. For NGC 1333 IRAS 7, the bulk of the emission (S∕N = 24σ) is located between Per18 and Per21, with little emission toward Per49, while IC348 Per8+Per55 shows centrally concentrated emission with S∕N = 42σ. IRAS 02393+3039 did not show any significant line emission in the CHAMP+ observations with a noise of 0.12 K.
Observations with SEPIA B9 detected 13CO 6–5 toward L1448N, NGC 1333 SVS 13, and NGC 1333 IRAS 1. From these systems, NGC 1333 SVS 13 presents the strongest emission, peaking at ~4.7 K (average of the central position of the maps centered on sources A and C). L1448N presents weak emission, despite presenting relatively strong line detections in all the other molecules observed with APEX-1 and APEX-2 (Figs. 2 and 3). However, the weak 13CO 6–5 emission is consistent with the observations of 13CO using the JCMT and Herschel HIFI (Table B.7 and Fig. B.1).
The SEPIA B9 observations show considerably more noise by a factor of three higher than those of the CHAMP+ observations. Considering the signal-to-noise ratio of the detected emission, however, the non-detections are not due to the higher noise level of the SEPIA B9 observations, but most likely from the compact 13CO 6–5 emission toward these systems, which is diluted in the larger beam.
5 Analysis
5.1 Line emission and system parameters
The observed molecular line emission is compared to system luminosity and envelope mass in this section. Bolometric luminosity Lbol is obtained from the SEDs of the observedsystems, with Lbol for the widemultiple systems derived from the combined SEDs (Murillo et al. 2016). Envelope mass Menv, listed in Table 3, is calculated from the 850 μm peak intensity S850 μm, Lbol and distance d using the formula from Jørgensen et al. (2009) expressed as:
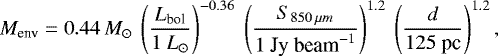 (1)
(1)
which takes into account that more luminous systems have somewhat higher dust temperatures. The relation assumes optically thin emission and typical dust-to-gas ratio of 1:100, and is derived from the power-law relations that arise between envelope mass obtained from radiative transfer models, and the observed peak flux, and luminosity. The power–law relations are  and
and 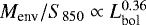 .
.
The 850 μm peak intensity used in this work is measured from the COMPLETE survey map of Perseus taken with SCUBA on the JCMT (Kirk et al. 2006), which has a beam of 15′′. The peak intensity was measured in a circular region of 28.7′′ (HPBW of the APEX-1 observations) centered on each system. For the wide multiple systems, the total flux of all sources is used. In addition, the observed line emission is compared to the ratio of envelope mass to bolometric luminosity, (Menv∕Lbol), listed in Table 3. This ratio gives insight into the amount of mass heated by the luminosity of the protostellar sources within each system. Because younger systems are expected to have more mass in their envelopes, higher ratios are expected to correspond to younger sources (Bontemps et al. 1996). This holds true for the close binary and single systems in our sample. But it is more difficult to disentangle for the wide multiple systems, since the individual sources present different evolutionary stages (Fig. 1 and Table 1).
System type (wide multiple, close binary, and single protostar) is indicated in the plots with different symbols in order to determine if there is any relation with respect to line emission or system parameters. For systems with molecular line non-detections, the upper limits in the plots are placed at 3σ. A linear fit to the data is used to identify trends between the observed line emission peaks and system parameters in cases where there is a significant correlation. Further statistical analysis is treated in Sect. 5.3.
Peak antenna temperatures are compared with the envelope mass in Fig. 4. The peak intensities of H2 CO 30,3 –20,2, and DCO+ 3–2 increase with envelope mass. Wide multiple systems have larger envelope masses than the close binaries and single protostars, with the exception of NGC 1333 IRAS 5, where Per63 and Per52 have envelope masses comparable to single protostars. This can be interpreted as wide multiple systems having more massive reservoirs of cold gas compared to close binaries and single protostellar systems. On the other hand, the warm gas being traced by DCN and the two higher lying transitions of H2 CO 3–2 do not show a dependency on the envelope mass, degree of multiplicity, or region type. Instead the line peaks are practically constant with envelope mass. Methanol, SO, and the three transitions of c-C3H2 do not show particular dependency on envelope mass either. For 13CO 3–2, there appears to be a slight correlation between envelope mass and peak antenna temperature, but there are not enough data points to be certain. The 6–5 and 10–9 transitions also do not show a correlation to envelope mass.
Figure 5 shows the observed line peak antenna temperatures compared with Lbol. The warm molecule C2 H appears to be associated with Lbol, as well as the c-C3H2 6–5 and 5–4 transitions. Since these molecules are generally formed in irradiated regions (Fontani et al. 2012; Jørgensen et al. 2013; Nagy et al. 2015; Guzmán et al. 2015), the correlation between C2 H and c-C3H2, and Lbol can be explained by the outflow cavity being irradiated by the central protostar, as was also found for O[I] and H2O (e.g., Mottram et al. 2017). Thus, the more luminous the central protostar, the deeper the outflow cavity is irradiated and more c-C3H2 and C2H is produced. The two transitions of H2CO 5–4show a correlation to bolometric luminosity, whereas the higher lying transitions of H2 CO 3–2 do not, despite the similar upper energy levels (Eup = 52–68 K). The reason for this discrepancy could be the difference in beam size from the observations. The H2 CO 3–2 transition was observed with a beam of 28.7′′, compared to 18′′ for the 5–4 transition. This suggests that the H2CO 5–4transition is picking up emission from material at smaller scales, closer to the protostellar source(s), and thus related to the luminosity of the protostellar source(s). HNC, and all three transitions of 13CO also show relation to Lbol, as previously found for a larger sample by, for example, San José-García et al. (2013) and Yıldız et al. (2013). The other molecules do not present any correlation to bolometric luminosity, not even SO and CH3OH which are expected to trace shocks, or the higher transitions of H2CO 3–2 which trace warmer gas. The lack of correlation could be due to the low number of detections, and are further explored through statistical analysis in Sect. 5.3.
The peak antenna temperatures compared with Menv∕Lbol are presented in Fig. B.2. There appears to be no relation between any of the observed molecular line peaks and Menv∕Lbol. This indicates that when the amount of mass being illuminated, and thus heated, by the central protostellar system is taken into account, the observed protostellar systems present similar peak antenna temperatures.
These results can be summarized as follows. The bulk of the cold envelope gas is traced by DCO+ and H2 CO 30,3 –20,2 while the warm gas is traced by DCN and the two higher lying transitions of H2 CO. c-C3H2 and C2H trace the warm irradiated outflow cavity, rather than envelope material.
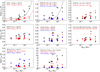 |
Fig. 4 Peak intensities of the observed molecular lines compared to the envelope mass (M⊙) of each systems. The dashed lines are linear fits to the data for the cases where a correlation is found. Circles, diamonds, and stars show single, close binary, and wide multiple protostellar systems, respectively. We note that the more massive envelopes show an increase in the peak intensities of DCO+ and the low-lying transition of H2CO, which trace cold gas in the envelope. Molecules tracing warm gas have similar peak intensities regardless of envelope mass. |
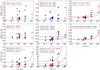 |
Fig. 5 Peak intensities of the observed molecular lines compared to the bolometric luminosity Lbol (L⊙) of each system. The dashed lines are linear fits to the data for the cases where a correlation is found. Circles, diamonds, and stars show single, close binary, and wide multiple protostellar systems, respectively. C2 H and c-C3H2 show somewhat higher peak intensities in systems with relatively higher luminosities. |
Source parameters.
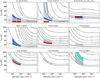 |
Fig. 6 Calculated line ratios for c-C3H2, H2 CO, DCO+, and 13CO. The black lines show the modeled ratios assuming a column density of 1012 cm−2 for c-C3 H2, H2 CO, and DCO+, and 1016 cm−2 for 13CO. For the 13CO 6–5/3–2 and 6–5/4–3 panels, the two lower lines show the 0.02 and 0.04 ratios. The shaded areas show the results for the gas temperature calculations and adopted H2 density range for individual systems: L1448N (cyan), NGC 1333 SVS 13 (blue), NGC 1333 IRAS 7 (light blue), NGC 1333 IRAS 1 or IRAS 03292+3039 (gray), and NGC 1333 IRAS 5 Per52 or NGC 1333 SK1 (red). |
5.2 Line ratios and implied physical conditions
The gas temperature structure can be probed with the several transitions of c-C3H2, H2 CO, and DCO+ that were observed. In addition, the ratio of DCN/DCO+ can be used to compare the warm (DCN) and cold gas (DCO+) from the envelope. Since the two transitions of DCO+ were observed with a different beam (3–2: 28.7′′; 5–4: 18′′), a beam dilution correction factor of 0.39 is applied to the 5–4 transition. Not considering the different beam sizes of the observations, would result in the DCO+ ratio being overestimated by a factor of 2 to 3. The line ratios of c-C3H2, H2 CO, DCO+, and DCN/DCO+ are listed in Table 4. While two transitions of DCN were observed, ratios can only be obtained for half the systems due to low detection rates, of which three are upper limits. These ratios are thus also listed for each system where both lines were detected in Table 4 but not discussed further.
High-J CO lines (Ju > 3) can be used as diagnostics of temperature and density, as well as UV photon-heated gas (e.g., Yıldız et al. 2012, 2015). Hence, the 13CO 4–3 and 6–5 observations presented in this work are compared with peak antenna temperatures from the JCMT and Herschel HIFI observations. For this purpose, the spectra from the JCMT and APEX data were smoothed to the beam of the Herschel HIFI observations (19.25′′). Only part of our sample has data from the JCMT and/or Herschel HIFI (Table B.7). Thus, only those systems are considered for 13CO ratios (Table 5).
Using RADEX (van der Tak et al. 2007), non-LTE excitation and radiative transfer calculations were performed to study the variation of the c-C3H2, H2 CO, DCO+, and 13CO ratios with H2 density and temperature (Fig. 6). The molecular data files for the RADEX calculations were obtained from the Leiden Atomic and Molecular Database (LAMDA; Schöier et al. 2005). The collisional rate coefficients for DCO+ are based on the results of Botschwina et al. (1993) and Flower (1999). For c-C3H2, H2 CO, and 13CO, the collisional rate coefficients are based on Chandra & Kegel (2000), Wiesenfeld & Faure (2013), and Yang et al. (2010), respectively.
Ratios are not calculated for the systems with non-detections in both transitions used in the ratio (Tables B.1, B.3, B.5, and B.7) and are thus not considered in the following analysis (Tables 4 and 5). Upper limits are given when one of the transitions is a non-detection (Table 4), and are not considered for the linear fits but are shown in the figures for reference.
Kineticgas temperatures are derived from the c-C3H2, H2 CO, DCO+, and 13CO ratios by averaging over a range of H2 densities, and are listed in Table 6. An H2 density  range between 105 and 106 cm−3, typical in the envelopes of embedded protostellar objects on the scales of the beam, is assumed for the c-C3H2, H2 CO, and DCO+ calculations. A column density of 1012 cm−2 is adopted for the DCO+, c-C3H2, and H2CO line ratio calculations, ensuring that the lines are optically thin. For 13CO, a column density of 1016 cm−2 is adopted for a line width of 2 km s−1, which produces optically thin emission. Yıldız et al. (2012) found a column density of 1017 cm−2 for a line width of 10 km s−1 toward NGC 1333 IRAS 4A and IRAS 4B. Thus, our adopted 13CO column density is reasonable. Adopting a column density of 1017 cm−2 for a line width of 2 km s−1 would provide optically thick emission.
Figure 7 compares the calculated ratios with envelope mass Menv, bolometric luminosity Lbol, and Menv∕Lbol. Since molecular line ratios are related to gas temperature (Fig. 6), the comparison serves to determine relations between temperature and system parameters.
With respect to Lbol, both ratios of c-C3H2 show good correlation with luminosity. On the other hand, c-C3H2 shows an anticorrelation with Menv∕Lbol, to be expected based on the correlation with Lbol. Both c-C3H2 ratios point to gas temperatures between 10 and 60 K, with the ratios of NGC 1333 IRAS 7 and NGC 1333 IRAS 1 pointing to higher temperatures at  of a few 105 cm−3. These results suggest that c-C3H2 is dependent on the protostellar system luminosity. This makes sense if it is considered that c-C3H2 traces the outflow cavity, which is irradiated by the central protostar, and thus the Lbol. A higher luminosity will lead to higher temperatures traced by c-C3H2. If the envelope mass is large, however, then more material needs to be heated by the protostar and the gas temperature traced by c-C3H2 will be lower. Since the density in the outflow cavity is expected to decrease and the outflow to become hotter as protostars evolve from Class 0 to I (e.g., Nisini et al. 2015; Mottram et al. 2017), the results of c-C3H2 toward our sample may indicate an evolutionary effect. The separation of the sources in multiple systems or their coevality does not show any effect on the temperature traced by the c-C3H2 ratio (Fig. 7). While there is no difference in temperature between close binaries and wide multiples, the effect of multiplicity, on the other hand, cannot be fully determined, since none of the single protostars in our sample present c-C3H2 detections.
The ratios of H2CO, DCO+, and 13CO are quite constant in relation to all system parameters, and suggest overall cooler temperatures. System type, region, and evolutionary stage do not present any correlation either. The ratios of H2 CO and DCO+ indicate temperature between 10 and 60 K.Considering higher  , alters the temperature by only a few degrees, otherwise the temperatures stay mainly constant. Thus, all embedded protostars appear to have envelope gas with similar, and relatively cold, temperatures regardless of their multiplicity (Fig. 7).
The ratios obtained from 13CO vary little among the systems, regardless of system parameters, multiplicity, and evolutionary stage. The low ratios suggest temperatures typically below 60 K, with only L1448 N showing temperatures closer to 100 K at  of a few 105 cm−3. This is consistentwith the work of Yıldız et al. (2015), which found typical gas temperatures of 30–50 K toward protostellar systems. Given that high-J 13CO lines trace UV photon-heated gas, the low ratios and derived temperatures would indicate that the envelope is not being heated out to large radii. Furthermore, the lack of line detection toward some of the systems would suggest that 13CO emission is concentrated closer to the source of heating, and thus is being diluted in the APEX beam, and even more so when smoothed to the Herschel HIFI beam.
In order to determine whether our sample of protostellar systems is particularly cold, we construct a histogram of 13CO ratios from Appendix C of Yıldız et al. (2013) and those derived from the observations in this work (Fig. 8). In total the sample includes 33 protostellar systems, 26 from the work of Yıldız et al. (2013), and 7 from this work. The sample from Yıldız et al. (2013) includes protostellar systems from different star-forming regions, but does not overlap with the sample in this work. The histogram is then fit with a Gaussian distribution to find the mean ratio and standard deviation. For the 13CO 6–5/3–2 ratio, the mean ratio is 0.74 with a standard deviation of 0.46, and the ratios indicating a range of temperatures. For 10–9/3–2 and 10–9/6–5, the ratios are below 0.3 and indicate cool temperatures in general. For the 13CO 10–9/3–2 ratio, the mean ratio is 0.05 with a standard deviation of 0.04, whereas for 10–9/6–5, the mean ratio and standard deviation are 0.08 and 0.07, respectively. The upper limits would decrease the mean ratio for the 13CO 10–9/3–2 and 10–9/6–5 ratios, but not so much for the 6–5/3–2 ratio.
In summary, the cool envelope temperatures found in this work are not from particularly cold protostellar systems, nor is the Perseus molecular cloud producing uncommon protostars. It would seem, instead, that the central protostar does not extensively heat the envelope to high temperatures, and that single protostars do not heat the envelope differently than multiple protostellar systems.
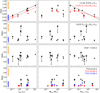 |
Fig. 7 Calculated molecular line ratios of c-C3H2 (top row), H2CO (second row), DCO+ (third row) and 13CO (bottom row) compared to the system parameters bolometric luminosity Lbol (left column), envelope mass Menv (middle column), and the mass to luminosity ratio Menv∕Lbol (right column). The black and red dashed lines in the top row are linear fits to the data for the 6–5/33,0–22,1 and 51,4–42,3/33,0–22,1 ratios, respectively. Circles, diamonds, and stars show single, close binary, and wide multiple protostellar systems, respectively. The c-C3H2 ratios appear to be somewhat related to luminosity, whereas the ratios from H2 CO and DCO+ are constantregardless of system parameter. |
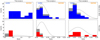 |
Fig. 8 13CO ratio stacked histogram including JCMT and Herschel data from Yıldız et al. (2013; top row) and this work (bottom row). Upper limits are shown in gray. Ratios from Yıldız et al. (2013) are for the systems in the Water In Star-forming regions with Herschel (WISH) key project (van Dishoeck et al. 2011), which do not overlap with the sample studied in this work. The black dashed line shows a Gaussian distribution fit to the total sample of 13CO ratios. |
5.3 Statistical analysis
In order to determine quantitatively if there is a relation between the observed line peaks and derived quantities, and the system parameters, the Generalized Kendall’s rank correlation is used (Isobe et al. 1986). This method measures the degree of association between two quantities which contain upper limits (censored data), with the null hypothesis being that the values are uncorrelated. Thus, if the significance level p > 0.05, the probability of the values being correlated is less than 3σ, while p < 0.05 indicates a correlation at better than 3σ significance. The standard normal score z and the significance level p of the Generalized Kendall’s rank correlation are listed in Table C.1, with values indicating a correlation highlighted in bold text. The significance level is calculated from the standard normal score z by the relation
 (2)
(2)
where erf(x) is the error function.
The results confirm the correlations seen by eye (Sect. 5.1). The peak antenna temperatures of the molecules tracing cold gas, namely, DCO+ and H2CO are associated with system envelope mass, but not with luminosity. On the other hand, the peak antenna temperatures of c-C3H2 and C2H, both tracers of warm gas, are correlated with luminosity but not system envelope mass. The three transitions of 13CO present correlation with luminosity, while the 6–5 transition also presents a correlation with the mass to luminosity ratio. The 6–5/33,0–22,1 ratio of c-C3H2 shows correlations with luminosity and the mass to luminosity ratio, but not envelope mass. The DCN/DCO+ and 13CO 10–9/3–2 ratios present correlation with envelope mass, but not the other system parameters.
Peak main beam temperature line ratios.
13CO peak main beam temperature line ratios.
Derived Tkin from line ratios averaged over H2 density range.
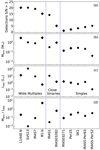 |
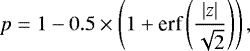
Fig. 9 Number of line detections (panel a), envelope mass Menv (panel b), bolometric luminosity Lbol (panel c), and envelope mass to luminosity ratio Menv/Lbol (panel d) of each system in our sample compared to the region, clustered (circles) or non-clustered (diamonds), and system type. NGC 1333 IRAS 5 is considered here as two single protostellar systems, Per63 and Per52. |
6 Discussion
6.1 Observed line detections
The observations appear to show a tendency for wide multiple protostellar systems (separations >7′′) to have more molecular line detections with strong peak intensities than close binaries (Fig. 9). In contrast, single protostars present very weak molecular line emission. There seems to be a relation, however, between the envelope mass and the number of molecular line detections. As noted in Sect. 5.1, the ratio Menv∕Lbol correlates with evolutionary stage for the close binary and single systems. However, the ratio, and thus the evolutionary stage, does not seem to have relation to the number of line detections (Fig. 9d). These relations appear to not be affected by clustering either. However, the envelope mass is larger for wide multiple protostellar systems in contrast to that of close binary and single protostars. Core mass would then be more related to formation of non-coeval wide multiple protostellar systems. There is no apparent relation between the bolometric luminosity Lbol and the number of line detections (Fig. 9c) nor their strength (Fig. 5). The systems L1448 N, NGC 1333 IRAS 7, and NGC 1333 SVS 13, which have combined bolometric luminosities above 8 L⊙, show strong detections of all the molecular species. Clustering does not seem to particularly enhance the line strength or number of line detections in the envelope (Fig. 9). L1448 N and B1-b are both located in non-clustered environments and present the same chemical richness as the multiple protostars located in NGC 1333, which is a clustered region. Both Class 0 and I systems are present in wide multiples, close binaries, and single protostellar systems, but no effect is seen on the line detections. It must be highlighted, however, that the sample size presented in this work is small and more protostellar systems would be needed to determine if the trends found in this work are real or product of the small sample size.
6.2 Envelope gas temperature and multiplicity
The H2CO and DCO+ ratios point to cool envelopes (Tgas < 60 K at scales of 7000 AU) for all the systems in our sample, regardless of multiplicity, clustering, and evolutionary stage. Only c-C3H2 presents a correlation with bolometric luminosity and an anticorrelation with Menv∕Lbol. Since a formation path of c-C3H2 is through the breakdown of large hydrocarbons by UV photons, these correlations could be related to the amount of material that is irradiated by the central protostar, with more luminous protostars irradiating more material. Alternatively, it could be an evolutionary effect where the jet becomes hotter while the envelope and outflow cavity mass decreases, resulting in more material being irradiated by UV photons (e.g., Nisini et al. 2015; Mottram et al. 2017). The low 13CO ratios, and derived temperature (Tgas < 100 K at scales of ~4500 AU), suggest that the envelope and outflow cavity are not being UV photon-heated out to large extents.
The results of Maret et al. (2004) and Koumpia et al. (2016) support the possibility that the envelope gas is not being heated out to large extents. Maret et al. (2004) observed L1448 N, NGC 1333 IRAS 4A, and IRAS 4B using the single-dish IRAM 30-m telescope and the JCMT, tracing scales of 2500–4000 AU (HPBW = 11′′ –17′′), while Koumpia et al. (2016) observed NGC 1333 IRAS 4 with the JCMT (HPBW = 15′′, ~3500 AU). Using LVG modeling under non-LTE conditions, Maret et al. (2004) derive temperatures of 50 K for NGC 1333 IRAS 4A, 80 K for NGC 1333 IRAS 4B, and 90 K for L1448 N. The results presented here for L1448 N find gas temperature of 30 K at 7000 AU scales and 65 K at 4500 AU scales (Table 6). The peak gas temperatures found by Koumpia et al. (2016) for NGC 1333 IRAS 4 are in agreement with the results of Maret et al. (2004). However, the gas temperature distribution from Koumpia et al. (2016) shows that the gas temperature drops to 40 K at ~2000 AU away from NGC 1333 IRAS 4B, and that the 60 K gas is located along the outflow cavity of NGC 1333 IRAS 4A, consistent with the findings of Yıldız et al. (2012), with the gas temperature droping to 40 K at a distance of ~5000 AU. These results thus indicate that while the embedded protostar can heat up the surrounding gas to temperatures of 50–100 K, it can only do so out to about 1000 AU or along low density structures such as the outflow cavity. In contrast, wide multiple protostellar systems are observed to have much larger separations (Table 1), with sources not likely to be located within the outflow cavity.
Non-detection within the APEX beam of molecules such as c-C3H2 and H2CO, which trace the outflow cavity and envelope gas, respectively, would point to cooler envelopes and outflow cavities at scales of 7000 AU. In addition, DCO+, a cold gas tracer, is detected toward all but one system (IRAS 03271+3013, single). Non-detections of warm gas tracers in addition to the presence of DCO+ toward single and close binary protostellar systems could be explained by these systems being somewhat cooler than wide multiple protostellar systems. Another possibility could be the evolutionary dispersal of envelope material which would cause the warm gas to be located closer to the protostellar source(s) and thus diluted in the observing beam. Interestingly enough, H2 CO 30,3 –20,2 and DCO+ appear to increase with an increase in envelope mass. In other words, H2 CO 30,3 –20,2 and DCO+ present stronger emission in wide multiple protostars. This could indicate the presence of massive reservoirs of cold gas in these systems.
External heating does not seem to play a significant role, as evidenced by a lack of difference in all aspects between systems in clustered and non-clustered regions. However, it is not clear why close binaries present less molecular line emission than wide multiple protostars, given that some sources of the latter are often close binaries themselves (Fig. 1). A possible explanation would be the sensitivity and beam filling factor of the observations. However, this would not explain why NGC 1333 IRAS 1 has more line detections than NGC 1333 IRAS 5 Per63 when both have sensitivities of ~30 mK. The results presented in this work indicate that there is no significant difference in envelope temperature between single, close binary, and wide multiple protostellar systems. The only difference temperature-wise arises from c-C3H2, which traces the outflow cavity. This is consistent with previous studies that find the heating by protostellar source(s) is mainly channeled through the outflow cavity (Yıldız et al. 2012, 2015).
The envelope gas temperatures measured in our sample coincide well with the temperature expectations from Krumholz (2006), 30 K at a few thousand AU, while the results from Koumpia et al. (2016) and Maret et al. (2004) are consistent with the inner regions closer to the source being heated to 100 K. However, no extensive heating of the envelope out to thousand AU scales (Bate 2012) is found in our sample, with gas temperatures above 30 K occurring only in the outflow cavities. Based on the work presented here, the prediction that heating of the envelope should hinder fragmentation is not consistent with the results and analysis of the sample. Wide multiple systems tend to be non-coeval and are thus produced by continued fragmentation of the cloud core (Murillo et al. 2016; Sadavoy & Stahler 2017), but they do not show colder envelope gas temperatures with respect to coeval binary and single protostellar systems. Thus, if the envelope gas temperature is similar for all surveyed systems, then it is not clear why only some cores have continued fragmentation. Cloud core mass could provide a possible explanation, since wide multiple systems present higher envelope masses than coeval binary and single protostellar systems, however this would require further studies.
An interesting case is that of L1448 N, which has been found to have undergone recent fragmentation in the disk of one source (Tobin et al. 2016a), that is fragmentation at 10–100 AU scales. Although the recent fragmentation could have heated the envelope of this system as suggested by simulations (Boss et al. 2000; Whitehouse & Bate 2006), increasing the envelope temperature, it does not seem to have generated a considerable effect on thousand AU scales. Furthermore, the disk is certainly heated by the existing protostars but fragmentation of the disk was not hindered.
6.3 Accretion bursts
Accretion of material onto the protostar is not a continuous process, but has been found from observations to be episodic (e.g., Visser et al. 2015; Safron et al. 2015; Frimann et al. 2017; Hsieh et al. 2018). An accretion burst causes an increase in luminosity, and consequently heating of the envelope gas. The chemical composition of the envelope gas is altered, since cold chemistry molecules (e.g., DCO+) move further out and molecules such as CO are evaporated off the grains. While the luminosity of the central protostar will decrease after the accretion burst has passed, it takes about 104 years for the gas to refreeze onto the dust grains (Johnstone et al. 2013; Jørgensen et al. 2015).
Frimann et al. (2017) studied the presence of accretion bursts toward embedded protostars in Perseus. Their sample includes four of the systems studied in this work (L1448 N, NGC 1333 SVS 13, NGC 1333 IRAS 1, and IRAS 03282), as well as two sources of NGC 1333 IRAS 7, Per18, and Per21. Half of these systems (Per21, IRAS 1 and IRAS 03282) present indications of past accretion burst activity, while the others (L1448 N, SVS 13, and Per18) do not. The results presented here do not show any difference among the systems that have evidence of having undergone an accretion burst, and those that have not. NGC 1333 IRAS 1 and IRAS 03282, both close binary protostars, are suggested to have undergone an accretion burst. The difference found in this work is mainly that IRAS 1 presents emission from warm molecules, while IRAS 03282 only shows emission in cold molecules. For L1448N and SVS 13, both wide multiple protostars, there is also no significant difference, since both systems present the same number of line detections, with similar peak intensities except for DCO+ which is stronger in L1448N. Analyzing NGC 1333 IRAS 7 Per18 and Per21 (Appendix A) separately also points to a lack of significant difference among both sources. However, it must be noted that given their separation of 13′′, the spectra of each source is contaminated by emission from the other.
7 Conclusions
Single-dish observations of a sample of 12 embedded protostellar systems in Perseus are presented here. The observations targeted molecular line emission that trace the cold, warm, and UV-heated gas of the observed protostellar systems. The sample included wide multiple protostellar systems (separation ≥ 7′′, or ≥1600 AU), close binary protostars (separation <2′′, or <470 AU) and single protostars, located in clustered and non-clustered environments, spanning Class 0 and I objects, and containing coeval and non-coeval systems. The results presented in this work examine the relationship between fragmentation and temperature, since heated gas is expected to suppress fragmentation based on simulations including radiative feedback.
Although the sample presented here is small and there are several upper limits, the envelope gas temperature is found to be similar among multiple and single protostars, regardless of evolutionary stage, coevality, or clustering. These results suggest thatgas temperature may not have as strong a role in suppressing fragmentation as expected from models, a result that was also stated in Offner et al. (2010), who found that temperature does not suppress turbulent fragmentation. Instead, wide multiple protostellar systems present larger envelope masses and massive cold gas reservoirs in comparison to close binary and single protostars. It seems, then, that mass, along with other factors such as turbulence, density profile, and magnetic fields, rather than envelope gas temperature plays a fundamental role in fragmentation. Larger, more massive cores could then lead to further fragmentation that forms non-coeval wide multiple systems.
Further interferometric observations of the sample used in this work using the same molecular lines treated here would lend insight into the spatial distribution of the cold, warm, and UV heated gas. The gas density and temperature distribution can then be compared to the multiplicity of the protostellar system. An additional topic of further research would then be to determine what causes some cores to become more massive than others.
Acknowledgements
Astrochemistry in Leiden is supported by the European Union A-ERC grant 291141 CHEMPLAN, by the Netherlands Research School for Astronomy (NOVA), by a Royal Netherlands Academy of Arts and Sciences (KNAW) professor prize. J.C.M. acknowledges support from the European Research Council under the European Community’s Horizon 2020 framework program (2014–2020) via the ERC Consolidator grant “From Cloud to Star Formation (CSF)” (project number 648505). A.K. acknowledges support from the Polish National Science Center grant nr 2016/21/D/ST9/01098. We are grateful to the APEX staff for support with these observations. Observing time for the APEX data was obtained via Max Planck Institute for Radio Astronomy, Onsala Space Observatory, and European Southern Observatory.
Appendix A Single-pointing observations: NGC 1333 IRAS 7
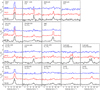 |
Fig. A.1 Spectra for the individual sources of NGC 1333 IRAS 7. We note that some spectra are multiplied by a factor of three in order to enhance the line emission features. The spectra of Per21 and Per49 are offset by 1.3 and 2.6 K from that of Per18 for clarity. |
APEX single pointing observations with the heterodyne instruments APEX-1 and APEX-2 were made toward 5 wide (separation >7′′) multiple protostellar systems in Perseus. These systems are referred to as wide multiple protostars since the sources span separations grater than 7′′ (which can be resolved with Herschel Space Observatory PACS photometric maps; Murillo et al. 2016) One pointing per source in a wide multiple system was observed. In the main text are the parameters of the lines obtained by averaging the spectra of the individual sources for the corresponding system. This is because in all cases except NGC 1333 IRAS 5, the beam of APEX observationspartially overlaps another source in the system.
Here, the spectra for the individual sources of the system NGC 1333 IRAS 7 are presented (Fig. A.1). This provides an example of the similarity of the spectra of the individual sources. The spectra of Per21, which is expected to have undergone arecent accretion burst, and Per18, which has no evidence of episodic accretion, can also be compared. It is also interesting to note that Per49 presents much weaker emission than Per18 and Per21. The evolutionary stage, multiplicity, and bolometric luminosity for each source in the system are listed in Table A.1 for reference.
The peak brightness temperature ratios for c-C3H2, H2 CO, DCO+, and DCN are calculated for each source (Table A.2). A beam dilution factor of 0.39 is applied to the 5–4 transitions of DCO+ and DCN, since the beam of the observations of the 5–4 transition is smaller than the beam for the 3–2 transition (see Sect. 3). Since the beams of the APEX-1 observations overlap for Per18 and Per21, we note that the ratios for these two sources may be contaminated with emission from each other. Table A.2 also lists the line ratios for the whole system for the purpose of comparison.
Source parameters for NGC 1333 IRAS 7.
Peak main beam temperature line ratios for NGC 1333 IRAS 7.
Derived Tkin from line ratios averaged over H2 for NGC 1333 IRAS 7.
The line ratios for each source in NGC 1333 IRAS 7 are similar to those derived for the whole system (Table A.2), and are compared with the ratio models shown in Fig. 6. The DCN ratios are upper limits due to the non-detection of the 5–4 transition, and instead three times the noise level is used for the ratio. The DCN to DCO+ 3–2 ratio is used to look at the ratio of warm to cold gas in the envelope, with all the ratios well below unity, indicating a larger amount of cold gas.
Gas temperatures were derived from the line ratios assuming an H2 density range of 105 –106 cm−3 for c-C3H2, H2 CO, and DCO+. The averagederived gas temperatures are listed in Table A.3. For the envelope gas, H2 CO indicates temperatures of around 30K, while DCO+ ratios pointto gas temperatures of about 21 K. For c-C3H2, the line ratios indicate higher temperatures, between 20 and 50 K, which is to be expected for material along the outflow cavity. The gas temperatures for each source in the NGC 1333 IRAS 7 system are similar to the system as a whole (Table A.3).
The derived temperatures do not show relation with bolometric luminosity or envelope mass. The overall trend is consistent with that of the other systems studied, namely that the envelope gas temperature is similar for all systems, regardless of multiplicity. The source Per21 is thought to have undergone a recent accretion burst (Frimann et al. 2017), however, no significant difference in the derived ratios and gas temperatures is found. It must be stressed, however, that the values toward Per21 are very likely contaminated by Per18, and vice versa, due to the beam of the APEX-1 observations.
Appendix B Observed molecular line emission
In this appendix the peak antenna temperatures, RMS noise, measured line widths, and integrated fluxes are listed for the detected molecular lines from the APEX observations. These values were obtained with a simple Gaussian fit of the detected emission line, with no fixed parameters, and binning 4 channels to obtain a velocity resolution of 0.4 km s−1.
Figure B.1 shows the spectra of 13CO in different transitions. The 3–2 transition was observed with the JCMT. Both the 4–3 and 6–5 transitions were observed with APEX using FLASH, CHAMP+, and SEPIA B9. The 10–9 transition was observed with Herschel HIFI in the WISH program. All spectra were smoothed to an angular resolution of 19.25′′, and the spectra of JCMT and APEX observations were taken with a 19.25′′ box.
Figure B.2 plots the peak antenna temperature from the APEX observations versus the mass to bolometric luminosity ratio Menv∕Lbol. No correlation is found between the peak antenna temperatures and Menv∕Lbol. This lack of correlation is futher confirmed by the Generalized Kendall’s rank correlation (see Sect. 5.3 and Appendix C), which only finds correlations between methanol (CH3OH) and Menv∕Lbol.
Peak main beam temperatures for DCO+ and DCN.
Peak main beam temperatures for SO, CH3OH, and HNC.
Peak main beam temperatures for c-C3H2.
Peak main beam temperatures for C2H.
Peak main beam temperatures for H2CO 3–2.
Peak main beam temperatures for H2CO 5–4.
Peak main beam temperatures for 13CO.
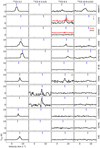 |
Fig. B.1 13CO spectra observed with JCMT (3–2), APEX (6–5), and Herschel HIFI (10–9). The spectra of JCMT and APEX are smoothed to a resolution of 19.25′′, the HPBW of the HIFI observations. The short blue lines at the top of each plot indicate the systemic velocity of the system. We note that the 13CO 4–3 and 10–9 spectra are multiplied by a factor of 3 and 15, respectively. The 6–5 spectra for NGC 1333 IRAS 1 is also multiplied by a factor of 3. |
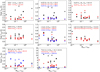 |
Fig. B.2 Peak intensities of the observed molecular lines compared to the envelope mass to luminosity ratio of each system. Circles, diamonds, and stars show single, close binary, and wide multiple protostellar systems, respectively. |
Appendix C Statistical analysis
The relation between the results of the observations and the system parameters is determined by the Generalized Kendall’s rank (Isobe et al. 1986). The table in this appendix lists the significance level p and standard normal score z of the rank correlation test. The numbers in bold indicate real correlations (p < 0.05).
Results of the Generalized Kendall’s correlation.
References
- André, P., Men’shchikov, A., Bontemps, S., et al. 2010, A&A, 518, L102 [NASA ADS] [CrossRef] [EDP Sciences] [Google Scholar]
- Arce, H. G., Borkin, M. A., Goodman, A. A., Pineda, J. E., & Halle, M. W. 2010, ApJ, 715, 1170 [NASA ADS] [CrossRef] [Google Scholar]
- Baryshev, A. M., Hesper, R., Mena, F. P., et al. 2015, A&A, 577, A129 [NASA ADS] [CrossRef] [EDP Sciences] [Google Scholar]
- Bate, M. R. 2012, MNRAS, 419, 3115 [NASA ADS] [CrossRef] [Google Scholar]
- Belitsky, V., Lapkin, I., Fredrixon, M., et al. 2018, A&A, 612, A23 [NASA ADS] [CrossRef] [EDP Sciences] [Google Scholar]
- Bergin, E. A., Alves, J., Huard, T., & Lada, C. J. 2002, ApJ, 570, L101 [NASA ADS] [CrossRef] [Google Scholar]
- Beuther, H., Mottram, J. C., Ahmadi, A., et al. 2018, A&A, 617, A100 [NASA ADS] [CrossRef] [EDP Sciences] [Google Scholar]
- Bocquet, R., Demaison, J., Poteau, L., et al. 1996, J. Mol. Spectr., 177, 154 [NASA ADS] [CrossRef] [Google Scholar]
- Bogey, M., Demuynck, C., & Destombes, J. L. 1986, Chem. Phys. Lett., 125, 383 [NASA ADS] [CrossRef] [Google Scholar]
- Bogey, M., Demuynck, C., Destombes, J. L., & Dubus, H. 1987, J. Mol. Spectr., 122, 313 [NASA ADS] [CrossRef] [Google Scholar]
- Bontemps, S., Andre, P., Terebey, S., & Cabrit, S. 1996, A&A, 311, 858 [NASA ADS] [Google Scholar]
- Boss, A. P., Fisher, R. T., Klein, R. I., & McKee, C. F. 2000, ApJ, 528, 325 [NASA ADS] [CrossRef] [Google Scholar]
- Botschwina, P., Horn, M., Flugge, J., & Seeger, S. 1993, J. Chem. Soc., Faraday Trans., 89, 2219 [NASA ADS] [CrossRef] [Google Scholar]
- Brünken, S., Fuchs, U., Lewen, F., et al. 2004, J. Mol. Spectr., 225, 152 [NASA ADS] [CrossRef] [Google Scholar]
- Buckle, J. V., & Fuller, G. A. 2002, A&A, 381, 77 [NASA ADS] [CrossRef] [EDP Sciences] [Google Scholar]
- Burkhardt, A. M., Dollhopf, N. M., Corby, J. F., et al. 2016, ApJ, 827, 21 [NASA ADS] [CrossRef] [Google Scholar]
- Carney, M. T., Yıldız, U. A., Mottram, J. C., et al. 2016, A&A, 586, A44 [NASA ADS] [CrossRef] [EDP Sciences] [Google Scholar]
- Caselli, P., & Dore, L. 2005, A&A, 433, 1145 [NASA ADS] [CrossRef] [EDP Sciences] [Google Scholar]
- Caselli, P., Walmsley, C. M., Tafalla, M., Dore, L., & Myers, P. C. 1999, ApJ, 523, L165 [NASA ADS] [CrossRef] [Google Scholar]
- Cazzoli, G., Cludi, L., Buffa, G., & Puzzarini, C. 2012, ApJS, 203, 11 [NASA ADS] [CrossRef] [Google Scholar]
- Chandra, S., & Kegel, W. H. 2000, A&AS, 142, 113 [NASA ADS] [CrossRef] [EDP Sciences] [Google Scholar]
- Chen, M. C.-Y., Di Francesco, J., Johnstone, D., et al. 2016, ApJ, 826, 95 [NASA ADS] [CrossRef] [Google Scholar]
- Ching, T.-C., Lai, S.-P., Zhang, Q., et al. 2016, ApJ, 819, 159 [NASA ADS] [CrossRef] [Google Scholar]
- Clark, W. W., & De Lucia F. C. 1976, J. Mol. Spectr., 60, 332 [NASA ADS] [CrossRef] [Google Scholar]
- Commerçon, B., Hennebelle, P., Audit, E., Chabrier, G., & Teyssier, R. 2010, A&A, 510, L3 [NASA ADS] [CrossRef] [EDP Sciences] [Google Scholar]
- Curtis, E. I., & Richer, J. S. 2011, MNRAS, 410, 75 [NASA ADS] [CrossRef] [Google Scholar]
- Curtis, E. I., Richer, J. S., & Buckle, J. V. 2010a, MNRAS, 401, 455 [NASA ADS] [CrossRef] [Google Scholar]
- Curtis, E. I., Richer, J. S., Swift, J. J., & Williams, J. P. 2010b, MNRAS, 408, 1516 [NASA ADS] [CrossRef] [Google Scholar]
- Davis, C. J., Scholz, P., Lucas, P., Smith, M. D., & Adamson, A. 2008, MNRAS, 387, 954 [NASA ADS] [CrossRef] [Google Scholar]
- Endres, C. P., Schlemmer, S., Schilke, P., Stutzki, J., & Müller, H. S. P. 2016, J. Mol. Spectr., 327, 95 [NASA ADS] [CrossRef] [Google Scholar]
- Enoch, M. L., Young, K. E., Glenn, J., et al. 2006, ApJ, 638, 293 [NASA ADS] [CrossRef] [Google Scholar]
- Enoch, M. L., Evans, II, N. J., Sargent, A. I., & Glenn, J. 2009, ApJ, 692, 973 [NASA ADS] [CrossRef] [Google Scholar]
- Evans, II, N. J., Rawlings, J. M. C., Shirley, Y. L., & Mundy, L. G. 2001, ApJ, 557, 193 [NASA ADS] [CrossRef] [Google Scholar]
- Evans, II, N. J., Dunham, M. M., Jørgensen, J. K., et al. 2009, ApJS, 181, 321 [NASA ADS] [CrossRef] [Google Scholar]
- Favre, C., Bergin, E. A., Cleeves, L. I., et al. 2015, ApJ, 802, L23 [NASA ADS] [CrossRef] [Google Scholar]
- Flower, D. R. 1999, MNRAS, 305, 651 [NASA ADS] [CrossRef] [Google Scholar]
- Fontani, F., Palau, A., Busquet, G., et al. 2012, MNRAS, 423, 1691 [NASA ADS] [CrossRef] [Google Scholar]
- Fontani, F., Commerçon, B., Giannetti, A., et al. 2018, A&A, 615, A94 [NASA ADS] [CrossRef] [EDP Sciences] [Google Scholar]
- Frimann, S., Jørgensen, J. K., Dunham, M. M., et al. 2017, A&A, 602, A120 [NASA ADS] [CrossRef] [EDP Sciences] [Google Scholar]
- Galli, D., Walmsley, M., & Gonçalves J. 2002, A&A, 394, 275 [NASA ADS] [CrossRef] [EDP Sciences] [Google Scholar]
- Güsten, R., Nyman, L. Å., Schilke, P., et al. 2006, A&A, 454, L13 [NASA ADS] [CrossRef] [EDP Sciences] [Google Scholar]
- Guzmán, V. V., Pety, J., Goicoechea, J. R., et al. 2015, ApJ, 800, L33 [NASA ADS] [CrossRef] [Google Scholar]
- Hacar, A., Tafalla, M., & Alves, J. 2017, A&A, 606, A123 [NASA ADS] [CrossRef] [EDP Sciences] [Google Scholar]
- Hatchell, J., Richer, J. S., Fuller, G. A., et al. 2005, A&A, 440, 151 [NASA ADS] [CrossRef] [EDP Sciences] [Google Scholar]
- Hatchell, J., Wilson, T., Drabek, E., et al. 2013, MNRAS, 429, L10 [NASA ADS] [CrossRef] [Google Scholar]
- Heiderman, A., & Evans, II, N. J. 2015, ApJ, 806, 231 [NASA ADS] [CrossRef] [Google Scholar]
- Hennebelle, P., Commerçon, B., Joos, M., et al. 2011, A&A, 528, A72 [NASA ADS] [CrossRef] [EDP Sciences] [Google Scholar]
- Heyminck, S., Kasemann, C., Güsten, R., de Lange, G., & Graf, U. U. 2006, A&A, 454, L21 [NASA ADS] [CrossRef] [EDP Sciences] [Google Scholar]
- Hirano, N., & Liu, F.-c. 2014, ApJ, 789, 50 [NASA ADS] [CrossRef] [Google Scholar]
- Hirota, T., Honma, M., Imai, H., et al. 2011, PASJ, 63, 1 [NASA ADS] [CrossRef] [Google Scholar]
- Hsieh, T.-H., Murillo, N. M., Belloche, A., et al. 2018, ApJ, 854, 15 [NASA ADS] [CrossRef] [Google Scholar]
- Isobe, T., Feigelson, E. D., & Nelson, P. I. 1986, ApJ, 306, 490 [NASA ADS] [CrossRef] [Google Scholar]
- Johnstone, D., Hendricks, B., Herczeg, G. J., & Bruderer, S. 2013, ApJ, 765, 133 [NASA ADS] [CrossRef] [Google Scholar]
- Jørgensen, J. K., Schöier, F. L., & van Dishoeck E. F. 2005, A&A, 435, 177 [NASA ADS] [CrossRef] [EDP Sciences] [Google Scholar]
- Jørgensen, J. K., van Dishoeck, E. F., Visser, R., et al. 2009, A&A, 507, 861 [NASA ADS] [CrossRef] [EDP Sciences] [Google Scholar]
- Jørgensen, J. K., Visser, R., Sakai, N., et al. 2013, ApJ, 779, L22 [NASA ADS] [CrossRef] [Google Scholar]
- Jørgensen, J. K., Visser, R., Williams, J. P., & Bergin, E. A. 2015, A&A, 579, A23 [NASA ADS] [CrossRef] [EDP Sciences] [Google Scholar]
- Karska, A., Kristensen, L. E., van Dishoeck, E. F., et al. 2014, A&A, 572, A9 [NASA ADS] [CrossRef] [EDP Sciences] [Google Scholar]
- Kasemann, C., Güsten, R., Heyminck, S., et al. 2006, Proc. SPIE, 6275, 62750N [CrossRef] [Google Scholar]
- Kirk, H., Johnstone, D., & Di Francesco J. 2006, ApJ, 646, 1009 [NASA ADS] [CrossRef] [Google Scholar]
- Klapper, G., Lewen, F., Gendriesch, R., Belov, S. P., & Winnewisser, G. 2000, J. Mol. Spectr., 201, 124 [NASA ADS] [CrossRef] [Google Scholar]
- Koumpia, E., van der Tak, F. F. S., Kwon, W., et al. 2016, A&A, 595, A51 [NASA ADS] [CrossRef] [EDP Sciences] [Google Scholar]
- Kratter, K. M., Matzner, C. D., Krumholz, M. R., & Klein, R. I. 2010, ApJ, 708, 1585 [NASA ADS] [CrossRef] [Google Scholar]
- Krumholz, M. R. 2006, ApJ, 641, L45 [NASA ADS] [CrossRef] [Google Scholar]
- Krumholz, M. R., Bate, M. R., Arce, H. G., et al. 2014, Protostars and Planets VI (Tucson, AZ: Arizona State University), 243 [Google Scholar]
- Kwon, W., Looney, L. W., Crutcher, R. M., & Kirk, J. M. 2006, ApJ, 653, 1358 [NASA ADS] [CrossRef] [Google Scholar]
- Lee, K. I., Dunham, M. M., Myers, P. C., et al. 2016, ApJ, 820, L2 [NASA ADS] [CrossRef] [Google Scholar]
- Maret, S., Ceccarelli, C., Caux, E., et al. 2004, A&A, 416, 577 [NASA ADS] [CrossRef] [EDP Sciences] [Google Scholar]
- Maret, S., Belloche, A., Maury, A. J., et al. 2014, A&A, 563, L1 [NASA ADS] [CrossRef] [EDP Sciences] [Google Scholar]
- Mathews, G. S., Klaassen, P. D., Juhász, A., et al. 2013, A&A, 557, A132 [NASA ADS] [CrossRef] [EDP Sciences] [Google Scholar]
- Mottram, J. C., Hoare, M. G., Davies, B., et al. 2011, ApJ, 730, L33 [NASA ADS] [CrossRef] [Google Scholar]
- Mottram, J. C., van Dishoeck, E. F., Schmalzl, M., et al. 2013, A&A, 558, A126 [NASA ADS] [CrossRef] [EDP Sciences] [Google Scholar]
- Mottram, J. C., van Dishoeck, E. F., Kristensen, L. E., et al. 2017, A&A, 600, A99 [NASA ADS] [CrossRef] [EDP Sciences] [Google Scholar]
- Müller, H. S. P., Klaus, T., & Winnewisser, G. 2000, A&A, 357, L65 [NASA ADS] [Google Scholar]
- Murillo, N. M., Bruderer, S., van Dishoeck, E. F., et al. 2015, A&A, 579, A114 [NASA ADS] [CrossRef] [EDP Sciences] [Google Scholar]
- Murillo, N. M., van Dishoeck, E. F., Tobin, J. J., & Fedele, D. 2016, A&A, 592, A56 [NASA ADS] [CrossRef] [EDP Sciences] [Google Scholar]
- Murillo, N. M., van Dishoeck, E. F., van der Wiel, M. H. D., et al. 2018, A&A, 617, A120 [NASA ADS] [CrossRef] [EDP Sciences] [Google Scholar]
- Nagy, Z., Ossenkopf, V., Van der Tak, F. F. S., et al. 2015, A&A, 578, A124 [NASA ADS] [CrossRef] [EDP Sciences] [Google Scholar]
- Nisini, B., Santangelo, G., Giannini, T., et al. 2015, ApJ, 801, 121 [NASA ADS] [CrossRef] [EDP Sciences] [Google Scholar]
- Nyström, O., Lapkin, I., Desmaris, V., et al. 2009, J. Infrared Millim. Terahertz Waves, 30, 746 [CrossRef] [Google Scholar]
- Offner, S. S. R., Kratter, K. M., Matzner, C. D., Krumholz, M. R., & Klein, R. I. 2010, ApJ, 725, 1485 [NASA ADS] [CrossRef] [Google Scholar]
- Okabayashi, T., & Tanimoto, M. 1993, J. Chem. Phys., 99, 3268 [NASA ADS] [CrossRef] [Google Scholar]
- Padovani, M., Walmsley, C. M., Tafalla, M., Galli, D., & Müller, H. S. P. 2009, A&A, 505, 1199 [NASA ADS] [CrossRef] [EDP Sciences] [Google Scholar]
- Palau, A., Ballesteros-Paredes, J., Vázquez-Semadeni, E., et al. 2015, MNRAS, 453, 3785 [NASA ADS] [CrossRef] [Google Scholar]
- Palau, A., Walsh, C., Sánchez-Monge, Á., et al. 2017, MNRAS, 467, 2723 [NASA ADS] [Google Scholar]
- Persson, M. V., Jørgensen, J. K., & van Dishoeck E. F. 2012, A&A, 541, A39 [NASA ADS] [CrossRef] [EDP Sciences] [Google Scholar]
- Pilbratt, G. L., Riedinger, J. R., Passvogel, T., et al. 2010, A&A, 518, L1 [CrossRef] [EDP Sciences] [Google Scholar]
- Plunkett, A. L., Arce, H. G., Corder, S. A., et al. 2013, ApJ, 774, 22 [NASA ADS] [CrossRef] [Google Scholar]
- Pokhrel, R., Myers, P. C., Dunham, M. M., et al. 2018, ApJ, 853, 5 [NASA ADS] [CrossRef] [Google Scholar]
- Sadavoy, S. I., & Stahler, S. W. 2017, MNRAS, 469, 3881 [NASA ADS] [CrossRef] [Google Scholar]
- Safron, E. J., Fischer, W. J., Megeath, S. T., et al. 2015, ApJ, 800, L5 [NASA ADS] [CrossRef] [Google Scholar]
- San José-García, I., Mottram, J. C., Kristensen, L. E., et al. 2013, A&A, 553, A125 [NASA ADS] [CrossRef] [EDP Sciences] [Google Scholar]
- Sastry, K. V. L. N., Helminger, P., Charo, A., Herbst, E., & De Lucia F. C. 1981, ApJ, 251, L119 [NASA ADS] [CrossRef] [Google Scholar]
- Schöier, F. L., van der Tak, F. F. S., van Dishoeck, E. F., & Black, J. H. 2005, A&A, 432, 369 [NASA ADS] [CrossRef] [EDP Sciences] [Google Scholar]
- Scholz, A., Froebrich, D., & Wood, K. 2013, MNRAS, 430, 2910 [NASA ADS] [CrossRef] [Google Scholar]
- Segura-Cox, D. M., Harris, R. J., Tobin, J. J., et al. 2016, ApJ, 817, L14 [NASA ADS] [CrossRef] [Google Scholar]
- Sicilia-Aguilar, A., Henning, T., Linz, H., et al. 2013, A&A, 551, A34 [NASA ADS] [CrossRef] [EDP Sciences] [Google Scholar]
- Spaans, M., Hogerheijde, M. R., Mundy, L. G., & van Dishoeck E. F. 1995, ApJ, 455, L167 [NASA ADS] [Google Scholar]
- Spezzano, S., Tamassia, F., Thorwirth, S., et al. 2012, ApJS, 200, 1 [NASA ADS] [CrossRef] [Google Scholar]
- Stamatellos, D., & Whitworth, A. P. 2009, MNRAS, 392, 413 [Google Scholar]
- Tan, J. C., Kong, S., Butler, M. J., Caselli, P., & Fontani, F. 2013, ApJ, 779, 96 [NASA ADS] [CrossRef] [Google Scholar]
- Tobin, J. J., Kratter, K. M., Persson, M. V., et al. 2016a, Nature, 538, 483 [NASA ADS] [CrossRef] [Google Scholar]
- Tobin, J. J., Looney, L. W., Li, Z.-Y., et al. 2016b, ApJ, 818, 73 [NASA ADS] [CrossRef] [Google Scholar]
- van der Tak, F. F. S., van Dishoeck, E. F., Evans, II, N. J., & Blake, G. A. 2000, ApJ, 537, 283 [NASA ADS] [CrossRef] [Google Scholar]
- van der Tak, F. F. S., Black, J. H., Schöier, F. L., Jansen, D. J., & van Dishoeck E. F. 2007, A&A, 468, 627 [NASA ADS] [CrossRef] [EDP Sciences] [Google Scholar]
- van Dishoeck, E. F., Kristensen, L. E., Benz, A. O., et al. 2011, PASP, 123, 138 [NASA ADS] [CrossRef] [Google Scholar]
- van Kempen, T. A., van Dishoeck, E. F., Güsten, R., et al. 2009, A&A, 501, 633 [NASA ADS] [CrossRef] [EDP Sciences] [Google Scholar]
- van Kempen, T. A., Kristensen, L. E., Herczeg, G. J., et al. 2010, A&A, 518, L121 [NASA ADS] [CrossRef] [EDP Sciences] [Google Scholar]
- Visser, R., Kristensen, L. E., Bruderer, S., et al. 2012, A&A, 537, A55 [NASA ADS] [CrossRef] [EDP Sciences] [Google Scholar]
- Visser, R., Bergin, E. A., & Jørgensen, J. K. 2015, A&A, 577, A102 [NASA ADS] [CrossRef] [EDP Sciences] [Google Scholar]
- Walker-Smith, S. L., Richer, J. S., Buckle, J. V., Hatchell, J., & Drabek-Maunder, E. 2014, MNRAS, 440, 3568 [NASA ADS] [CrossRef] [Google Scholar]
- Wang, K., Zhang, Q., Testi, L., et al. 2014, MNRAS, 439, 3275 [NASA ADS] [CrossRef] [Google Scholar]
- Whitehouse, S. C., & Bate, M. R. 2006, MNRAS, 367, 32 [NASA ADS] [CrossRef] [Google Scholar]
- Wiesenfeld, L., & Faure, A. 2013, MNRAS, 432, 2573 [NASA ADS] [CrossRef] [Google Scholar]
- Xu, L.-H., & Lovas, F. J. 1997, J. Phys. Chem. Ref. Data, 26, 17 [NASA ADS] [CrossRef] [Google Scholar]
- Yang, B., Stancil, P. C., Balakrishnan, N., & Forrey, R. C. 2010, ApJ, 718, 1062 [NASA ADS] [CrossRef] [Google Scholar]
- Yıldız, U. A., Kristensen, L. E., van Dishoeck, E. F., et al. 2012, A&A, 542, A86 [NASA ADS] [CrossRef] [EDP Sciences] [Google Scholar]
- Yıldız, U. A., Kristensen, L. E., van Dishoeck, E. F., et al. 2013, A&A, 556, A89 [NASA ADS] [CrossRef] [EDP Sciences] [Google Scholar]
- Yıldız, U. A., Kristensen, L. E., van Dishoeck, E. F., et al. 2015, A&A, 576, A109 [NASA ADS] [CrossRef] [EDP Sciences] [Google Scholar]
Coevality is here used as defined in Murillo et al. (2016), which is the relative evolutionary classes of sources in a multiple protostellar system.
All Tables
All Figures
|
Fig. 1 Herschel PACS maps of the systems sampled in this work together with their respective SEDs. The 70 and 160 μm emissions are shown in color scale and contours, respectively. Each stamp spans a region of 80′′ × 80′′ and is centered on the position of the OTF maps, except for NGC 1333 IRAS 5 whose sources have a separation of 45.7′′. Red symbols represent the sources of a system and the positions of the APEX single-pointing observations. Circles denote systems with additional unresolved multiplicity. Diamonds indicate single sources within multiple protostellar systems. Crosses indicate single protostars. The SEDs are overlaid on the average SEDs from Enoch et al. (2009) for reference (dashed lines), with early Class 0 (red), late Class 0, early Class I, late Class I, and Class II (gray). |
| In the text | |
|
Fig. 2 APEX single pointing observations of DCO+, DCN, SO, CH3OH, and HNC. Except for DCO+ 3–2 and HNC, the spectra are multiplied by a factor of 3 to make the features more prominent. The spectra for the wide multiple systems are averaged for all the sources, except for NGC 1333 IRAS 5. The vertical blue line marks the systemic velocity. |
| In the text | |
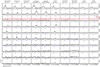 |
Fig. 3 Same as Fig. 2 but for c-C3H2, C2 H, and H2 CO. |
| In the text | |
|
Fig. 4 Peak intensities of the observed molecular lines compared to the envelope mass (M⊙) of each systems. The dashed lines are linear fits to the data for the cases where a correlation is found. Circles, diamonds, and stars show single, close binary, and wide multiple protostellar systems, respectively. We note that the more massive envelopes show an increase in the peak intensities of DCO+ and the low-lying transition of H2CO, which trace cold gas in the envelope. Molecules tracing warm gas have similar peak intensities regardless of envelope mass. |
| In the text | |
|
Fig. 5 Peak intensities of the observed molecular lines compared to the bolometric luminosity Lbol (L⊙) of each system. The dashed lines are linear fits to the data for the cases where a correlation is found. Circles, diamonds, and stars show single, close binary, and wide multiple protostellar systems, respectively. C2 H and c-C3H2 show somewhat higher peak intensities in systems with relatively higher luminosities. |
| In the text | |
|
Fig. 6 Calculated line ratios for c-C3H2, H2 CO, DCO+, and 13CO. The black lines show the modeled ratios assuming a column density of 1012 cm−2 for c-C3 H2, H2 CO, and DCO+, and 1016 cm−2 for 13CO. For the 13CO 6–5/3–2 and 6–5/4–3 panels, the two lower lines show the 0.02 and 0.04 ratios. The shaded areas show the results for the gas temperature calculations and adopted H2 density range for individual systems: L1448N (cyan), NGC 1333 SVS 13 (blue), NGC 1333 IRAS 7 (light blue), NGC 1333 IRAS 1 or IRAS 03292+3039 (gray), and NGC 1333 IRAS 5 Per52 or NGC 1333 SK1 (red). |
| In the text | |
|
Fig. 7 Calculated molecular line ratios of c-C3H2 (top row), H2CO (second row), DCO+ (third row) and 13CO (bottom row) compared to the system parameters bolometric luminosity Lbol (left column), envelope mass Menv (middle column), and the mass to luminosity ratio Menv∕Lbol (right column). The black and red dashed lines in the top row are linear fits to the data for the 6–5/33,0–22,1 and 51,4–42,3/33,0–22,1 ratios, respectively. Circles, diamonds, and stars show single, close binary, and wide multiple protostellar systems, respectively. The c-C3H2 ratios appear to be somewhat related to luminosity, whereas the ratios from H2 CO and DCO+ are constantregardless of system parameter. |
| In the text | |
|
Fig. 8 13CO ratio stacked histogram including JCMT and Herschel data from Yıldız et al. (2013; top row) and this work (bottom row). Upper limits are shown in gray. Ratios from Yıldız et al. (2013) are for the systems in the Water In Star-forming regions with Herschel (WISH) key project (van Dishoeck et al. 2011), which do not overlap with the sample studied in this work. The black dashed line shows a Gaussian distribution fit to the total sample of 13CO ratios. |
| In the text | |
|
Fig. 9 Number of line detections (panel a), envelope mass Menv (panel b), bolometric luminosity Lbol (panel c), and envelope mass to luminosity ratio Menv/Lbol (panel d) of each system in our sample compared to the region, clustered (circles) or non-clustered (diamonds), and system type. NGC 1333 IRAS 5 is considered here as two single protostellar systems, Per63 and Per52. |
| In the text | |
|
Fig. A.1 Spectra for the individual sources of NGC 1333 IRAS 7. We note that some spectra are multiplied by a factor of three in order to enhance the line emission features. The spectra of Per21 and Per49 are offset by 1.3 and 2.6 K from that of Per18 for clarity. |
| In the text | |
|
Fig. B.1 13CO spectra observed with JCMT (3–2), APEX (6–5), and Herschel HIFI (10–9). The spectra of JCMT and APEX are smoothed to a resolution of 19.25′′, the HPBW of the HIFI observations. The short blue lines at the top of each plot indicate the systemic velocity of the system. We note that the 13CO 4–3 and 10–9 spectra are multiplied by a factor of 3 and 15, respectively. The 6–5 spectra for NGC 1333 IRAS 1 is also multiplied by a factor of 3. |
| In the text | |
|
Fig. B.2 Peak intensities of the observed molecular lines compared to the envelope mass to luminosity ratio of each system. Circles, diamonds, and stars show single, close binary, and wide multiple protostellar systems, respectively. |
| In the text | |
Current usage metrics show cumulative count of Article Views (full-text article views including HTML views, PDF and ePub downloads, according to the available data) and Abstracts Views on Vision4Press platform.
Data correspond to usage on the plateform after 2015. The current usage metrics is available 48-96 hours after online publication and is updated daily on week days.
Initial download of the metrics may take a while.