Fig. 4
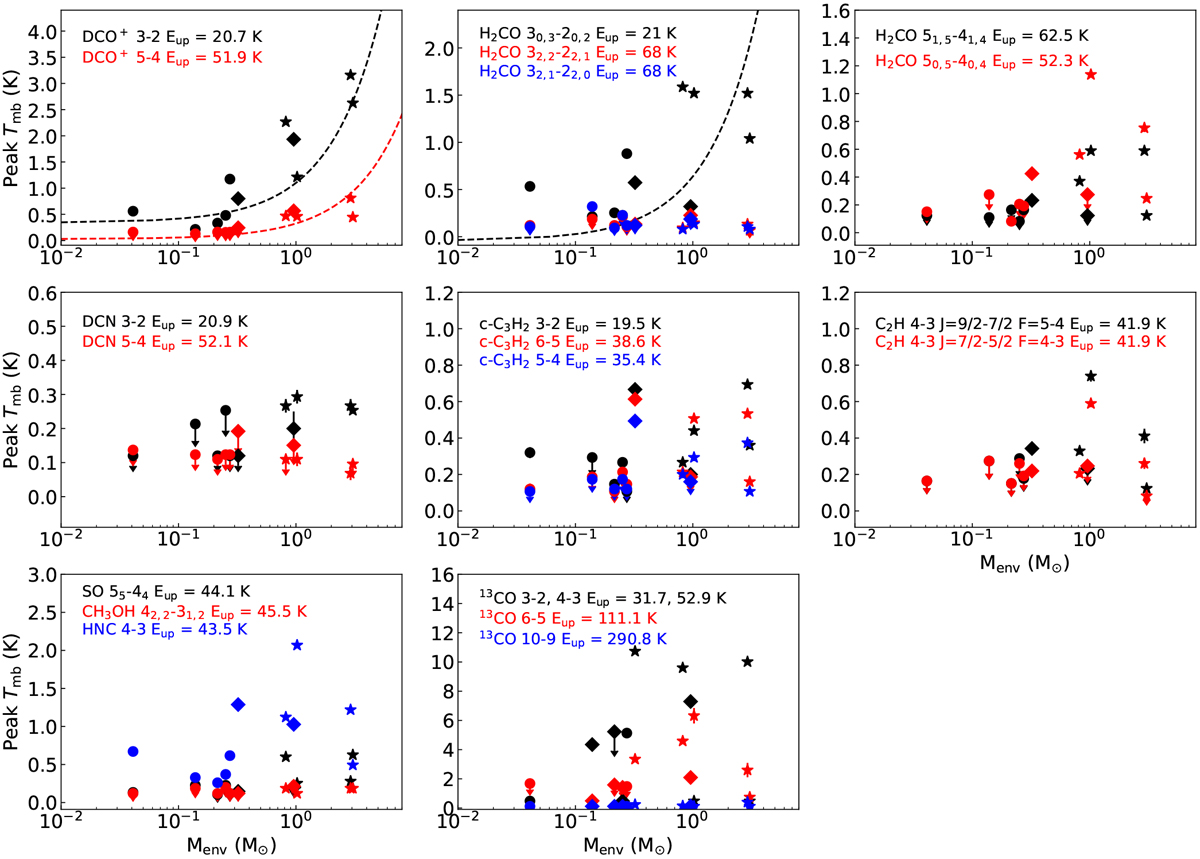
Peak intensities of the observed molecular lines compared to the envelope mass (M⊙) of each systems. The dashed lines are linear fits to the data for the cases where a correlation is found. Circles, diamonds, and stars show single, close binary, and wide multiple protostellar systems, respectively. We note that the more massive envelopes show an increase in the peak intensities of DCO+ and the low-lying transition of H2CO, which trace cold gas in the envelope. Molecules tracing warm gas have similar peak intensities regardless of envelope mass.
Current usage metrics show cumulative count of Article Views (full-text article views including HTML views, PDF and ePub downloads, according to the available data) and Abstracts Views on Vision4Press platform.
Data correspond to usage on the plateform after 2015. The current usage metrics is available 48-96 hours after online publication and is updated daily on week days.
Initial download of the metrics may take a while.