Fig. 8
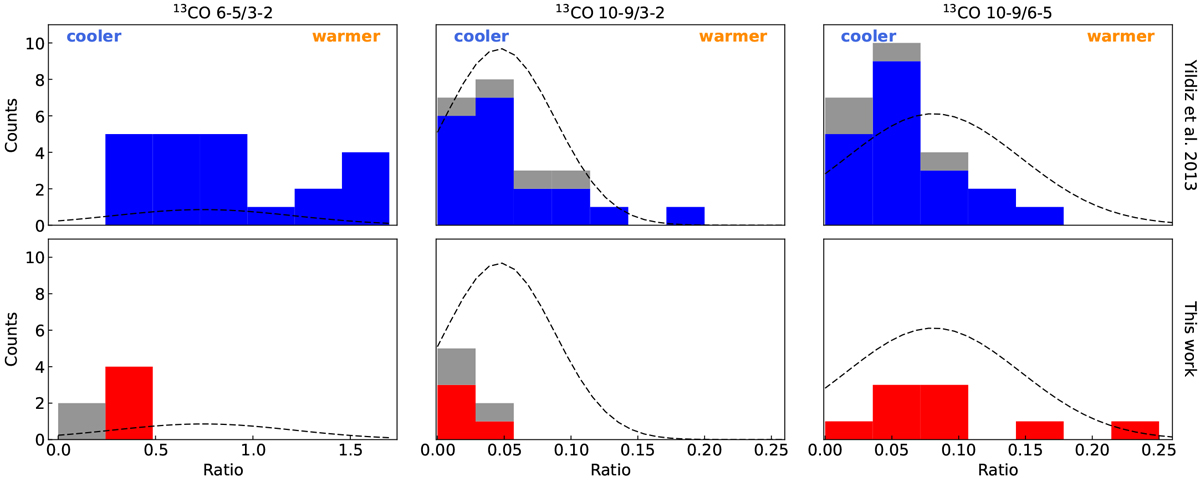
13CO ratio stacked histogram including JCMT and Herschel data from Yıldız et al. (2013; top row) and this work (bottom row). Upper limits are shown in gray. Ratios from Yıldız et al. (2013) are for the systems in the Water In Star-forming regions with Herschel (WISH) key project (van Dishoeck et al. 2011), which do not overlap with the sample studied in this work. The black dashed line shows a Gaussian distribution fit to the total sample of 13CO ratios.
Current usage metrics show cumulative count of Article Views (full-text article views including HTML views, PDF and ePub downloads, according to the available data) and Abstracts Views on Vision4Press platform.
Data correspond to usage on the plateform after 2015. The current usage metrics is available 48-96 hours after online publication and is updated daily on week days.
Initial download of the metrics may take a while.