Fig. 1
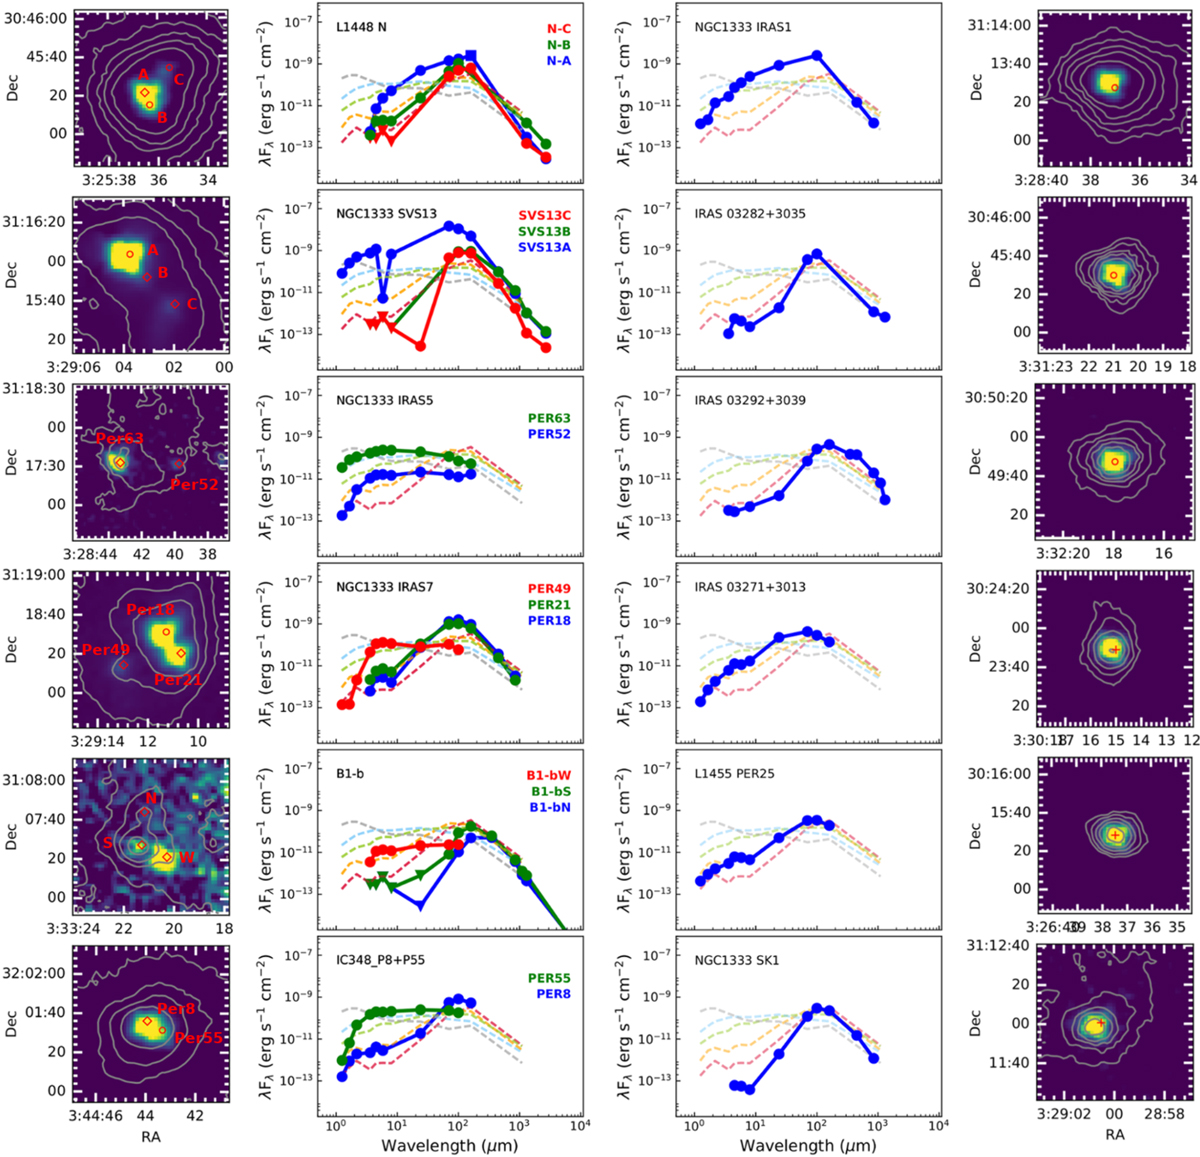
Herschel PACS maps of the systems sampled in this work together with their respective SEDs. The 70 and 160 μm emissions are shown in color scale and contours, respectively. Each stamp spans a region of 80′′ × 80′′ and is centered on the position of the OTF maps, except for NGC 1333 IRAS 5 whose sources have a separation of 45.7′′. Red symbols represent the sources of a system and the positions of the APEX single-pointing observations. Circles denote systems with additional unresolved multiplicity. Diamonds indicate single sources within multiple protostellar systems. Crosses indicate single protostars. The SEDs are overlaid on the average SEDs from Enoch et al. (2009) for reference (dashed lines), with early Class 0 (red), late Class 0, early Class I, late Class I, and Class II (gray).
Current usage metrics show cumulative count of Article Views (full-text article views including HTML views, PDF and ePub downloads, according to the available data) and Abstracts Views on Vision4Press platform.
Data correspond to usage on the plateform after 2015. The current usage metrics is available 48-96 hours after online publication and is updated daily on week days.
Initial download of the metrics may take a while.