Fig. 5
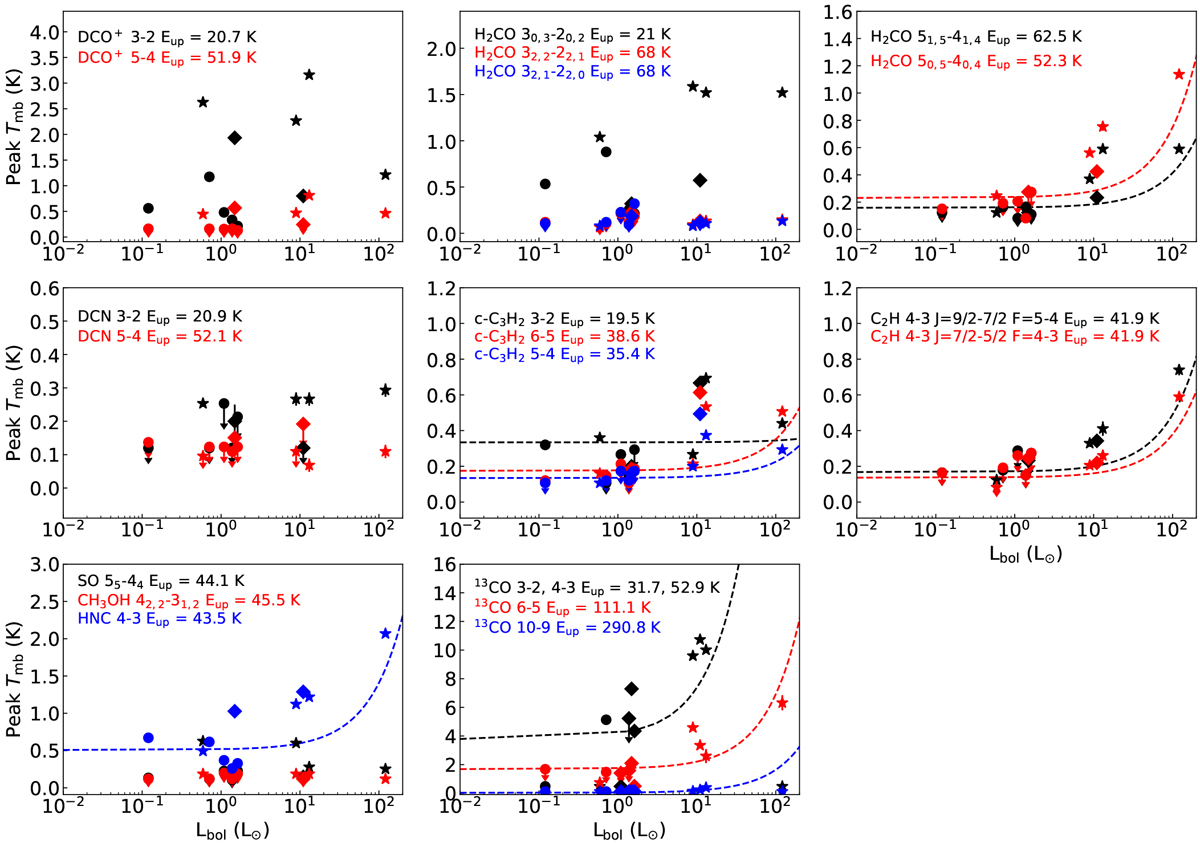
Peak intensities of the observed molecular lines compared to the bolometric luminosity Lbol (L⊙) of each system. The dashed lines are linear fits to the data for the cases where a correlation is found. Circles, diamonds, and stars show single, close binary, and wide multiple protostellar systems, respectively. C2 H and c-C3H2 show somewhat higher peak intensities in systems with relatively higher luminosities.
Current usage metrics show cumulative count of Article Views (full-text article views including HTML views, PDF and ePub downloads, according to the available data) and Abstracts Views on Vision4Press platform.
Data correspond to usage on the plateform after 2015. The current usage metrics is available 48-96 hours after online publication and is updated daily on week days.
Initial download of the metrics may take a while.