| Issue |
A&A
Volume 557, September 2013
|
|
|---|---|---|
| Article Number | A18 | |
| Number of page(s) | 21 | |
| Section | Extragalactic astronomy | |
| DOI | https://doi.org/10.1051/0004-6361/201321772 | |
| Published online | 14 August 2013 | |
Molecular hydrogen in the damped Lyman α system towards GRB 120815A at z = 2.36⋆,⋆⋆,⋆⋆⋆
1 Dark Cosmology Centre, Niels Bohr Institute, University of Copenhagen, Juliane Maries Vej 30, 2100 København Ø, Denmark
e-mail: tom@dark-cosmology.dk
2 European Southern Observatory, Alonso de Córdova 3107, Vitacura, Casilla 19001, Santiago 19, Chile
3 Department of Particle Physics and Astrophysics, Faculty of Physics, Weizmann Institute of Science, 76100 Rehovot, Israel
4 Thüringer Landessternwarte Tautenburg, Sternwarte 5, 07778 Tautenburg, Germany
5 Centre for Astrophysics and Cosmology, Science Institute, University of Iceland, Dunhagi 5, 107 Reykjavik, Iceland
6 Astronomical Institute Anton Pannekoek, University of Amsterdam, Science Park 904, 1098 XH Amsterdam, The Netherlands
7 GEPI-Observatoire de Paris, CNRS UMR 8111, Univ. Paris-Diderot, 5 Place Jules Janssen, 92190 Meudon, France
8 INAF, Osservatorio Astronomico di Brera, via E. Bianchi 46, 23807 Merate, Italy
9 American River College, Physics and Astronomy Dpt., 4700 College Oak Drive, Sacramento, CA 95841, USA
10 Instituto de Astrofísica de Andalucía (IAA-CSIC), Glorieta de la Astronomía s/n, 18008 Granada, Spain
11 INAF-Osservatorio Astronomico di Roma3, via Frascati 3, 00040 Monteporzio Catone, Italy
12 ASI-Science Data Centre, via Galileo Galilei, 00044 Frascati, Italy
13 Institute of Experimental and Applied Physics, Czech Technical University in Prague, Horska 3a/22, 128 00 Prague 2, Czech Republic
14 APC, Astroparticules et Cosmologie, Université Paris Diderot, CNRS/IN2P3, CEA/Irfu, Observatoire de Paris, Sorbonne Paris Cite, 10, rue Alice Domon et Leonie Duquet, 75205 Paris Cedex 13, France
15 Max-Planck-Institut für extraterrestrische Physik, Giessenbachstraße, 85748 Garching, Germany
16 Università degli studi di Milano-Bicocca, Piazza della Scienza 3, 20126 Milano, Italy
17 Pontificia Universidad Católica de Chile, Departamento de Astronomía y Astrofísica, Casilla 306, Santiago 22, Chile
18 Millennium Center for Supernova Science
19 Department of Physics and Astronomy, University of Leicester, University Road, Leicester, LE1 7RH, UK
Received: 25 April 2013
Accepted: 18 June 2013
We present the discovery of molecular hydrogen (H2), including the presence of vibrationally-excited H2* in the optical spectrum of the afterglow of GRB 120815A at z = 2.36 obtained with X-shooter at the VLT. Simultaneous photometric broad-band data from GROND and X-ray observations by Swift/XRT place further constraints on the amount and nature of dust along the sightline. The galactic environment of GRB 120815A is characterized by a strong DLA with log(N(H i)/cm-2) = 21.95 ± 0.10, prominent H2 absorption in the Lyman-Werner bands (log (N(H2)/cm-2) = 20.54 ± 0.13) and thus a molecular gas fraction log f(H2) = -1.14 ± 0.15. The distance d between the absorbing neutral gas and GRB 120815A is constrained via photo-excitation modeling of fine-structure and meta-stable transitions of Fe ii and Ni ii to d = 0.5 ± 0.1 kpc. The DLA metallicity ([Zn/H] = -1.15 ± 0.12), visual extinction (AV ≲ 0.15 mag) and dust depletion ([Zn/Fe] = 1.01 ± 0.10) are intermediate between the values of well-studied, H2-deficient GRB-DLAs observed at high spectral resolution, and the approximately solar metallicity, highly-obscured and H2-rich GRB 080607 sightline. With respect to N(H i), metallicity, as well as dust-extinction and depletion, GRB 120815A is fairly representative of the average properties of GRB-DLAs. This demonstrates that molecular hydrogen is present in at least a fraction of the more typical GRB-DLAs, and H2 and H2* are probably more wide-spread among GRB-selected systems than the few examples of previous detections would suggest. Because H2* transitions are located redwards of the Lyman α absorption, H2* opens a second route for positive searches for molecular absorption also in GRB afterglows at lower redshifts and observed at lower spectral resolution. Further detections of molecular gas in GRB-DLAs would allow statistical studies, and, coupled with host follow-up and sub-mm spectroscopy, provide unprecedented insights into the process and conditions of star-formation at high redshift.
Key words: galaxies: ISM / gamma-ray burst: individual: GRB 120815A / galaxies: high-redshift / ISM: molecules / dust, extinction
Based on observations collected at the European Southern Observatory, Paranal, Chile, Program ID: 089.A-0067(B).
Appendices are available in electronic form at http://www.aanda.org
The flux-calibrated average spectrum is only available at the CDS via anonymous ftp to cdsarc.u-strasbg.fr (130.79.128.5) or via http://cdsarc.u-strasbg.fr/viz-bin/qcat?J/A+A/557/A18
© ESO, 2013
1. Introduction
The formation of stars is tightly correlated with the presence of molecular hydrogen H2 (e.g., Shu et al. 1987; Blitz 1993; McKee & Ostriker 2007; Bigiel et al. 2008). In the local Universe, for example, star-formation proceeds quite exclusively in cold molecular clouds, and molecular gas is ubiquitous in the interior of the Galaxy (e.g., Savage et al. 1977; Dame et al. 2001) or the Magellanic Clouds (e.g., Tumlinson et al. 2002). Similarly, at higher redshift, the increased star-formation rates of non-merging, z ~ 1−2 galaxies are likely related to an elevated gas-mass fraction (e.g., Tacconi et al. 2010; Daddi et al. 2010). Direct detections of H2 beyond z ~ 0 are, however, challenging from the ground, and its presence and state at high redshift are most commonly inferred indirectly via tracers such as CO or HCN. The fact that these molecules have dipole moments makes them much more amenable to detection via mm/sub-mm spectroscopy, but inferences about H2 then rely on poorly-known conversion factors.
Because the absorption signatures of H2, the Lyman-Werner bands, are located bluewards of the Lyman α transition, H2 is most directly probed at z ≳ 2 through high-resolution spectroscopy1 of damped Lyman α (DLA) systems infront of quasi-stellar objects (QSOs) or γ-ray bursts (GRBs) (e.g., Ledoux et al. 2003). But even when probed in very high detail with QSO-DLAs, detections of molecular gas are scarce: H2, for example, was detected only along 13 out of 77 QSO sightlines in the sample of Noterdaeme et al. (2008), while observations of other molecules like HD (e.g., Varshalovich et al. 2001; Malec et al. 2010; Noterdaeme et al. 2011) or CO (e.g., Srianand et al. 2008; Noterdaeme et al. 2009, 2011) remain limited to very few systems at high redshift.
A noteworthy difference between the DLAs of long2 GRBs and QSOs lies within their different physical nature and selection methods. QSO-DLAs are intervening systems discovered in optical spectra of e.g., color–selected QSOs because of their large H i cross section (e.g., Prochaska et al. 2005; Noterdaeme et al. 2012b). In contrast, GRB-DLAs are located inside the star-forming host galaxy and are initially localized via the GRB’s γ-ray and/or X-ray emission (e.g., Fynbo et al. 2008, and references therein). The GRB’s high energy emission is virtually unaffected by dust obscuration. Afterglows can further be, albeit for a short time, much more luminous in the optical wavelength range (e.g., Bloom et al. 2009) than QSOs before they fade rapidly on timescales of hours or days. A proxy for the environments which GRB-DLAs probe is the distribution of visual extinctions derived from afterglow data for an unbiased sample of Swift GRBs: 1/2 of all GRBs are located behind a dust column with AV ≲ 0.2 mag, ≈30% show 0.2 mag < AV ≲ 1 mag, and 20% of all Swift GRB have an AV > 1 mag (Greiner et al. 2011; Covino et al. 2013). GRBs offer thus the potential to probe environments from diffuse to translucent gas clouds.
Molecular gas remained elusive for a long time in GRB-DLAs (e.g., Tumlinson et al. 2007; Ledoux et al. 2009), and has now been unequivocally detected only in the low-resolution spectra of the afterglows of one (GRB 080607, Prochaska et al. 2009) and possibly a second (GRB 060206, Fynbo et al. 2006; Thöne et al. 2008) GRB-DLA. Given the very high column densities of gas regularly detected in GRB afterglow spectra (e.g., Jensen et al. 2001; Hjorth et al. 2003a; Vreeswijk et al. 2004; Jakobsson et al. 2006) and their direct link to star-formation (e.g., Galama et al. 1998; Hjorth et al. 2003b), this low detection rate of H2 was initially quite surprising. Because the material probed by GRB-DLAs is in many cases located at distances of several hundred parsecs or more from the γ-ray burst (e.g., Vreeswijk et al. 2007, 2011; D’Elia et al. 2009; Sheffer et al. 2009), the afterglow’s UV flux itself will not photo-dissociate the H2 of the GRB-DLA (e.g., Tumlinson et al. 2007; Ledoux et al. 2009). A genuine deficit of molecular hydrogen in GRB-DLAs as compared to QSO-DLAs for example, would instead indicate that H2 is absent already prior to the burst. This could be caused by substantial background UV-radiation fields in their host galaxies, which are capable of dissociating hydrogen molecules efficiently (e.g., Whalen et al. 2008).
The incidence of H2 along QSO sightlines (e.g., Levshakov & Varshalovich 1985; Srianand & Petitjean 1998; Petitjean et al. 2000) is positively correlated with metallicity and dust depletion (Ledoux et al. 2003; Petitjean et al. 2006; Noterdaeme et al. 2008). Dust absorbs photons in the rest-frame ultra-violet (UV) very efficiently. In UV-steep reddening laws similar to the one observed towards the Small Magellanic Cloud (SMC) and often along GRB sightlines, for example, the ratio between the extinction in the Lyman-Werner bands and visual extinction A1000 Å/AV exceeds a factor of 6. Even small values of AV thus provide considerable suppression of the observed flux in the rest-frame UV. The small sample (~10–15 events) of GRB afterglows observed with echelle spectrographs with a very high resolving power (R ≳ 40 000) is thus restricted to the most luminous and least obscured end of the afterglow brightness distribution. Consequently, the best studied GRB-selected absorbers are typically those with comparatively low dust and metal content (Prochaska et al. 2007a; D’Elia et al. 2009, 2010; De Cia et al. 2012). Given their low metal abundance and dust depletion, the previous non-detections of H2 in GRB-DLAs observed at high spectral resolution are thus consistent with QSO-DLA number statistics (Ledoux et al. 2009).
The full sample of GRB afterglows, including those observed with lower spectral resolution (e.g., Fynbo et al. 2009), however, is diverse and includes direct evidence for metal-rich gas (e.g., Watson et al. 2006; Prochaska et al. 2007b; Elíasdóttir et al. 2009; Savaglio et al. 2012). In addition significant dust-depletion factors (e.g., Savaglio & Fall 2004; Thöne et al. 2013; Hartoog et al. 2013), large amounts of reddening (e.g., Greiner et al. 2011; Zafar et al. 2012) and strong metal lines (e.g., Savaglio et al. 2003; Christensen et al. 2011; de Ugarte Postigo et al. 2012) are regularly detected towards GRBs.
Most GRB-DLAs indeed show log (N(Fe)dust/cm-2) > 14.7 (De Cia et al. 2013), which is the critical value above which molecular hydrogen has been observed towards QSO (Noterdaeme et al. 2008). GRB-DLAs are thus promising sight-lines to detect and analyze molecules and their associated gas at high redshift. The detection of H2, however, has proven to be difficult for GRB-DLAs: observationally, it is much easier to disentangle H2 transitions from the Lyα forest with high spectral resolution and signal-to-noise ratio (S/N) in the rest-frame UV, favoring bright targets. Physically, however, a significant column density of H2 is present in environments that are likely metal-rich and dust-depleted (and are thus probed by more obscured, UV-faint afterglows).
In fact, it required the exceptional event of GRB 080607 to clearly detect both H2 and CO along a GRB sightline. GRB 080607 had one of the intrinsically most luminous afterglows ever discovered (Perley et al. 2011), and was observed spectroscopically only minutes after the initial trigger when the transient was still bright (Prochaska et al. 2008b). The GRB 080607 afterglow spectrum is characterized by large amounts of neutral gas (log (N(H i)/cm-2) ~ 22.7) around solar metallicity, a very high dust content of AV ~ 3.3 mag and evidence for a 2175 Å feature (Prochaska et al. 2009; Perley et al. 2011). It further exhibits molecular absorption of H2 and CO (Prochaska et al. 2009) including vibrationally-excited H (Sheffer et al. 2009) at z = 3.04, the first report of H absorption at high redshift. Excited H2 absorption lines are rarely detected towards bright stars in the Galaxy (Federman et al. 1995; Meyer et al. 2001), but more commonly in emission in IR spectra of the central galaxies of galaxy (proto)-clusters (e.g., Donahue et al. 2000; Johnstone et al. 2007; Ogle et al. 2012) or active galactic nuclei (e.g., Thompson et al. 1978; Veilleux et al. 1997; Guillard et al. 2012).
In this work, we present the detection of molecular hydrogen in the DLA of GRB 120815A at z = 2.36. Its afterglow was observed with X-shooter in the spectral range from the UV-cutoff to 2.5 μm at medium resolving power (R ~ 5000 − 10 000), providing both the S/N and spectral sampling necessary to investigate the physical conditions in the GRB-DLA. Our spectroscopic data are complemented by simultaneous optical/near-infrared (NIR) photometry and X-ray observations, providing strong constraints on the reddening along the sightline.
Throughout the paper we quote errors at the 1σ confidence level, report magnitudes in the AB system, and provide wavelengths and redshifts in a vacuum, heliocentric reference frame. The atomic data used in this work are those of Morton (2003) with few exceptions3. Solar reference abundances were taken from Table 1 of Asplund et al. (2009) and follow the suggestions of Lodders et al. (2009) whether abundances from the solar photosphere, meteorites or the average between the two values are used.
2. Observations and data reduction
2.1. Swift observations
The Burst Alert Telescope (BAT; Barthelmy et al. 2005) onboard the Swift satellite (Gehrels et al. 2004) triggered on the long and soft GRB 120815A on 2012-08-15 at T0 = 02:13:58 UTC (Pagani et al. 2012; Markwardt et al. 2012). Swift’s two narrow-field X-ray and UV/optical instruments, the X-ray Telescope (XRT; Burrows et al. 2005) and Ultra-Violet Optical Telescope (UVOT; Roming et al. 2005) started observing the GRB field approximately 2.7 ks after the trigger, and detected the fading afterglow associated with GRB 120815A (Kennea et al. 2012; Holland & Pagani 2012). X-ray data were retrieved from the XRT online repository (Evans et al. 2007, 2009), and analyzed in XSPEC v12.7.0 (Arnaud 1996). Due to the faintness of the afterglow at the time of the observation, imaging data from UVOT have limited S/N, are not constraining and are thus not used in the further analysis.
2.2. GROND optical/NIR photometry
The Gamma-Ray burst Optical/NIR Detector (GROND; Greiner et al. 2007, 2008) initiated automatic follow-up observations of GRB 120815A on 2012-08-15 02:14:24 UTC, with the first data taken ~150 s after T0 (Sudilovsky et al. 2012). Simultaneous imaging in four optical (g′r′i′z′) and three NIR (JHKs) filters was performed continuously until 05:47 UTC. Our analysis of the GROND data focuses on the broad-band spectral energy distribution (SED) and absolute flux scale contemporaneously with the X-ray (Sect. 2.1) and optical/NIR spectroscopy (Sect. 2.3), as well as the afterglow’s UV-photon yield for the modeling of the excited absorption lines (Sect. 4.1). A detailed discussion and theoretical interpretation of the afterglow multi-color light curve is beyond the scope of this work.
GROND data were reduced and analysed within pyraf/IRAF (Tody 1993) in a standard manner (Krühler et al. 2008). The transient is detected with high S/N in each filter. Using USNO field stars as astrometric reference, we derive a position for GRB 120815A of RA (J2000) = 18:15:49.83, Dec (J2000) = −52:07:52.5 with an absolute accuracy of 0 3 in each coordinate. The photometric solution was tied to the magnitudes of stars from the SDSS catalog (Aihara et al. 2011) in g′r′i′z′ observed directly before and after the GRB field, and 2MASS field stars (Skrutskie et al. 2006) in JHKs. Based on the scatter of individual calibration stars we estimate our absolute photometric accuracy to be 4% in g′r′i′z′, 5% in J and H and 8% in Ks, dominating the total photometric error. The GROND data are reported in Tables A.1 and A.2, and the multi-color light curves that were used as input to the photo-excitation modeling are shown in Fig. A.1.
2.3. X-shooter optical/NIR spectroscopy
Spectroscopic observations of the GRB 120815A afterglow in the wavelength range between 3000 and 24 800 Å commenced on 2012-08-15 at 03:55 UT (6.06 ks after the BAT trigger) with the cross-dispersed echelle spectrograph X-shooter (Vernet et al. 2011) mounted at ESO’s Very Large Telescope (VLT) UT2. They consisted of four nodded exposures in the sequence ABBA with exposure times of 600 s each, taken simultaneously in X-shooter’s ultraviolet/blue (UVB), visible (VIS) and near-infrared (NIR) arms. The average airmass was 1.37 and the mid-time of the stacked exposure is 04:17:50 UTC (7.43 ks after the BAT trigger or 37 min in the rest-frame at z = 2.36). Sky conditions were clear and dark with a median seeing of 06 during the observations. X-shooter spectroscopy was performed with slit-widths of 10, 09 and 09 in the UVB, VIS and NIR arm, respectively. The resolving power R = λ/Δλ was derived from unsaturated, single telluric lines in the red arms, and scaled to the UVB arm using a standard dependence of seeing with wavelength (see Fynbo et al. 2011, for details) and tabulated values4 of R for different X-shooter slit widths. This results in values of R ~ 6000, 10 400, 6200 for the UVB/VIS and NIR arm, respectively. Because of the good seeing, this is somewhat better than the nominal values for the given slit widths derived from arclamp frames (R = 5380, 8800, 5300).
X-shooter data were reduced with the ESO/X-shooter pipeline v1.5.0 (Goldoni et al. 2006), rectifying the data on an output grid with a dispersion of 0.15 Å per pixel in the UVB, 0.13 Å/pixel in the VIS and 0.5 Å/pixel in the NIR arm, respectively. The wavelength-to-pixel conversion was chosen as a compromise between slightly oversampling X-shooter’s spectral resolution, while at the same time limiting the correlation of adjacent pixels in the rectification step. The wavelength solution was obtained against arc-lamp frames in each arm, leaving residuals with a root mean square of 0.03/0.04/0.3 Å, respectively, corresponding to 3/2/5 km s-1 at 4000/7500/16 500 Å. Given the projected proximity of the GRB to the USNO star 0378-0977505 and to maximize S/N, each of the four frames in the individual arms was reduced separately, with the sky estimated in regions free of source counts. The sky region is limited because of the short slit length of X-shooter (11″) and artifacts at the order edges, affecting the accuracy and quality of the sky-subtraction in the NIR arm.
The spectra were extracted from the combined frame in a variance-weighted method, taking into account the wavelength-dependence of the centroid and width of the trace. To estimate the error in the combined spectrum, we used the noise model of the X-shooter pipeline for each of the four individual frames propagated through the stacking and extraction process. The median S/N per resolution element Δλ is ~15 (4200 − 5700 Å), ~16 (5700 − 10 000 Å), and ~9/14/16/15 in Y/J/H/K.
Flux-calibration was performed against the spectro-photometric standard LTT7987 observed starting on 2012-08-15 at 05:00 UTC. The atmospheric dispersion correctors of X-shooter in the UVB and VIS arm were switched off after a technical problem. Because of the substantial airmass during our observations we expect some chromatic slit-loss in the data that we aim to correct via our afterglow model (see Sect. 3.1). The flux-calibrated X-shooter spectrum was fitted with a low-order polynomial (iteratively excluding the absorption lines), which yields the continuum level of the data. The ratio between continuum fit and afterglow model then provides wavelength-dependent matching factors over the whole spectral range of X-shooter, and thus an accurately flux-calibrated spectrum.
3. Results
3.1. Broad-band spectral energy distribution
We fitted the broad-band afterglow data from XRT and GROND under the assumption that the underlying afterglow flux is well represented by synchrotron emission and the afterglow is in the slow-cooling regime (see, e.g., Granot & Sari 2002) with the optical/X-ray energy range being above the afterglow’s characteristic synchrotron frequency. Single and broken power-law models were used, where the soft X-ray column density is attributed to two absorbers with solar5 metallicity: one Galactic held fixed at N(H)X = 8.6 × 1020 cm-2 (Kalberla et al. 2005), one intrinsic to the GRB host. The reddening in the optical/NIR wavelength range is modeled by extinction laws from the Magellanic Clouds and the Milky Way in the parametrization of Pei (1992).
All synchrotron models yield acceptable fits to the data, and there is mild degeneracy between the parameters, in particular in the case of a broken power-law continuum with a smooth turnover from low to high-energy spectral index. The statistically preferred fit (combined statistics6 of 302 for 367 d.o.f.) is obtained, however, with a single power-law extending from the NIR to the X-ray band. In the case of a broken power-law continuum the improvement in the fit is small (combined statistics of 299 for 366 d.o.f.), and the best-fit break energy is located at around 3 keV. With respect to the derived value of AV, the single and broken power-law fits are thus equivalent.
The SED fit with a single power-law is also consistent with the similar temporal evolution of the optical/NIR and X-ray afterglow light curves (see Fig. A.1). This provides strong support to the conclusion that both optical/NIR and X-ray data probe a common spectral range of the afterglow’s synchrotron radiation.
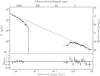 |
Fig. 1 NIR-to-X-ray spectral energy distribution and model for the afterglow of GRB 120815A at 7.3 ks after the trigger. Solid lines show the model including gas and dust absorption, while the dashed line illustrates the underlying synchrotron continuum emission. X-ray data have been binned to yield a S/N of at least 8 to enhance clarity. The g′-band photometry is not fitted, because this filter extends bluewards of the Lyα transition. |
The resulting NIR-to-X-ray SED with the single power-law model is shown in Fig. 1. Given the modest amount of reddening and inferred visual extinction AV, different extinction laws give comparable results. The best-fit is obtained in an SMC parametrization (χ2 = 2.9 for 5 d.o.f. in the relevant wavelength range), and there is no evidence for the presence of a 2175 Å dust feature (χ2 = 7.2 for LMC, and χ2 = 16.4 for MW extinction curves). The lack/weakness of a 2175 Å dust feature is corroborated by the X-shooter spectrum. While the spectral normalization and large-scale shape is set by our (model-dependent) flux calibration procedure, the inferred slit-loss is uniformly continuous over the full spectral range and does not obliterate spectral features of the size of the 2175 Å bump (FWHM ~2000 Å observed frame). When fitting the spectrum using an extinction law in the analytical form based on Fitzpatrick & Massa (1990, 2007), there is again no evidence for a 2175 Å dust feature. The c3 parameter of the Fitzpatrick & Massa (1990) extinction curve (representing the strength of the 2175 Å bump) is zero within errors. This result is similar to that derived from a sample of GRB afterglows with modest (⟨ AV ⟩ ~ 0.4 mag) dust obscuration (Schady et al. 2012) and consistent with the absence of diffuse interstellar bands (DIBs) in our spectrum (e.g., Cox et al. 2006; Welty et al. 2006). The λ6284 DIB is the only transition of the most prominent DIBs at z = 2.36 that is not located in a window of strong telluric absorption. We set a limit on its equivalent width of Wr(λ 6284) < 0.6 Å.
Our data do not constrain the total-to-selective reddening RV, and we report values based on the SMC value (RV = 2.93). Best-fit parameters in the single power-law, SMC case are AV = 0.15 ± 0.02 mag, N(H)X = (3.5 ± 0.2) × 1021 cm-2 at z = 2.36 and a spectral index of β = 0.78 ± 0.01, which are very typical values for GRB afterglows in general (e.g., Kann et al. 2006, 2010; Greiner et al. 2011). Also the ratio between X-ray absorption and SED-derived extinction is fully within the range typically measured for Swift GRBs (e.g., Schady et al. 2007, 2010; Nardini et al. 2010; Watson et al. 2013). LMC and MW models yield comparable values within errors for all parameters.
We caution and stress that these values are strictly upper limits to the host’s visual extinction and X-ray absorbing column, because of the presence of strong foreground absorbers (see Sect. 3.2.1), which contribute to both AV and N(H)X. The expected reddening introduced by the very strong Mg ii absorber at z = 1.539, for example, could alone be sufficient to explain the observed reddening in the data (e.g., Ménard et al. 2008). We will thus conservatively consider the derived values for AV and N(H)X from the broad-band SED as upper limits on the respective parameters in the GRB system in the following.
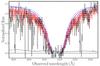 |
Fig. 2 X-shooter spectrum around the damped Lyα absorption. Black lines are the X-shooter data and noise level, both binned for clarity. The red-shaded region shows the fit to the damped Lyα absorption line using the combination of a Voigt profile with log (N(H i)/cm-2) = 21.95 ± 0.10 and the H |
3.2. Optical/NIR spectrum
The X-shooter spectrum of the afterglow of GRB 120815A (Figs. B.1–B.3) displays a multitude of absorption lines. They are interpreted as Lyα, Lyβ, different neutral, low and high-ionization metal lines, several fine-structure transitions, as well as absorption by molecular hydrogen including its vibrationally-excited transitions. The GRB redshift derived from these absorption lines, z = 2.358, was previously reported by Malesani et al. (2012). The hydrogen column density is log (N(H i)/cm-2) = 21.95 ± 0.10 (Fig. 2). Here we used the model of H (see Sect. 3.2.7), to estimate its influence on the DLA strength. In addition, emission from the [O iii](λ 5007) transition is also detected in the NIR arm of the spectrum (see Sect. 3.2.2, and Fig. 3).
3.2.1. Intervening systems
We identify five different intervening systems in the X-shooter spectrum that are characterized by at least one transition with Wobs > 1 Å. In detail, there is a very strong Mg ii absorber at z = 1.539 that also shows lines from various other metal transitions (e.g, Fe ii, Mg i, Al iii). Its rest-frame equivalent width of Wr(λ 2796) = 6.1 ± 0.2 Å makes it the strongest intervening Mg ii absorber yet observed towards a GRB (e.g., Ellison et al. 2006; Vergani et al. 2009). In addition, there are weaker systems at z = 1.693 (Wr(λ 2796) = 0.50 ± 0.03 Å) and z = 2.013 (Wr(λ 2796) = 0.48 ± 0.04 Å). Absorption from the C iv doublet is present at z = 2.000 (Wr(λ 1548) = 0.63 ± 0.04 Å) and z = 2.338 (Wr(λ 1548) = 0.43 ± 0.04 Å). The intervening systems will not be discussed further in this work.
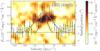 |
Fig. 3 One- and two-dimensional, afterglow-subtracted X-shooter spectrum centered around the location of [O iii](λ 5007) at z = 2.3586 (i.e., observed 16 820 Å). The one-dimensional spectrum (black data) fitted by a Gaussian (black line) is plotted against the left y-axis, while the scaling of the two-dimensional spectrum is shown by the color-bar on the right side of the plot. The two-dimensional spectrum has been smoothed by a Gaussian kernel with a FWHM of 1 pixel (0.5 Å) along the dispersion x-axis, and 2 pixel (i.e., 0 |
3.2.2. Emission lines
We used spectral point spread function subtraction (e.g. Møller 2000; Fynbo et al. 2010) of the afterglow light to search for rest-frame optical emission lines in the X-shooter data. In the afterglow-subtracted spectrum (see Fig. 3), we detect [O iii](λ 5007) in emission with a significance of 6σ. None of the emission lines of Lyα, Hα, Hβ, [O ii], [O iii](λ 4959), [N ii] or He ii(λ 4686) are robustly detected. The Gaussian centroid of [O iii](λ 5007) provides a systemic redshift of z = 2.3586 ± 0.0001 for the galaxy hosting GRB 120815A. The line width is relatively well resolved in velocity space, and from the observed full-width-half-maximum of FWHM ~95 km s-1, we derive a velocity dispersion  after correcting for the instrumental resolution, and taking into account its uncertainty7.
Along the spatial axis, the emission from [O iii](λ 5007) is unresolved: the FWHM of a Gaussian fit to the [O iii]-line profile is fully consistent with the one of the afterglow continuum emission. Also the respective spatial profiles after dividing the line in a red and blue part are similar within 1.8 standard deviations. Lacking a measurement of the visible extent of the GRB host, no dynamical mass can be derived here. A comparison to GRB hosts (e.g., Savaglio et al. 2009; Krühler et al. 2012a) or lensed galaxies at comparable redshift (e.g., Richard et al. 2011; Christensen et al. 2012), however, indicates a dynamical or luminous mass well below 1010 M⊙ for the host of GRB 120815A. The total flux (after matching the NIR spectrum to the afterglow model, and including its uncertainty) in the line is F([O iii])= (2.4 ± 0.5) × 10-17 erg cm-2 s-1. The 3σ-confidence limit on the Hα flux is F(Hα) < 4.2 × 10⁻¹⁷ erg cm-2 s-1, corresponding to a limit on the observed, i.e., not extinction corrected, star-formation rate SFR < 9 M⊙ yr-1 using the conversion from Kennicutt (1998) with a Chabrier (2003) initial mass function.
Column densities and abundances.
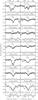 |
Fig. 4 Absorption lines and Voigt-profile fits in the GRB 120815A afterglow spectrum. Dark-grey circles and lines show the normalized spectrum with statistical errors and the line fit, respectively. Light-grey circles show the residuals between data and best fit. The instrumental resolution of X-shooter and its error is indicated by shaded, blue areas in panels 2 (VIS arm) and 7 (UVB arm). The position of individual metal lines of the two absorbing systems is indicated by vertical dotted lines. Absorption by strong telluric lines is marked with a circled plus (panel 3). |
3.2.3. Absorption lines, velocity structure and abundances
The absorption lines in the X-shooter afterglow spectrum are relatively narrow, spanning  km s-1 based on Si ii(λ 1808) and following the definition in Ledoux et al. (2006). The absorption is concentrated into two components separated by ~27 km s-1 and, within our resolution and S/N, no further absorption component is required to adequately fit the individual absorption lines (Fig. 4). The redshifts of the blue and red component are z = 2.3579 ± 0.0001 and 2.3582 ± 0.0001 respectively, which is 63 km s-1 and 36 km s-1 blueshifted with respect to the systemic redshift defined by the [O iii](λ 5007) emission line (Sect. 3.2.2).
To derive column densities, we fitted Voigt profiles convolved with the instrumental resolution to absorption lines within VPfit v.10.08. Here, we linked the broadening parameter b between the individual fits of weak absorption lines, and allowed for a small offset (≲5−10 km s-1 ) in the wavelength calibration between line fits of individual transitions of the same ion. We further assumed that only turbulent broadening contributes to b. Finally, we imposed the same velocity structure of two central components for all lines, independent of their excitation level or ionization state. While this is supposedly a simplification of the ISM velocity structure, our data do not yield more detailed constraints (Fig. 4).
The broadening parameters are constrained to b1 = 9.7 ± 1.0 km s-1 for the primary, red component, and b2 = 11.9 ± 3.5 km s-1 for the weaker, blue component, where the quoted uncertainties on b are the formal errors provided by VPfit. At the given S/N and instrumental resolution of FWHM = 28 km s-1 in X-shooter’s VIS arm, features with b ≳ 6 km s-1 (and thus the velocity profiles of the metal absorption) are resolved. The broadening parameters are close to the instrumental resolution in the UVB arm (Fig. 4). The simultaneous fit of all weak lines (excluding the saturated Si ii(λ 1808)) has a χ2 = 1058 for 954 degrees of freedom. Si ii(λ 1808) is fitted after fixing its line properties to the previously-obtained values from weaker lines.
Given the limited resolution and small separation, the velocity components are blended. The column densities of the single components are correlated and accordingly have substantial errors individually. The total column as the sum of both components, however, is typically well constrained, and we report only total column densities in the following. The column density of metals and its statistical errorbars in Table 1 could suffer from systematic uncertainties because of hidden saturation in the medium resolution X-shooter data (see e.g., Prochaska 2006). In the absence of data with a very high resolving power, these systematic uncertainties are hard to quantify robustly in our case. There is, however, generally good agreement (within 0.1 dex., except for the saturated Si ii(λ 1808) transition) between UVES and X-shooter data for the strong (log (N(H i)/cm-2) = 22.10 ± 0.10, log (N(Zn ii)/cm-2) ~ 13.6, log (N(Fe ii)/cm-2) ~ 15.8) QSO-DLA studied in Noterdaeme et al. (2012a, their Table 2). Krogager et al. (2013) also find good agreement between QSO-DLA abundances measured in two independent X-shooter spectra of different resolution. Although we cannot rule out that our column densities are affected by hidden saturation, even a factor of four larger error-bars as formally provided by VPfit, or an additional error or underestimation of 0.2 dex. – the maximum difference in the study of Noterdaeme et al. (2012a) – on the abundances of Si ii or Zn ii, do not change the conclusions of this work.
Our best constraint on the metallicity of the GRB-DLA comes from the abundance of zinc, an element generally considered as being very little affected by dust depletion. Based on the well-detected Zn ii(λλ 2026,2062) transitions, we derive [Zn/H] = −1.15 ± 0.12. Estimates from Si ii and S ii agree well within errors. Velocity profiles of selected lines are shown in Fig. 4 and column densities are given in Table 1.
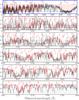 |
Fig. 5 X-shooter spectrum between 3300 and 4200 Å illustrating the presence of H2 absorption. The uppermost, blue-framed panel shows an overview, while the lower 5 panels show zoom-ins of 100 Å each below 3800 Å, where most of the Lyman-Werner absorption bands are located. Light-grey lines are the normalized spectrum, while dark-grey lines indicate the error spectrum. The solid red line denote the synthetic H2 model, with individual transitions up to J = 5 transitions marked with red labels. The dashed lines show synthetic H2 models corresponding to the 1σ errors on the measured molecular content. In the top panel, we also mark prominent metal absorption lines previously detected in GRB-DLAs (Christensen et al. 2011) and those of the intervening systems. In the lower panels, J0,J1, and so forth denote transitions from the J = 0, J = 1 rotational level of the vibrational ground state of the Lyman-Werner bands of H2. |
All metal transitions bluewards of λrest ~ 1700 Å are blended with H lines (Sect. 3.2.7). Consequently, we conservatively consider the values derived for weak lines that are in regions of strong H transitions (in particular S ii(λ 1250) and to a lesser extent also N v(λλ 1238,1242)) as upper limits only. In addition, absorption lines bluewards of λrest < 1260 Å are located in the damping wing of Lyα, adding further to the error of the column density because of the uncertainty in their continuum placement.
3.2.4. Depletion of refractory elements
The measured column densities and abundances (Table 1) of the refractory elements such as Fe, Cr, Ni or Mn with respect to Zn, Si or S indicate that they are depleted onto dust grains. For GRB 120815A, we derive a relative abundance of [Zn/Fe] = 1.01 ± 0.10, a column density of iron locked-up in dust of log (N(Fe)dust/cm-2) = 16.27 ± 0.08 (following Vladilo et al. 2006), and a dust-to-gas ratio based on zinc κZn = 10[Zn/H](1 − 10[Fe/Zn]) of log (κZn) = −1.19 ± 0.12, approximately 40% of the value of the SMC. The column density of iron in dust grains is a factor of 40 larger than the threshold of log (N(Fe)dust/cm-2) > 14.7 above which H2-molecules are typically found in QSO-DLAs (e.g., Noterdaeme et al. 2008).
Using the SMC as a benchmark9, the depletion-derived extinction is AV = 0.12 ± 0.03 mag. The metals-to-dust ratio (log (N(H i)/cm-2) + [Zn/H] )/AV = (5 ± 1) × 1021 cm-2 mag-1 is roughly 2.5 times the value of the Local. Different depletion methods (see, e.g., Savaglio et al. 2003) and comparison values from the Local Group allow visual extinctions up to AV ~ 0.6 mag, and consequently a metals-to-dust ratio based on the depletion analysis that is consistent with the Galactic value (see e.g, Bohlin et al. 1978; Predehl & Schmitt 1995).
3.2.5. Molecular hydrogen
The most salient feature of the X-shooter spectrum blueward the Lyα absorption is the presence of periodic regions of negligible flux (see Fig. 5, top panel). They are interpreted and well described by the Lyman-Werner absorption bands of molecular hydrogen, rotationally-excited states between the Lyman-limit and a rest-frame wavelength of around 1110 Å.
The fitting and analysis of the molecular hydrogen transitions follows Ledoux et al. (2002, 2003). Given the available data, we can constrain the column densities of the rotational levels J = 0 up to J = 3 in the first five Lyman bands, L = 0 − 0 to 0 − 4. We first performed a Voigt-profile fit of the J = 0, 1, 2 and 3 lines independently. The resulting column density of the J = 3 level is considered as an upper limit due to possible blending. In total, these levels yield an integrated H2 column density of log (N(H2)/cm-2) = 20.54 ± 0.13. Details of individual rotational transitions are provided in Table 1. Higher J-levels, which are expected to be populated by fluorescence, and their relation to the excited H (Sect. 3.2.7) remain unconstrained with the available X-shooter data because of the medium resolution, limited S/N, and blending with Lyα forest lines. Our data provide a robust measurement only of the excitation temperature of the core of the cloud (which is therefore unrelated to fluorescence). The kinetic temperature for the excitation of the J = 1 state is Tkin ~ 200 K, which is higher than observed locally (e.g., Savage et al. 1977; Tumlinson et al. 2002), but in the range of QSO-derived temperatures (Srianand et al. 2005).
Together with the column density of neutral hydrogen log (NH/cm-2) = 21.95 ± 0.10, this translates into a molecular fraction of log f = −1.14 ± 0.15, where f ≡ 2N(H2)/(N(H i) + 2N(H2)). The best-fit redshift and broadening parameter of the molecular hydrogen lines are z(H2) = 2.3582 and b(H2) = 8.7 ± 0.6 km s-1 , consistent with the primary component of the metal-line absorption (Sect. 3.2.3). Using the measured parameters and errors on the kinetic temperature, broadening parameter and molecular fraction we then calculated synthetic models that include higher rotational levels and are shown in Fig. 5, lower panels.
3.2.6. Lack of carbon monoxide
We do not detect absorption signatures from the CO molecule. While there is an absorption line at ~4960 Å with observed equivalent width Wobs = 0.64 ± 0.10 Å, conspicuously close to the CO AX(2-0) bandhead at z = 2.36, we consider it unrelated to CO, as none of the other expected CO transitions are detected. Also, the CO redshift would be significantly offset from the value of either absorption, emission or H2. We thus conclude that this single line is not caused by CO, but related to an intervening absorber. Given the presence of a second absorption line at ~4966 Å with Wobs(λ 1550) = 0.33 ± 0.07, the most likely interpretation of these features is the C iv doublet at z = 2.2042.
Using the wavelength range of the six strongest CO AX bandheads (CO AX(0−0) to CO AX(5−0)) redshifted to z = 2.3582 as reference, we set a 3σ upper limit on the total CO column density10 of log (N(CO)/cm-2) < 15.0. This value is fairly independent on the CO excitation temperature (assumed to be greater than TCMB = 9 K at z = 2.36) and CO broadening parameter, because the latter would not be resolved for typical values with our X-shooter data (e.g., Noterdaeme et al. 2010).
The N(CO) to N(H2) ratio is smaller than 10-5.5, which is typical for Galactic measurements with f < 0.1 (Burgh et al. 2010). The H2-bearing system towards GRB 120815A is thus characterized as a diffuse cloud, consistent with the small amount of reddening and extinction (in comparison to Galactic sightlines; Snow & McCall 2006).
N(CO)/N(H2) is a strong function of the environment, and because of the sub-solar GRB-DLA metallicity, could even be below what is typically observed in the Milky Way. The CO luminosity per unit luminosity or per unit SFR of local dwarf galaxies, for example, is significantly lower than extrapolated from metal-rich spirals (Schruba et al. 2012). This can be interpreted as evidence for a strong metallicity dependence of the CO to H2 ratio below half of Z⊙ (see also, e.g., Leroy et al. 2011). Measurements from GRB-DLAs similar to the one presented in this work and in Prochaska et al. (2009) will help to probe and study the CO abundance and the H2 to CO ratio in very different environments from diffuse clouds to translucent sight-lines over a broad range of metallicities (or stellar masses) and redshifts directly and complementary to conventional studies (e.g., Genzel et al. 2012).
Our upper limit on N(CO)/N(H2) is comparable to or lower than derived from CO detections in high-redshift systems (Srianand et al. 2008; Prochaska et al. 2009; Noterdaeme et al. 2010), which we readily relate to the lower metallicity and dust-extinction of the GRB 120815A DLA as compared to the sightlines in which CO was seen. In QSO-DLAs without CO detection, the constraints on CO/H2 extend down to limits of N(CO)/N(H2) < 10-8 (e.g., Petitjean et al. 2002).
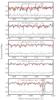 |
Fig. 6 Several cut-outs of illustrative parts of the normalized X-shooter UVB arm spectrum showing the presence of H |
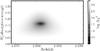 |
Fig. 7 Logarithmic Δχ2 distribution for different H |
3.2.7. Detection of vibrationally-excited H2
After establishing the presence of molecular hydrogen, we search for vibrationally-excited H2 by using the synthetic spectrum11 calculated in Draine (2000) and Draine & Hao (2002). We downgraded a theoretical R = 10 000 spectrum to the resolution of X-shooter’s UVB arm (R ~ 6000), limited the wavelength range to regions above the red damping wing of Lyα, and excluded strong metal absorption lines caused by the GRB-DLA and the intervening systems in the further analysis.
Cross-matching the downgraded spectrum with our data (see Fig. 6 for illustrative examples) using different optical depths τ with respect to the input model and varying redshifts, we find a single and well-defined minimum in the χ2-space at a redshift consistent with the ground-state H2 and metal transitions (Fig. 7). The best match is obtained at z = 2.3581 ± 0.0001, and the presence of H as compared to an unmodified spectrum is unambiguous (Figs. 6 and 7). Because the H-states are overlapping in large parts of the spectrum bluewards of 5400 Å, we caution that there is a mild degeneracy between the continuum level and the strength of the H-absorption. An overestimation of the continuum would lead to a lower value for the significance of the H detection as well as for the optical depth τ. Given the presence of several strong individual lines as illustrated in Fig. 6, we consider the detection of H despite the uncertainty in the continuum placement highly significant.
While the overall match between the input spectrum and data is reasonable, there are subtle differences between the data and synthetic model. These are evident in the different line ratios between vibrational levels (see, e.g., the expected but undetected strong line at ~4560 Å in Fig. B.4). This is likely related to different initial conditions – such as particle densities, cloud-afterglow distance (see Sect. 4.1), dust shielding, afterglow luminosity and spectrum, and/or background UV-radiation field – with respect to the assumptions in the theoretical calculation or uncertain transition probabilities between different excited levels of the H2 molecule. In particular, we derive a distance between the absorbing gas cloud and GRB 120815A of d ~ 0.5 kpc (see Sect. 4.1), much larger than the d ~ 1 pc assumed in the model. This will inevitably lead to different line strengths and ratios between the various H transitions.
4. Discussion
4.1. Distance between GRB and absorbing cloud
Our observations indicate that the metal-lines and H2 absorption are not caused by circumburst material. The presence of H2 alone sets a lower limit on the burst-cloud distance of at least d ≳ 10 pc (Whalen et al. 2008; Ledoux et al. 2009). In addition, the detection of neutral species at the same redshift, in particular Mg i (Fig. 4), is generally interpreted as an indication that the gas is at substantial distances (d > 50 pc) from the GRB (Prochaska et al. 2006).
These initial considerations are confirmed by modeling the photo-excitation of the Fe ii∗, Fe ii∗∗, Fe ii 4F9/2 and Ni ii 4F9/2 transitions. In the modeling, we excluded Si ii∗, because excited states of Si ii are also seen in very actively star-forming galaxies (e.g., Pettini et al. 2002). Si ii is easier to excite than Fe ii or Ni ii, and a fraction of the Si ii excitation might thus not be due to the GRB afterglow radiation. The observed ratio of N(Si ii∗)/N(Si ii) ~1% could, for example, be provided by electron densities around 10 cm-3 in a T ~ 104 K medium, or UV-backgrounds about 103 times that of the Galaxy (Silva & Viegas 2002). Given the small separation in velocity of both absorption components, and the limited resolution of our X-shooter data, we only model the total column densities (see also the discussion in Vreeswijk et al. 2013).
The photo-excitation modeling follows closely the methodology presented and applied in Vreeswijk et al. (2007, 2013) and Ledoux et al. (2009), and we refer to these publications for a detailed description of the technique. As an input to the model, we use the optical afterglow light curve (see Sect. 2.2), the afterglow spectral slope β, the inferred extinction AV (Sects. 3.1 and 3.2.4) and the broadening parameter b of the absorption lines (3.2.3). The dust is placed inside the absorbing cloud that is being excited, and the distance d from the GRB is defined to the near-side of the cloud.
A good fit (χ2 /d.o.f. = 2.3/4) is obtained for a distance between gas cloud and burst of d = 460 ± 60 pc in the case of atomic data from CLOUDY (Verner et al. 1999). A similar result is obtained (χ2 /d.o.f. = 4.3/4, d = 530 ± 80 pc) when using atomic data as described in Vreeswijk et al. (2007). For a detailed comparison between the different sets of atomic data in this context, we refer to the discussion in Ledoux et al. (2009). Given the lack of a spectral time series, and relatively few measurements of excited metal transitions, the cloud size is unconstrained by our data. The neutral gas seen in absorption in the GRB-DLA is thus not directly related to the GRB progenitor’s immediate environment or stellar wind-driven mass loss.
4.2. Detection of high-ionization species
We also detect the imprint of the highly-ionized transition N v (ionization potential for creation of 77.5 eV) with a high column density at a redshift consistent with the other metal-lines. N v is a common feature observed towards GRBs (Fox et al. 2008) and is suggestive of a circumburst origin in the vicinity of the GRB (Prochaska et al. 2008a). N v is, however, also present in UV spectra of O-type stars, galaxies and QSO-DLAs (e.g., Pettini et al. 2002; Fox et al. 2009). In the case of GRB 120815A, in particular, the N v measurement is, due to blending with H, strictly an upper limit, suffers from low S/N and has thus large errors on its column density as well as uncertainties in its velocity structure. Our detection of N v is broadly consistent with the measurements for other GRB-DLAs, and does not necessarily point to an origin in the circumburst environment, but could also be of interstellar origin as argued in Fox et al. (2008). A location in the ISM is supported by the non-variability of N v in a spectral time-series for GRB 080310 (De Cia et al. 2012).
4.3. Molecular hydrogen in GRB-DLAs
4.3.1. Metallicity and neutral hydrogen column density
The column densities of H i, H2 and the molecular fraction f of the DLA towards GRB 120815A are high when compared to the average properties12 of the sample of QSO-DLAs. In the work of Noterdaeme et al. (2012b), for example, there are 10 out of ≈12 000 SDSS-selected QSO-DLAs with log (N(H i)/cm-2) ≳ 21.95. The high N(H i) is, however, more typical for GRB-DLAs (8 of 27 GRB-DLAs have log (N(H i)/cm-2) ≳ 21.95 in the sample of Fynbo et al. (2009)).
When considering the significant dust depletion and metal abundance along the GRB 120815A sightline, a consistent picture is emerging: High molecular fractions (log (f) > − 3) are exclusively seen at significant metallicities ([M/H] ≳ − 1.5), while they are not restricted to the very high-end of hydrogen column densities of log (N(H i)/cm-2) ~ 21.0 (see, e.g., Ledoux et al. 2003).
The high column densities of neutral hydrogen typical for GRB-DLAs are thus not the primary condition for the presence of H2 in DLAs. This is illustrated in Fig. 8, which shows the incidence of H2-bearing gas as functions of H i column densities and metallicity. While there is an obvious discrepancy in the distributions of N(H i) between GRBs and QSO-DLAs, the difference between H2-poor and H2-rich QSO sightlines with respect to their N(H i) is much more subtle (Fig. 8, top panel).
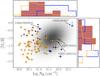 |
Fig. 8 The central panel shows metallicity versus hydrogen column density for QSO and GRB DLAs in which H2 was extensively searched for. Circles are QSO-DLAs, where red and yellow circles correspond to DLAs with and without significant molecular hydrogen. Blue data are GRB-DLAs and the blue stars are GRB 120815A and GRB 080607, where H2 has been detected. The grey background shading indicates the parameter space where many of the more dust-extinguished GRB-DLAs are located (see details in Sect. 4.3.3). The upper and right panels illustrate the respective normalized histograms. Blue hatched histogram are GRBs including both H2-poor and H2-rich sightlines due to low number statistics. Red-filled and yellow histograms are QSO-DLAs with and without molecular hydrogen, respectively. Data for QSOs are from Noterdaeme et al. (2008); Fynbo et al. (2010, 2011); Guimarães et al. (2012), data from GRBs from Ledoux et al. (2009); Prochaska et al. (2009); D’Elia et al. (2010). |
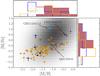 |
Fig. 9 Depletion of QSO and GRB DLAs versus their metallicity. Symbols, colors and shadings are the same as in Fig. 8. GRB 080607 is not shown in this plot because no constraints on the depletion factor are available (Prochaska et al. 2009). |
4.3.2. The role of dust
Dust plays a major role for the presence of molecular gas by catalyzing the formation of molecules on the surface of dust grains as well as shielding against Lyman-Werner photons. For GRB 120815A, the presence of dust is evident from the relative abundance of Fe, Ni, Mn and Cr with respect to Zn ([Zn/Fe] = 1.01 ± 0.10). This value is larger than the relative abundance of previous GRB-DLAs observed at high spectral resolution, for which elaborate H2-searches were performed (Ledoux et al. 2009).
Similar to the case of metallicity, there is a higher probability of finding molecular hydrogen for more dust-depleted QSO sightlines (Fig. 9). There seems to be a lower limit of [M/Fe] of ~0.3 below which no strong signatures of H2-molecules (neither towards QSO nor GRBs) are observed (Fig. 9). The values of metallicity, dust depletion and N(H i) are effectively combined into a column density of iron locked up in dust N(Fe)dust, which has been identified as a primary driver of H2 detection in QSO-DLAs (Noterdaeme et al. 2008).
Guimarães et al. (2012) studied the QSO-selected system SDSS J081634+144612 and identified it as an analog to GRB-DLAs with very similar N(H i) and [Zn/H] as measured for the DLA of GRB 120815A (Fig. 8). The column density of N(H2) in the QSO-DLA, and thus the molecular fraction f, however, is two orders of magnitude lower than derived for GRB 120815A. This could possibly be related to the lower depletion. The mean relative abundance13 in this QSO-DLA was [Zn/Fe] = 0.48 ± 0.06, while we observe [Zn/Fe] = 1.01 ± 0.10 for GRB 120815A (Fig. 9).
4.3.3. Implications for the population of GRB-DLAs
The region of elevated metallicity, depletion and N(H i) is exactly the parameter space where we expect many of the more dust-extinguished, and thus UV-fainter afterglows to be located. This combination directly leads to a high absolute N(Fe)dust, and thus an efficient conversion from H i to H2 on the dust grain surface (Schaye 2001; Cazaux & Spaans 2004). A high column density of dust absorbs UV-photons efficiently, and is also a necessary condition for creating molecular hydrogen on dust grains. The observed H2 column density is also affected by photo-dissociation, for example by the background UV-radiation field in the GRB host. A lack of molecular gas in GRB-DLAs with respect to QSO-DLAs of similar N(Fe)dust would thus indicate that photo-dissociation of H2 is more prominent in GRB hosts than it is in the galaxy counterparts of GRB-DLAs. In such a scenario, H2 needs to be absent already prior to the burst, because the derived distances between the absorbing gas and GRB are much larger than the region of d ≲ 10 pc, in which the afterglow’s UV-flux photo-dissociates H2. The previous lack of molecular gas in GRB-DLAs, however, is consistent with their observed metallicity and dust depletion (Ledoux et al. 2009), and does not necessarily point to a difference between GRB and QSO-DLAs with respect to the presence of H2. In fact, GRB 050820A is still the only H2-less GRB-DLA with physical properties that are similar to those of H2-bearing QSO-selected systems (Fig. 9).
The measured hydrogen column density, metallicity and dust-depletion of GRB 120815A are fairly representative of GRB-DLAs previously observed at lower spectral resolution. Based on the statistical samples compiled for log (N(H i) in Fynbo et al. (2009); Christensen et al. (2011), metallicity in Rau et al. (2010); Christensen et al. (2011), and depletion in Savaglio et al. (2003); Savaglio (2006), we expect the distributions of the respective physical quantity to be centered roughly14 around log (N(H i)/cm-2) ~ 21.6 ± 0.6, [M/H] ~ − 1.0 ± 0.8 and [M/Fe] ~ 0.8 ± 0.7, where the quoted error indicates an estimate of the dispersion of the respective sample distribution. This parameter space is shown by the grey shaded area in Figs. 8 and 9. QSO-DLAs in this region show a higher probability of having significant column densities of molecular hydrogen. The molecular content of previous GRB-DLAs, however, could typically not be probed with afterglow spectra of low S/N, low resolution, or both. Once we have gained better observational access to afterglows in this region through detailed observations with sensitive spectrographs of high-enough resolution (such as X-shooter or UVES), it seems likely that a higher fraction of those GRBs will also show the presence of molecular gas.
4.4. Vibrationally-excited H2 in GRB-DLAs
The presence of vibrationally-excited states of molecular hydrogen (H) along GRB sightlines was first postulated by Draine (2000) and detailed in Draine & Hao (2002). The strong features, however, that were expected to be produced by the vibrationally-excited H2 from the GRB’s birth cloud, and detectable in even low-resolution spectra, were never clearly observed. Excited states would nevertheless be present in cases where the molecular cloud only intersects the GRB sightline (Draine & Hao 2002) at small enough distances. Indeed, while in the work of Draine & Hao (2002) the total H column density produced through UV-pumping is  , the best overall match is obtained here with a factor 6 decreased optical depth of the H transitions compared to the input model. In the case of GRB 080607, Sheffer et al. (2009) perform a dynamic modeling of the H absorption, and derive a distance between GRB 080607 and its H2-bearing cloud between 230 and 940 pc. This is comparable to our estimate of the distance between GRB 120815A and its DLA of 0.5 ± 0.1 kpc.
As shown in Figs. 2 and B.4, the H transitions affect the measurement of N(H i). If H2 and H are more common in GRB-DLAs as speculated above, N(H i) could have been overestimated in previous cases. In the case of GRB 120815A, the H transitions decrease the best-fit column density by ~0.15 dex. Similarly, blending with H could be a serious concern for intrinsically weak metal lines, such as S ii(λλ 1250,1253) (see also Sheffer et al. 2009).
H opens a route to establish a positive presence of molecular hydrogen also in those cases where the observations do not cover the wavelength range bluewards of Lyα, and thus particularly in afterglow spectra of GRBs in the redshift range 1 < z ≲ 2 . Strong vibrationally-excited levels of H2 extend up to λrest ~ 1600 Å, and in contrast to the Lyman-Werner bands at λrest ≲ 1120 Å, their identification is not compromised by the Lyα forest, and could be performed also with lower-resolution data. Primary candidates for further H (and thus H2) searches are the high-quality, high-resolution spectra of low-redshift afterglows (in which the individual lines could be identified even if weak), or the spectra of metal- and dust-rich GRB absorbers (in which a significant column density of H2 could to be present).
5. Conclusion
We have presented optical-to-NIR X-shooter spectroscopy of the afterglow of GRB 120815A at z = 2.36, supplemented by optical/NIR photometry from GROND and X-ray data from the Swift satellite. The bright afterglow emission, observed through efficient instruments at large telescopes, provides a detailed probe of the physical properties of the inter-stellar medium in a high-redshift star-forming galaxy.
The sightline towards GRB 120815A is characterized by a strong DLA with log (N(H i)/cm-2) = 21.95 ± 0.10 and substantial amount of molecular hydrogen with a molecular fraction f of 7% (log f(H2) = −1.14 ± 0.15), characteristic of Galactic diffuse clouds. This presents only the second unambiguous detection of H2 in a GRB-DLA, and the first for a GRB-DLA with properties very similar to an average GRB sightline. In addition, we detect vibrationally-excited states of H2, which opens a second route for positive searches of molecular gas in GRB afterglow spectra.
Our measurements of DLA metallicity ([Zn/H] = −1.15 ± 0.12), relative abundance ([Zn/Fe] = 1.01 ± 0.10) and visual extinction (AV ≲ 0.15 mag) are common among GRB-DLAs, and likely typical for the population of GRB-DLAs in general. GRB 120815A thus stands in marked contrast to the metal-rich, H2-bearing DLA of GRB 080607. This illustrates that H2 is present in at least a fraction of the average GRB-DLAs systems. The detection rate of molecular gas in GRB-DLAs could increase once similar afterglows are observed routinely at higher spectral resolution.
Similar to many other physical properties probed by GRBs or their hosts, such as the distributions of galaxy brightness, mass, star-formation rate (Krühler et al. 2011; Hjorth et al. 2012; Perley et al. 2013), galaxy color (Rossi et al. 2012), Lyα emission (Milvang-Jensen et al. 2012), dust-reddening (Cenko et al. 2009; Greiner et al. 2011), soft X-ray absorption (e.g., Fynbo et al. 2009; Campana et al. 2010; Krühler et al. 2012b) or metallicity (Prochaska et al. 2009), selection effects play an important role when studying H2 in GRB-DLAs.
A larger sample of afterglows observed in a similar way as presented in this work (Fynbo et al., in prep.) will enable further progress in this field and deeper insights with respect to the statistical presence and properties of molecules along GRB sightlines. Additional detections of molecules in GRB-DLAs would allow detailed individual as well as statistical studies, and, coupled with host follow-up and sub-mm spectroscopy, provide unprecedented insights into the properties of molecular gas and the process and conditions of star-formation at z ~ 2 and above.
Online material
Appendix A: GROND photometry and multi-color light curves
The temporal evolution of the optical/NIR photometric and X-ray data was fitted simultaneously with a two-fold broken power-law, connected smoothly at the break times following Krühler et al. (2009). The functional form of this empirical fit is provided for example in Schulze et al. (2011). The light curve shape is characterized by a shallow, early rise with an index α1 = −0.18 ± 0.02, where the sign follows the convention that Fν(t) ∝ t− α. The optical/NIR afterglow peaks at t1 = 440 ± 30 s after the BAT trigger time. Afterwards the light curve decays with an index of α2 = 0.52 ± 0.01, before another breaking to
Optical magnitudes of the afterglow of GRB 120815A as measured by GROND.
a steeper decay of α3 = 0.86 ± 0.03 at  ks. The light curve is reasonably well fitted with this phenomenological model (χ2 = 261 for 242 degrees of freedom), and no chromatic evolution is apparent within our data set. The overall light curve behavior is reminiscent of GRB 080710 (Krühler et al. 2009), in particular the achromatic and shallow, early rise of the light curve in combination with the soft γ-ray emission detected by BAT (Markwardt et al. 2012).
All magnitudes in Fig. A.1 and Tables A.1, A.2 are in the AB system and uncorrected for the expected Galactic foreground extinction, corresponding to a reddening of EB − V = 0.10 mag (Schlafly & Finkbeiner 2011).
Near-infrared magnitudes of the afterglow of GRB 120815A as measured by GROND.
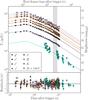 |
Fig. A.1 GROND optical/NIR and XRT 0.3−10 keV light curves of the afterglow of GRB 120815A in the top panel. The data were fitted with a three-segment, smoothly broken power-law, with residuals shown in the bottom panel. The grey shaded area represents the time interval in which the X-shooter spectroscopy was obtained. X-ray data were converted into a flux density at 3 keV using a spectral index of β = 0.78, and scaled by a factor of 20 to enhance clarity. |
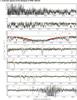 |
Fig. B.1 X-shooter UVB-arm spectrum of the afterglow of GRB 120815A. Black lines show the spectral data, grey lines the noise level, the green line is the GRB afterglow model, and the red-line shows the DLA modeling. The position of absorption lines that are typically associated with GRB-DLAs (taken from Christensen et al. 2011) are indicated by brown lines and ions. Individual lines associated with intervening absorbers are labeled with colored lines and labels. |
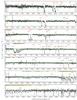 |
Fig. B.2 X-shooter VIS-arm spectrum of the afterglow of GRB 120815A. Lines and labels are the same as in Fig. B.1. Additionally, strong telluric lines are indicated by circles in the upper part of each panel. |
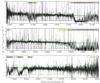 |
Fig. B.3 X-shooter NIR-arm spectrum of the afterglow of GRB 120815A. Lines and labels are the same as in Fig. B.2. |
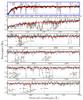 |
Fig. B.4 X-shooter spectrum between 4100 and 5600 Å showing the presence of H |
GRBs are typically divided into long and short events with different progenitor channels. In this work, we focus exclusively on long GRBs, typically defined as having durations T90 > 2 s (see, e.g., Kouveliotou et al. 1993, for details). T90 is the time during which 90% of the GRB’s γ-ray photons are emitted.
Atomic data for Ni ii(λ 1370) are from Jenkins & Tripp (2006) and Ni ii 4F9/2 as well as Fe ii 4F9/2 from http://www.cfa.harvard.edu/amp/ampdata/kurucz23/sekur.html. We note that we apply a similar modification to Ni ii 4F9/2 as in Vreeswijk et al. (2007). In the photo-excitation modelling, we also use atomic data provided by Verner et al. (1999) and references therein.
We use solar abundances from Anders & Grevesse (1989) here also for the intrinsic absorber for a direct comparison with values published in the literature.
Allowing values between the assumed resolving power and its lower limit derived from arc-lamps, see Sect. 2.3.
This requires assumptions on the SMC’s dust depletion ([Fe/Zn] SMC = −1.0), and metallicity ([M/H] SMC = −0.7), the average reddening per N(H i) column, and the total-to-selective reddening, which were all taken from Prochaska et al. (2007b) and references therein.
Using molecular data for CO from Morton & Noreau (1994).
A few noteworthy examples of dusty and metal-enriched QSO-DLAs (e.g., Fynbo et al. 2011) or QSO-DLAs with properties similar to those of typical GRB-DLAs (e.g., Guimarães et al. 2012) exist.
Converted into our metallicity scale based on Asplund et al. (2009).
We note that also in the low-resolution sample, biases towards lower metallicity and lower depletion values are present (Fynbo et al. 2009), and that a standard analysis of low-resolution spectra tends to underestimate the true column densities (Prochaska 2006). Both effects would shift the distribution of metal column densities to even higher values, further strengthening the argumentation.
Acknowledgments
We acknowledge very helpful comments and a very timely report from the anonymous referee that helped to improve the quality of the manuscript, and thank S. Savaglio for their insightful and constructive comments. T.K. acknowledges support by the European Commission under the Marie Curie Intra-European Fellowship Programme in FP7. J.P.U.F. acknowledges support from the ERC-StG grant EGGS-278202. A.d.U.P. acknowledges support by the European Commission under the Marie Curie Career Integration Grant programme (FP7-PEOPLE-2012-CIG 322307). The Dark Cosmology Centre is funded by the Danish National Research Foundation. P.S. acknowledges support through the Sofja Kovalevskaja Award from the Alexander von Humboldt Foundation of Germany. S. Schmidl acknowledges support by the Thüringer Ministerium für Bildung, Wissenschaft und Kultur under FKZ 12010-514. T.K. acknowledges the use of the free software VPFit, written by Bob Carswell and John Webb. Part of the funding for GROND (both hardware as well as personnel) was generously granted from the Leibniz-Prize to Prof. G. Hasinger (DFG grant HA 1850/28-1). This work made use of data supplied by the UK Swift Science Data Centre at the University of Leicester. Finally, we acknowledge expert support from the ESO staff at the Paranal and La Silla observatories in obtaining these target of opportunity data.
References
- Aihara, H., Allen de Prieto, C., An, D., et al. 2011, ApJS, 193, 29 [NASA ADS] [CrossRef] [Google Scholar]
- Anders, E., & Grevesse, N. 1989, Geochim. Cosmochim. Acta, 53, 197 [Google Scholar]
- Arnaud, K. A. 1996, in Astronomical Data Analysis Software and Systems V, ASP Conf. Ser., 101, 17 [NASA ADS] [Google Scholar]
- Asplund, M., Grevesse, N., Sauval, A. J., & Scott, P. 2009, ARA&A, 47, 481 [NASA ADS] [CrossRef] [Google Scholar]
- Barthelmy, S. D., Barbier, L. M., Cummings, J. R., et al. 2005, Space Sci. Rev., 120, 143 [NASA ADS] [CrossRef] [Google Scholar]
- Bigiel, F., Leroy, A., Walter, F., et al. 2008, AJ, 136, 2846 [NASA ADS] [CrossRef] [Google Scholar]
- Blitz, L. 1993, in Protostars and Planets III, eds. E. H. Levy, & J. I. Lunine, 125 [Google Scholar]
- Bloom, J. S., Perley, D. A., Li, W., et al. 2009, ApJ, 691, 723 [NASA ADS] [CrossRef] [PubMed] [Google Scholar]
- Bohlin, R. C., Savage, B. D., & Drake, J. F. 1978, ApJ, 224, 132 [NASA ADS] [CrossRef] [Google Scholar]
- Burgh, E. B., France, K., & Jenkins, E. B. 2010, ApJ, 708, 334 [NASA ADS] [CrossRef] [Google Scholar]
- Burrows, D. N., Hill, J. E., Nousek, J. A., et al. 2005, SSR, 120, 165 [Google Scholar]
- Campana, S., Thöne, C. C., de Ugarte Postigo, A., et al. 2010, MNRAS, 402, 2429 [NASA ADS] [CrossRef] [Google Scholar]
- Cazaux, S., & Spaans, M. 2004, ApJ, 611, 40 [NASA ADS] [CrossRef] [Google Scholar]
- Cenko, S. B., Kelemen, J., Harrison, F. A., et al. 2009, ApJ, 693, 1484 [NASA ADS] [CrossRef] [Google Scholar]
- Chabrier, G. 2003, PASP, 115, 763 [NASA ADS] [CrossRef] [Google Scholar]
- Christensen, L., Fynbo, J. P. U., Prochaska, J. X., et al. 2011, ApJ, 727, 73 [NASA ADS] [CrossRef] [Google Scholar]
- Christensen, L., Richard, J., Hjorth, J., et al. 2012, MNRAS, 427, 1953 [Google Scholar]
- Covino, S., Melandri, A., Salvaterra, R., et al. 2013, MNRAS, 432, 1231 [NASA ADS] [CrossRef] [Google Scholar]
- Cox, N. L. J., Cordiner, M. A., Cami, J., et al. 2006, A&A, 447, 991 [NASA ADS] [CrossRef] [EDP Sciences] [Google Scholar]
- Daddi, E., Bournaud, F., Walter, F., et al. 2010, ApJ, 713, 686 [NASA ADS] [CrossRef] [Google Scholar]
- Dame, T. M., Hartmann, D., & Thaddeus, P. 2001, ApJ, 547, 792 [NASA ADS] [CrossRef] [Google Scholar]
- De Cia, A., Ledoux, C., Fox, A. J., et al. 2012, A&A, 545, A64 [NASA ADS] [CrossRef] [EDP Sciences] [Google Scholar]
- De Cia, A., Ledoux, C., Savaglio, S., Schady, P., & Vreeswijk, P. M. 2013, A&A, submitted [arXiv:1305.1153] [Google Scholar]
- de Ugarte Postigo, A., Fynbo, J. P. U., Thöne, C. C., et al. 2012, A&A, 548, A11 [NASA ADS] [CrossRef] [EDP Sciences] [Google Scholar]
- D’Elia, V., Fiore, F., Perna, R., et al. 2009, ApJ, 694, 332 [NASA ADS] [CrossRef] [Google Scholar]
- D’Elia, V., Fynbo, J. P. U., Covino, S., et al. 2010, A&A, 523, A36 [NASA ADS] [CrossRef] [EDP Sciences] [Google Scholar]
- Donahue, M., Mack, J., Voit, G. M., et al. 2000, ApJ, 545, 670 [NASA ADS] [CrossRef] [Google Scholar]
- Draine, B. T. 2000, ApJ, 532, 273 [NASA ADS] [CrossRef] [Google Scholar]
- Draine, B. T., & Hao, L. 2002, ApJ, 569, 780 [NASA ADS] [CrossRef] [Google Scholar]
- Elíasdóttir, Á., Fynbo, J. P. U., Hjorth, J., et al. 2009, ApJ, 697, 1725 [NASA ADS] [CrossRef] [Google Scholar]
- Ellison, S. L., Vreeswijk, P., Ledoux, C., et al. 2006, MNRAS, 372, L38 [NASA ADS] [CrossRef] [Google Scholar]
- Evans, P. A., Beardmore, A. P., Page, K. L., et al. 2007, A&A, 469, 379 [NASA ADS] [CrossRef] [EDP Sciences] [Google Scholar]
- Evans, P. A., Beardmore, A. P., Page, K. L., et al. 2009, MNRAS, 397, 1177 [NASA ADS] [CrossRef] [Google Scholar]
- Federman, S. R., Cardell, J. A., van Dishoeck, E. F., Lambert, D. L., & Black, J. H. 1995, ApJ, 445, 325 [NASA ADS] [CrossRef] [Google Scholar]
- Fitzpatrick, E. L., & Massa, D. 1990, ApJS, 72, 163 [NASA ADS] [CrossRef] [Google Scholar]
- Fitzpatrick, E. L., & Massa, D. 2007, ApJ, 663, 320 [NASA ADS] [CrossRef] [EDP Sciences] [Google Scholar]
- Fox, A. J., Ledoux, C., Vreeswijk, P. M., Smette, A., & Jaunsen, A. O. 2008, A&A, 491, 189 [NASA ADS] [CrossRef] [EDP Sciences] [Google Scholar]
- Fox, A. J., Prochaska, J. X., Ledoux, C., et al. 2009, A&A, 503, 731 [NASA ADS] [CrossRef] [EDP Sciences] [Google Scholar]
- Fynbo, J. P. U., Starling, R. L. C., Ledoux, C., et al. 2006, A&A, 451, L47 [NASA ADS] [CrossRef] [EDP Sciences] [Google Scholar]
- Fynbo, J. P. U., Prochaska, J. X., Sommer-Larsen, J., Dessauges-Zavadsky, M., & Møller, P. 2008, ApJ, 683, 321 [NASA ADS] [CrossRef] [Google Scholar]
- Fynbo, J. P. U., Jakobsson, P., Prochaska, J. X., et al. 2009, ApJS, 185, 526 [NASA ADS] [CrossRef] [Google Scholar]
- Fynbo, J. P. U., Laursen, P., Ledoux, C., et al. 2010, MNRAS, 408, 2128 [NASA ADS] [CrossRef] [Google Scholar]
- Fynbo, J. P. U., Ledoux, C., Noterdaeme, P., et al. 2011, MNRAS, 413, 2481 [NASA ADS] [CrossRef] [Google Scholar]
- Galama, T. J., Vreeswijk, P. M., van Paradijs, J., et al. 1998, Nature, 395, 670 [NASA ADS] [CrossRef] [Google Scholar]
- Gehrels, N., Chincarini, G., Giommi, P., et al. 2004, ApJ, 611, 1005 [NASA ADS] [CrossRef] [Google Scholar]
- Genzel, R., Tacconi, L. J., Combes, F., et al. 2012, ApJ, 746, 69 [NASA ADS] [CrossRef] [Google Scholar]
- Goldoni, P., Royer, F., François, P., et al. 2006, in SPIE Conf. Ser., 6269 [Google Scholar]
- Granot, J., & Sari, R. 2002, ApJ, 568, 820 [NASA ADS] [CrossRef] [Google Scholar]
- Greiner, J., Bornemann, W., Clemens, C., et al. 2007, The Messenger, 130, 12 [NASA ADS] [Google Scholar]
- Greiner, J., Bornemann, W., Clemens, C., et al. 2008, PASP, 120, 405 [NASA ADS] [CrossRef] [Google Scholar]
- Greiner, J., Krühler, T., Klose, S., et al. 2011, A&A, 526, A30 [NASA ADS] [CrossRef] [EDP Sciences] [Google Scholar]
- Guillard, P., Ogle, P. M., Emonts, B. H. C., et al. 2012, ApJ, 747, 95 [NASA ADS] [CrossRef] [Google Scholar]
- Guimarães, R., Noterdaeme, P., Petitjean, P., et al. 2012, AJ, 143, 147 [NASA ADS] [CrossRef] [Google Scholar]
- Hartoog, O. E., Wiersema, K., Vreeswijk, P. M., et al. 2013, MNRAS, 430, 2739 [NASA ADS] [CrossRef] [Google Scholar]
- Hjorth, J., Møller, P., Gorosabel, J., et al. 2003a, ApJ, 597, 699 [NASA ADS] [CrossRef] [Google Scholar]
- Hjorth, J., Sollerman, J., Møller, P., et al. 2003b, Nature, 423, 847 [NASA ADS] [CrossRef] [PubMed] [Google Scholar]
- Hjorth, J., Malesani, D., Jakobsson, P., et al. 2012, ApJ, 756, 187 [NASA ADS] [CrossRef] [Google Scholar]
- Holland, S. T., & Pagani, C. 2012, GCN, 13666 [Google Scholar]
- Jakobsson, P., Fynbo, J. P. U., Ledoux, C., et al. 2006, A&A, 460, L13 [NASA ADS] [CrossRef] [EDP Sciences] [Google Scholar]
- Jenkins, E. B., & Tripp, T. M. 2006, ApJ, 637, 548 [Google Scholar]
- Jensen, B. L., Fynbo, J. U., Gorosabel, J., et al. 2001, A&A, 370, 909 [NASA ADS] [CrossRef] [EDP Sciences] [Google Scholar]
- Johnstone, R. M., Hatch, N. A., Ferland, G. J., et al. 2007, MNRAS, 382, 1246 [NASA ADS] [CrossRef] [Google Scholar]
- Kalberla, P. M. W., Burton, W. B., Hartmann, D., et al. 2005, A&A, 440, 775 [NASA ADS] [CrossRef] [EDP Sciences] [Google Scholar]
- Kann, D. A., Klose, S., & Zeh, A. 2006, ApJ, 641, 993 [NASA ADS] [CrossRef] [Google Scholar]
- Kann, D. A., Klose, S., Zhang, B., et al. 2010, ApJ, 720, 1513 [NASA ADS] [CrossRef] [Google Scholar]
- Kennea, J. A., Cusumano, G., Perri, M., et al. 2012, GCN, 13647 [Google Scholar]
- Kennicutt, Jr., R. C. 1998, ARA&A, 36, 189 [Google Scholar]
- Kouveliotou, C., Meegan, C. A., Fishman, G. J., et al. 1993, ApJ, 413, L101 [NASA ADS] [CrossRef] [Google Scholar]
- Krogager, J.-K., Fynbo, J. P. U., Ledoux, C., et al. 2013, MNRAS, submitted [arXiv:1304.4231] [Google Scholar]
- Krühler, T., Küpcü Yoldaş, A., Greiner, J., et al. 2008, ApJ, 685, 376 [NASA ADS] [CrossRef] [Google Scholar]
- Krühler, T., Greiner, J., Afonso, P., et al. 2009, A&A, 508, 593 [NASA ADS] [CrossRef] [EDP Sciences] [Google Scholar]
- Krühler, T., Greiner, J., Schady, P., et al. 2011, A&A, 534, A108 [NASA ADS] [CrossRef] [EDP Sciences] [Google Scholar]
- Krühler, T., Fynbo, J. P. U., Geier, S., et al. 2012a, A&A, 546, A8 [NASA ADS] [CrossRef] [EDP Sciences] [Google Scholar]
- Krühler, T., Malesani, D., Milvang-Jensen, B., et al. 2012b, ApJ, 758, 46 [NASA ADS] [CrossRef] [Google Scholar]
- Ledoux, C., Srianand, R., & Petitjean, P. 2002, A&A, 392, 781 [NASA ADS] [CrossRef] [EDP Sciences] [Google Scholar]
- Ledoux, C., Petitjean, P., & Srianand, R. 2003, MNRAS, 346, 209 [NASA ADS] [CrossRef] [Google Scholar]
- Ledoux, C., Petitjean, P., Fynbo, J. P. U., Møller, P., & Srianand, R. 2006, A&A, 457, 71 [NASA ADS] [CrossRef] [EDP Sciences] [MathSciNet] [Google Scholar]
- Ledoux, C., Vreeswijk, P. M., Smette, A., et al. 2009, A&A, 506, 661 [NASA ADS] [CrossRef] [EDP Sciences] [Google Scholar]
- Leroy, A. K., Bolatto, A., Gordon, K., et al. 2011, ApJ, 737, 12 [NASA ADS] [CrossRef] [Google Scholar]
- Levshakov, S. A., & Varshalovich, D. A. 1985, MNRAS, 212, 517 [NASA ADS] [Google Scholar]
- Lodders, K., Palme, H., & Gail, H.-P. 2009, Landolt Börnstein, 44 [Google Scholar]
- Malec, A. L., Buning, R., Murphy, M. T., et al. 2010, MNRAS, 403, 1541 [NASA ADS] [CrossRef] [Google Scholar]
- Malesani, D., Schulze, S., de Ugarte Postigo, A., et al. 2012, GCN, 13649 [Google Scholar]
- Markwardt, C. B., Barthelmy, S. D., Baumgartner, W. H., et al. 2012, GCN, 13652 [Google Scholar]
- McKee, C. F., & Ostriker, E. C. 2007, ARA&A, 45, 565 [NASA ADS] [CrossRef] [Google Scholar]
- Ménard, B., Nestor, D., Turnshek, D., et al. 2008, MNRAS, 385, 1053 [NASA ADS] [CrossRef] [Google Scholar]
- Meyer, D. M., Lauroesch, J. T., Sofia, U. J., Draine, B. T., & Bertoldi, F. 2001, ApJ, 553, L59 [NASA ADS] [CrossRef] [Google Scholar]
- Milvang-Jensen, B., Fynbo, J. P. U., Malesani, D., et al. 2012, ApJ, 756, 25 [NASA ADS] [CrossRef] [Google Scholar]
- Møller, P. 2000, The Messenger, 99, 31 [NASA ADS] [Google Scholar]
- Morton, D. C. 2003, ApJS, 149, 205 [NASA ADS] [CrossRef] [MathSciNet] [Google Scholar]
- Morton, D. C., & Noreau, L. 1994, ApJS, 95, 301 [NASA ADS] [CrossRef] [Google Scholar]
- Nardini, M., Ghisellini, G., Ghirlanda, G., & Celotti, A. 2010, MNRAS, 403, 1131 [NASA ADS] [CrossRef] [Google Scholar]
- Noterdaeme, P., Ledoux, C., Petitjean, P., & Srianand, R. 2008, A&A, 481, 327 [NASA ADS] [CrossRef] [EDP Sciences] [Google Scholar]
- Noterdaeme, P., Ledoux, C., Srianand, R., Petitjean, P., & Lopez, S. 2009, A&A, 503, 765 [NASA ADS] [CrossRef] [EDP Sciences] [Google Scholar]
- Noterdaeme, P., Petitjean, P., Ledoux, C., et al. 2010, A&A, 523, A80 [NASA ADS] [CrossRef] [EDP Sciences] [Google Scholar]
- Noterdaeme, P., Petitjean, P., Srianand, R., Ledoux, C., & López, S. 2011, A&A, 526, L7 [NASA ADS] [CrossRef] [EDP Sciences] [Google Scholar]
- Noterdaeme, P., Laursen, P., Petitjean, P., et al. 2012a, A&A, 540, A63 [NASA ADS] [CrossRef] [EDP Sciences] [Google Scholar]
- Noterdaeme, P., Petitjean, P., Carithers, W. C., et al. 2012b, A&A, 547, L1 [NASA ADS] [CrossRef] [EDP Sciences] [Google Scholar]
- Ogle, P., Davies, J. E., Appleton, P. N., et al. 2012, ApJ, 751, 13 [NASA ADS] [CrossRef] [Google Scholar]
- Pagani, C., Barthelmy, S. D., Gehrels, N., et al. 2012, GCN, 13645 [Google Scholar]
- Pei, Y. C. 1992, ApJ, 395, 130 [NASA ADS] [CrossRef] [Google Scholar]
- Perley, D. A., Morgan, A. N., Updike, A., et al. 2011, AJ, 141, 36 [NASA ADS] [CrossRef] [Google Scholar]
- Perley, D. A., Levan, A. J., Tanvir, N. R., et al. 2013, ApJ, submitted [arXiv:1301.5903] [Google Scholar]
- Petitjean, P., Srianand, R., & Ledoux, C. 2000, A&A, 364, L26 [NASA ADS] [Google Scholar]
- Petitjean, P., Srianand, R., & Ledoux, C. 2002, MNRAS, 332, 383 [NASA ADS] [CrossRef] [Google Scholar]
- Petitjean, P., Ledoux, C., Noterdaeme, P., & Srianand, R. 2006, A&A, 456, L9 [NASA ADS] [CrossRef] [EDP Sciences] [Google Scholar]
- Pettini, M., Rix, S. A., Steidel, C. C., et al. 2002, ApJ, 569, 742 [NASA ADS] [CrossRef] [Google Scholar]
- Predehl, P., & Schmitt, J. H. M. M. 1995, A&A, 293, 889 [NASA ADS] [Google Scholar]
- Prochaska, J. X. 2006, ApJ, 650, 272 [NASA ADS] [CrossRef] [MathSciNet] [Google Scholar]
- Prochaska, J. X., Herbert-Fort, S., & Wolfe, A. M. 2005, ApJ, 635, 123 [NASA ADS] [CrossRef] [Google Scholar]
- Prochaska, J. X., Chen, H., & Bloom, J. S. 2006, ApJ, 648, 95 [NASA ADS] [CrossRef] [Google Scholar]
- Prochaska, J. X., Chen, H.-W., Bloom, J. S., et al. 2007a, ApJS, 168, 231 [NASA ADS] [CrossRef] [Google Scholar]
- Prochaska, J. X., Chen, H.-W., Dessauges-Zavadsky, M., & Bloom, J. S. 2007b, ApJ, 666, 267 [NASA ADS] [CrossRef] [Google Scholar]
- Prochaska, J. X., Dessauges-Zavadsky, M., Ramirez-Ruiz, E., & Chen, H.-W. 2008a, ApJ, 685, 344 [NASA ADS] [CrossRef] [Google Scholar]
- Prochaska, J. X., Shiode, J., Bloom, J. S., et al. 2008b, GRB Coordinates Network, 7849 [Google Scholar]
- Prochaska, J. X., Sheffer, Y., Perley, D. A., et al. 2009, ApJ, 691, L27 [NASA ADS] [CrossRef] [Google Scholar]
- Rau, A., Savaglio, S., Krühler, T., et al. 2010, ApJ, 720, 862 [NASA ADS] [CrossRef] [Google Scholar]
- Richard, J., Jones, T., Ellis, R., et al. 2011, MNRAS, 413, 643 [NASA ADS] [CrossRef] [Google Scholar]
- Roming, P. W. A., Kennedy, T. E., Mason, K. O., et al. 2005, Space Sci. Rev., 120, 95 [NASA ADS] [CrossRef] [Google Scholar]
- Rossi, A., Klose, S., Ferrero, P., et al. 2012, A&A, 545, A77 [Google Scholar]
- Savage, B. D., Bohlin, R. C., Drake, J. F., & Budich, W. 1977, ApJ, 216, 291 [NASA ADS] [CrossRef] [Google Scholar]
- Savaglio, S. 2006, New J. Phys., 8, 195 [NASA ADS] [CrossRef] [Google Scholar]
- Savaglio, S., & Fall, S. M. 2004, ApJ, 614, 293 [NASA ADS] [CrossRef] [Google Scholar]
- Savaglio, S., Fall, S. M., & Fiore, F. 2003, ApJ, 585, 638 [NASA ADS] [CrossRef] [Google Scholar]
- Savaglio, S., Glazebrook, K., & Le Borgne, D. 2009, ApJ, 691, 182 [NASA ADS] [CrossRef] [MathSciNet] [Google Scholar]
- Savaglio, S., Rau, A., Greiner, J., et al. 2012, MNRAS, 420, 627 [NASA ADS] [CrossRef] [Google Scholar]
- Schady, P., Mason, K. O., Page, M. J., et al. 2007, MNRAS, 377, 273 [NASA ADS] [CrossRef] [Google Scholar]
- Schady, P., Page, M. J., Oates, S. R., et al. 2010, MNRAS, 401, 2773 [NASA ADS] [CrossRef] [Google Scholar]
- Schady, P., Dwelly, T., Page, M. J., et al. 2012, A&A, 537, A15 [NASA ADS] [CrossRef] [EDP Sciences] [Google Scholar]
- Schaye, J. 2001, ApJ, 562, L95 [NASA ADS] [CrossRef] [Google Scholar]
- Schlafly, E. F., & Finkbeiner, D. P. 2011, ApJ, 737, 103 [NASA ADS] [CrossRef] [Google Scholar]
- Schruba, A., Leroy, A. K., Walter, F., et al. 2012, AJ, 143, 138 [NASA ADS] [CrossRef] [Google Scholar]
- Schulze, S., Klose, S., Björnsson, G., et al. 2011, A&A, 526, A23 [NASA ADS] [CrossRef] [EDP Sciences] [Google Scholar]
- Sheffer, Y., Prochaska, J. X., Draine, B. T., Perley, D. A., & Bloom, J. S. 2009, ApJ, 701, L63 [NASA ADS] [CrossRef] [Google Scholar]
- Shu, F. H., Adams, F. C., & Lizano, S. 1987, ARA&A, 25, 23 [Google Scholar]
- Silva, A. I., & Viegas, S. M. 2002, MNRAS, 329, 135 [NASA ADS] [CrossRef] [Google Scholar]
- Skrutskie, M. F., Cutri, R. M., Stiening, R., et al. 2006, AJ, 131, 1163 [NASA ADS] [CrossRef] [Google Scholar]
- Snow, T. P., & McCall, B. J. 2006, ARA&A, 44, 367 [NASA ADS] [CrossRef] [Google Scholar]
- Srianand, R., & Petitjean, P. 1998, A&A, 335, 33 [NASA ADS] [Google Scholar]
- Srianand, R., Petitjean, P., Ledoux, C., Ferland, G., & Shaw, G. 2005, MNRAS, 362, 549 [Google Scholar]
- Srianand, R., Noterdaeme, P., Ledoux, C., & Petitjean, P. 2008, A&A, 482, L39 [NASA ADS] [CrossRef] [EDP Sciences] [Google Scholar]
- Sudilovsky, V., Kann, D. A., & Greiner, J. 2012, GCN, 13648 [Google Scholar]
- Tacconi, L. J., Genzel, R., Neri, R., et al. 2010, Nature, 463, 781 [Google Scholar]
- Thompson, R. I., Lebofsky, M. J., & Rieke, G. H. 1978, ApJ, 222, L49 [NASA ADS] [CrossRef] [Google Scholar]
- Thöne, C. C., Wiersema, K., Ledoux, C., et al. 2008, A&A, 489, 37 [NASA ADS] [CrossRef] [EDP Sciences] [Google Scholar]
- Thöne, C. C., Fynbo, J. P. U., Goldoni, P., et al. 2013, MNRAS, 428, 3590 [NASA ADS] [CrossRef] [Google Scholar]
- Tody, D. 1993, in Astronomical Data Analysis Software and Systems II, ASPC Ser., 52, 173 [NASA ADS] [Google Scholar]
- Tumlinson, J., Shull, J. M., Rachford, B. L., et al. 2002, ApJ, 566, 857 [NASA ADS] [CrossRef] [Google Scholar]
- Tumlinson, J., Prochaska, J. X., Chen, H.-W., Dessauges-Zavadsky, M., & Bloom, J. S. 2007, ApJ, 668, 667 [NASA ADS] [CrossRef] [Google Scholar]
- Varshalovich, D. A., Ivanchik, A. V., Petitjean, P., Srianand, R., & Ledoux, C. 2001, Astron. Lett., 27, 683 [NASA ADS] [CrossRef] [Google Scholar]
- Veilleux, S., Goodrich, R. W., & Hill, G. J. 1997, ApJ, 477, 631 [NASA ADS] [CrossRef] [Google Scholar]
- Vergani, S. D., Petitjean, P., Ledoux, C., et al. 2009, A&A, 503, 771 [NASA ADS] [CrossRef] [EDP Sciences] [Google Scholar]
- Verner, E. M., Verner, D. A., Korista, K. T., et al. 1999, ApJS, 120, 101 [NASA ADS] [CrossRef] [Google Scholar]
- Vernet, J., Dekker, H., D’Odorico, S., et al. 2011, A&A, 536, A105 [NASA ADS] [CrossRef] [EDP Sciences] [Google Scholar]
- Vladilo, G., Centurión, M., Levshakov, S. A., et al. 2006, A&A, 454, 151 [NASA ADS] [CrossRef] [EDP Sciences] [Google Scholar]
- Vreeswijk, P. M., Ellison, S. L., Ledoux, C., et al. 2004, A&A, 419, 927 [NASA ADS] [CrossRef] [EDP Sciences] [Google Scholar]
- Vreeswijk, P. M., Ledoux, C., Smette, A., et al. 2007, A&A, 468, 83 [NASA ADS] [CrossRef] [EDP Sciences] [Google Scholar]
- Vreeswijk, P. M., Ledoux, C., Smette, A., et al. 2011, A&A, 532, C3 [NASA ADS] [CrossRef] [EDP Sciences] [Google Scholar]
- Vreeswijk, P. M., Ledoux, C., Raassen, A. J. J., et al. 2013, A&A, 549, A22 [NASA ADS] [CrossRef] [EDP Sciences] [Google Scholar]
- Watson, D., Fynbo, J. P. U., Ledoux, C., et al. 2006, ApJ, 652, 1011 [NASA ADS] [CrossRef] [Google Scholar]
- Watson, D., Zafar, T., Andersen, A. C., et al. 2013, ApJ, 768, 23 [NASA ADS] [CrossRef] [Google Scholar]
- Welty, D. E., Federman, S. R., Gredel, R., Thorburn, J. A., & Lambert, D. L. 2006, ApJS, 165, 138 [NASA ADS] [CrossRef] [Google Scholar]
- Whalen, D., Prochaska, J. X., Heger, A., & Tumlinson, J. 2008, ApJ, 682, 1114 [NASA ADS] [CrossRef] [Google Scholar]
- Zafar, T., Watson, D., Elíasdóttir, Á., et al. 2012, ApJ, 753, 82 [NASA ADS] [CrossRef] [Google Scholar]
All Tables
All Figures
|
Fig. 1 NIR-to-X-ray spectral energy distribution and model for the afterglow of GRB 120815A at 7.3 ks after the trigger. Solid lines show the model including gas and dust absorption, while the dashed line illustrates the underlying synchrotron continuum emission. X-ray data have been binned to yield a S/N of at least 8 to enhance clarity. The g′-band photometry is not fitted, because this filter extends bluewards of the Lyα transition. |
| In the text | |
|
Fig. 2 X-shooter spectrum around the damped Lyα absorption. Black lines are the X-shooter data and noise level, both binned for clarity. The red-shaded region shows the fit to the damped Lyα absorption line using the combination of a Voigt profile with log (N(H i)/cm-2) = 21.95 ± 0.10 and the H |
| In the text | |
|
Fig. 3 One- and two-dimensional, afterglow-subtracted X-shooter spectrum centered around the location of [O iii](λ 5007) at z = 2.3586 (i.e., observed 16 820 Å). The one-dimensional spectrum (black data) fitted by a Gaussian (black line) is plotted against the left y-axis, while the scaling of the two-dimensional spectrum is shown by the color-bar on the right side of the plot. The two-dimensional spectrum has been smoothed by a Gaussian kernel with a FWHM of 1 pixel (0.5 Å) along the dispersion x-axis, and 2 pixel (i.e., 0 |
| In the text | |
|
Fig. 4 Absorption lines and Voigt-profile fits in the GRB 120815A afterglow spectrum. Dark-grey circles and lines show the normalized spectrum with statistical errors and the line fit, respectively. Light-grey circles show the residuals between data and best fit. The instrumental resolution of X-shooter and its error is indicated by shaded, blue areas in panels 2 (VIS arm) and 7 (UVB arm). The position of individual metal lines of the two absorbing systems is indicated by vertical dotted lines. Absorption by strong telluric lines is marked with a circled plus (panel 3). |
| In the text | |
|
Fig. 5 X-shooter spectrum between 3300 and 4200 Å illustrating the presence of H2 absorption. The uppermost, blue-framed panel shows an overview, while the lower 5 panels show zoom-ins of 100 Å each below 3800 Å, where most of the Lyman-Werner absorption bands are located. Light-grey lines are the normalized spectrum, while dark-grey lines indicate the error spectrum. The solid red line denote the synthetic H2 model, with individual transitions up to J = 5 transitions marked with red labels. The dashed lines show synthetic H2 models corresponding to the 1σ errors on the measured molecular content. In the top panel, we also mark prominent metal absorption lines previously detected in GRB-DLAs (Christensen et al. 2011) and those of the intervening systems. In the lower panels, J0,J1, and so forth denote transitions from the J = 0, J = 1 rotational level of the vibrational ground state of the Lyman-Werner bands of H2. |
| In the text | |
|
Fig. 6 Several cut-outs of illustrative parts of the normalized X-shooter UVB arm spectrum showing the presence of H |
| In the text | |
|
Fig. 7 Logarithmic Δχ2 distribution for different H |
| In the text | |
|
Fig. 8 The central panel shows metallicity versus hydrogen column density for QSO and GRB DLAs in which H2 was extensively searched for. Circles are QSO-DLAs, where red and yellow circles correspond to DLAs with and without significant molecular hydrogen. Blue data are GRB-DLAs and the blue stars are GRB 120815A and GRB 080607, where H2 has been detected. The grey background shading indicates the parameter space where many of the more dust-extinguished GRB-DLAs are located (see details in Sect. 4.3.3). The upper and right panels illustrate the respective normalized histograms. Blue hatched histogram are GRBs including both H2-poor and H2-rich sightlines due to low number statistics. Red-filled and yellow histograms are QSO-DLAs with and without molecular hydrogen, respectively. Data for QSOs are from Noterdaeme et al. (2008); Fynbo et al. (2010, 2011); Guimarães et al. (2012), data from GRBs from Ledoux et al. (2009); Prochaska et al. (2009); D’Elia et al. (2010). |
| In the text | |
|
Fig. 9 Depletion of QSO and GRB DLAs versus their metallicity. Symbols, colors and shadings are the same as in Fig. 8. GRB 080607 is not shown in this plot because no constraints on the depletion factor are available (Prochaska et al. 2009). |
| In the text | |
|
Fig. A.1 GROND optical/NIR and XRT 0.3−10 keV light curves of the afterglow of GRB 120815A in the top panel. The data were fitted with a three-segment, smoothly broken power-law, with residuals shown in the bottom panel. The grey shaded area represents the time interval in which the X-shooter spectroscopy was obtained. X-ray data were converted into a flux density at 3 keV using a spectral index of β = 0.78, and scaled by a factor of 20 to enhance clarity. |
| In the text | |
|
Fig. B.1 X-shooter UVB-arm spectrum of the afterglow of GRB 120815A. Black lines show the spectral data, grey lines the noise level, the green line is the GRB afterglow model, and the red-line shows the DLA modeling. The position of absorption lines that are typically associated with GRB-DLAs (taken from Christensen et al. 2011) are indicated by brown lines and ions. Individual lines associated with intervening absorbers are labeled with colored lines and labels. |
| In the text | |
|
Fig. B.2 X-shooter VIS-arm spectrum of the afterglow of GRB 120815A. Lines and labels are the same as in Fig. B.1. Additionally, strong telluric lines are indicated by circles in the upper part of each panel. |
| In the text | |
|
Fig. B.3 X-shooter NIR-arm spectrum of the afterglow of GRB 120815A. Lines and labels are the same as in Fig. B.2. |
| In the text | |
|
Fig. B.4 X-shooter spectrum between 4100 and 5600 Å showing the presence of H |
| In the text | |
Current usage metrics show cumulative count of Article Views (full-text article views including HTML views, PDF and ePub downloads, according to the available data) and Abstracts Views on Vision4Press platform.
Data correspond to usage on the plateform after 2015. The current usage metrics is available 48-96 hours after online publication and is updated daily on week days.
Initial download of the metrics may take a while.