Fig. 3
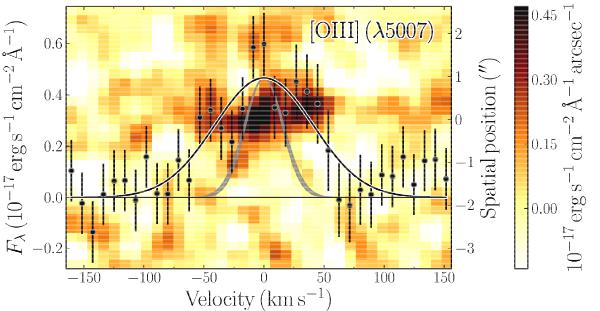
One- and two-dimensional, afterglow-subtracted X-shooter spectrum centered around the location of [O iii](λ 5007) at z = 2.3586 (i.e., observed 16 820 Å). The one-dimensional spectrum (black data) fitted by a Gaussian (black line) is plotted against the left y-axis, while the scaling of the two-dimensional spectrum is shown by the color-bar on the right side of the plot. The two-dimensional spectrum has been smoothed by a Gaussian kernel with a FWHM of 1 pixel (0.5 Å) along the dispersion x-axis, and 2 pixel (i.e., 0 4) along the spatial y-axis for illustration purposes. The grey-shaded area represents the spectral resolution.
Current usage metrics show cumulative count of Article Views (full-text article views including HTML views, PDF and ePub downloads, according to the available data) and Abstracts Views on Vision4Press platform.
Data correspond to usage on the plateform after 2015. The current usage metrics is available 48-96 hours after online publication and is updated daily on week days.
Initial download of the metrics may take a while.