Fig. 6
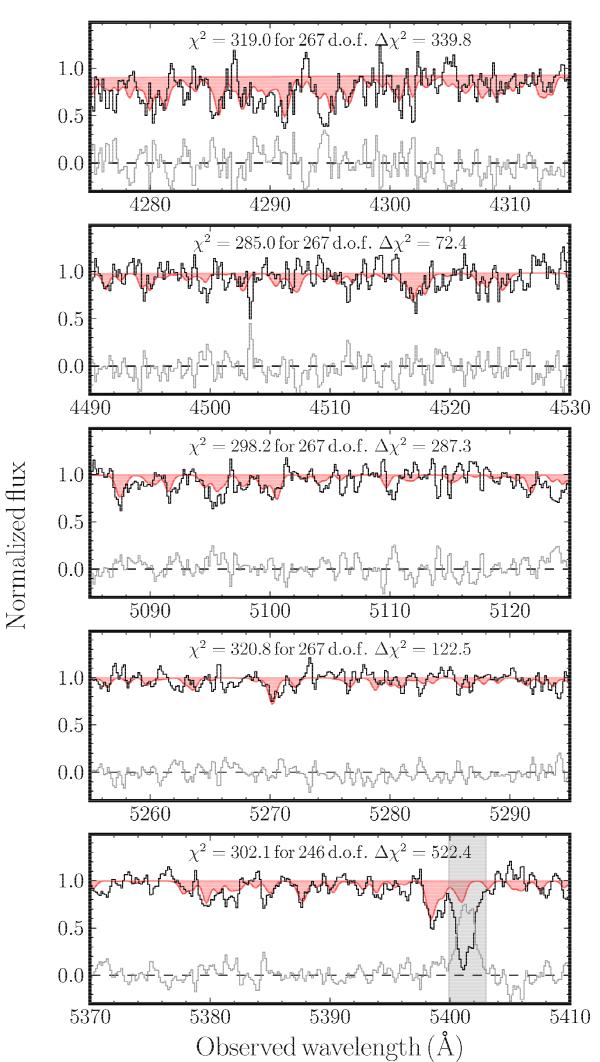
Several cut-outs of illustrative parts of the normalized X-shooter UVB arm spectrum showing the presence of H lines. The regions have been chosen to have at least one strong transition of H and to be little affected by blending. The black lines show the data, red lines the best-fit model, and grey lines the residuals. Grey shaded regions are ignored in the fitting because of blending with metal absorption lines. In each panel we also give the best-fit χ2, as well as the improvement Δχ2 as compared to an unmodified spectrum.
Current usage metrics show cumulative count of Article Views (full-text article views including HTML views, PDF and ePub downloads, according to the available data) and Abstracts Views on Vision4Press platform.
Data correspond to usage on the plateform after 2015. The current usage metrics is available 48-96 hours after online publication and is updated daily on week days.
Initial download of the metrics may take a while.