Fig. 8
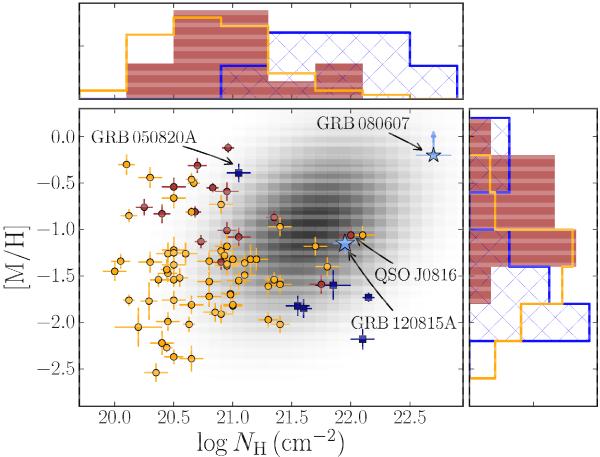
The central panel shows metallicity versus hydrogen column density for QSO and GRB DLAs in which H2 was extensively searched for. Circles are QSO-DLAs, where red and yellow circles correspond to DLAs with and without significant molecular hydrogen. Blue data are GRB-DLAs and the blue stars are GRB 120815A and GRB 080607, where H2 has been detected. The grey background shading indicates the parameter space where many of the more dust-extinguished GRB-DLAs are located (see details in Sect. 4.3.3). The upper and right panels illustrate the respective normalized histograms. Blue hatched histogram are GRBs including both H2-poor and H2-rich sightlines due to low number statistics. Red-filled and yellow histograms are QSO-DLAs with and without molecular hydrogen, respectively. Data for QSOs are from Noterdaeme et al. (2008); Fynbo et al. (2010, 2011); Guimarães et al. (2012), data from GRBs from Ledoux et al. (2009); Prochaska et al. (2009); D’Elia et al. (2010).
Current usage metrics show cumulative count of Article Views (full-text article views including HTML views, PDF and ePub downloads, according to the available data) and Abstracts Views on Vision4Press platform.
Data correspond to usage on the plateform after 2015. The current usage metrics is available 48-96 hours after online publication and is updated daily on week days.
Initial download of the metrics may take a while.