Fig. B.4
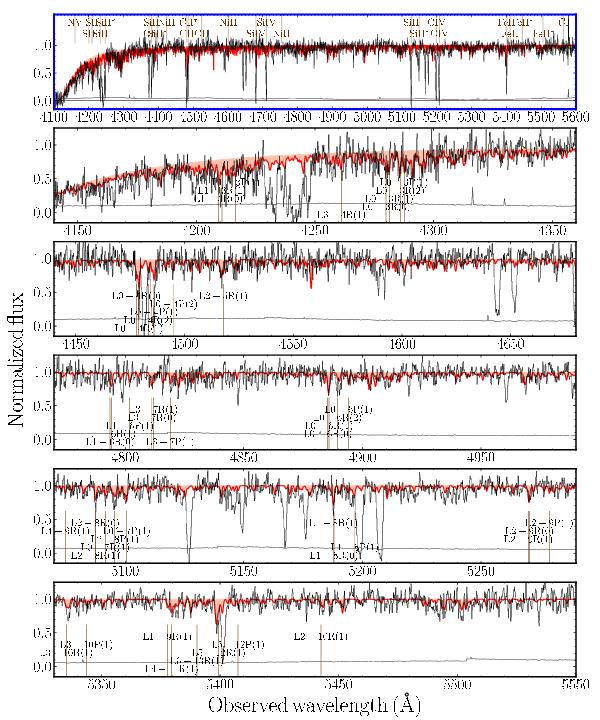
X-shooter spectrum between 4100 and 5600 Å showing the presence of H lines. The uppermost, blue-framed panel shows an overview over the whole spectral range, while the lower 5 panels zoom in of 180 Å each. We selected regions where most of the absorption bands of H are located. Light-grey lines always show the normalized spectrum, while dark-grey lines indicate the error spectrum. Red lines denote the best-fit H model. In the top panel, we also mark prominent metal absorption lines previously detected in GRB-DLAs (Christensen et al. 2011). In the lower panels, several individual H transitions are identified using standard nomenclature with lower and upper vibrational and rotational quantum numbers.
Current usage metrics show cumulative count of Article Views (full-text article views including HTML views, PDF and ePub downloads, according to the available data) and Abstracts Views on Vision4Press platform.
Data correspond to usage on the plateform after 2015. The current usage metrics is available 48-96 hours after online publication and is updated daily on week days.
Initial download of the metrics may take a while.