Fig. 2
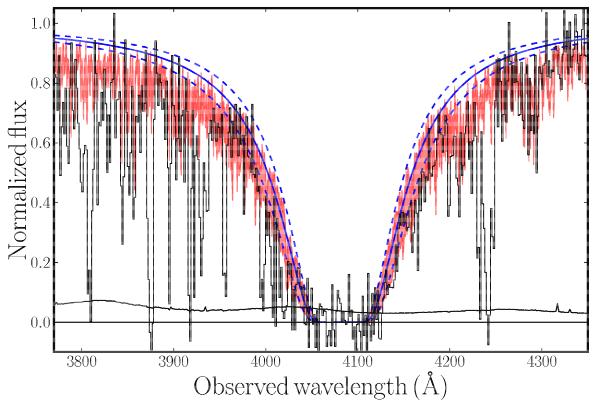
X-shooter spectrum around the damped Lyα absorption. Black lines are the X-shooter data and noise level, both binned for clarity. The red-shaded region shows the fit to the damped Lyα absorption line using the combination of a Voigt profile with log (N(H i)/cm-2) = 21.95 ± 0.10 and the H -model from Sect. 3.2.7. The blue solid and dashed lines illustrate a damped Lyα profile and associated 1σ uncertainties, respectively, that correspond to log (N(H i)/cm-2) = 21.95 ± 0.10, but without the vibrationally-excited transitions of molecular hydrogen.
Current usage metrics show cumulative count of Article Views (full-text article views including HTML views, PDF and ePub downloads, according to the available data) and Abstracts Views on Vision4Press platform.
Data correspond to usage on the plateform after 2015. The current usage metrics is available 48-96 hours after online publication and is updated daily on week days.
Initial download of the metrics may take a while.