Fig. A.1
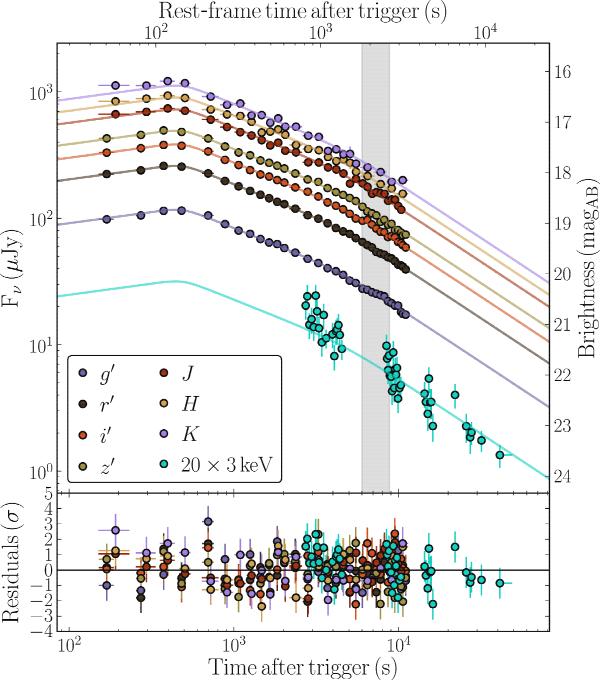
GROND optical/NIR and XRT 0.3−10 keV light curves of the afterglow of GRB 120815A in the top panel. The data were fitted with a three-segment, smoothly broken power-law, with residuals shown in the bottom panel. The grey shaded area represents the time interval in which the X-shooter spectroscopy was obtained. X-ray data were converted into a flux density at 3 keV using a spectral index of β = 0.78, and scaled by a factor of 20 to enhance clarity.
Current usage metrics show cumulative count of Article Views (full-text article views including HTML views, PDF and ePub downloads, according to the available data) and Abstracts Views on Vision4Press platform.
Data correspond to usage on the plateform after 2015. The current usage metrics is available 48-96 hours after online publication and is updated daily on week days.
Initial download of the metrics may take a while.