Fig. 4
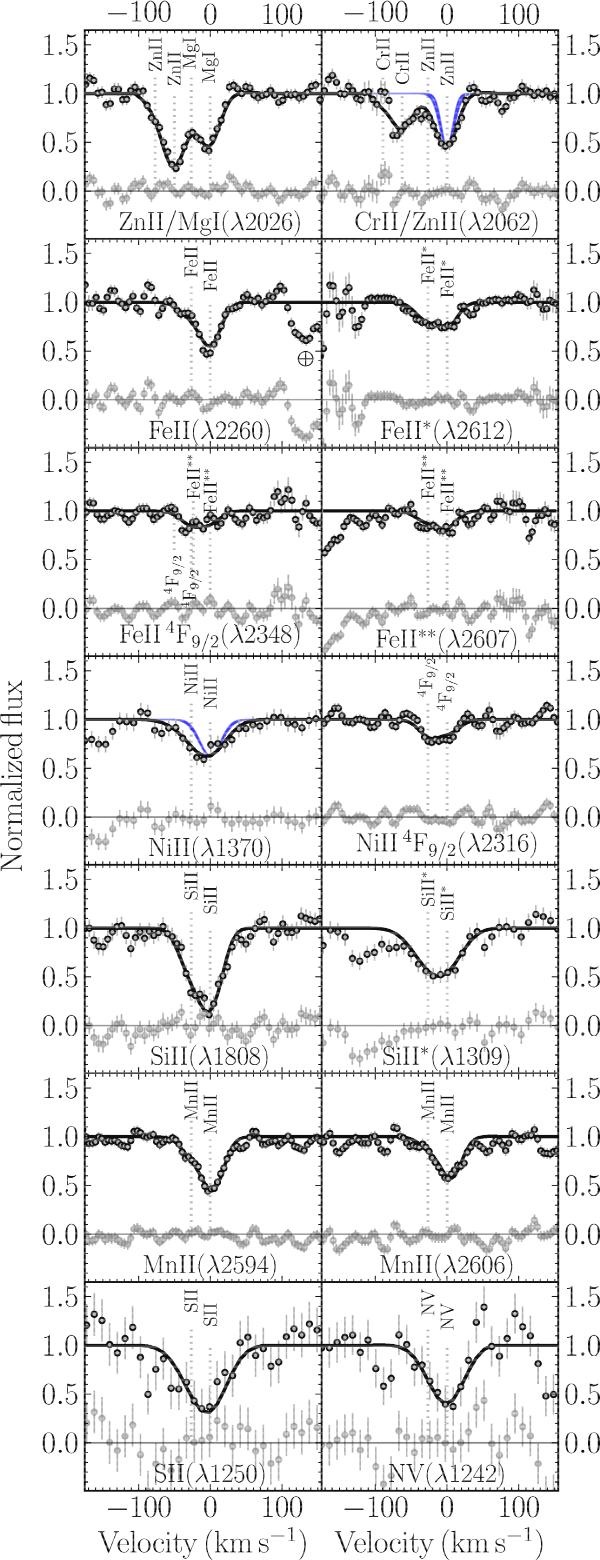
Absorption lines and Voigt-profile fits in the GRB 120815A afterglow spectrum. Dark-grey circles and lines show the normalized spectrum with statistical errors and the line fit, respectively. Light-grey circles show the residuals between data and best fit. The instrumental resolution of X-shooter and its error is indicated by shaded, blue areas in panels 2 (VIS arm) and 7 (UVB arm). The position of individual metal lines of the two absorbing systems is indicated by vertical dotted lines. Absorption by strong telluric lines is marked with a circled plus (panel 3).
Current usage metrics show cumulative count of Article Views (full-text article views including HTML views, PDF and ePub downloads, according to the available data) and Abstracts Views on Vision4Press platform.
Data correspond to usage on the plateform after 2015. The current usage metrics is available 48-96 hours after online publication and is updated daily on week days.
Initial download of the metrics may take a while.