Fig. 1
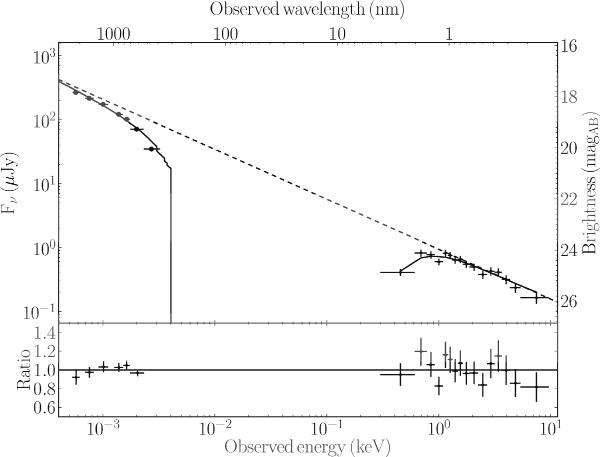
NIR-to-X-ray spectral energy distribution and model for the afterglow of GRB 120815A at 7.3 ks after the trigger. Solid lines show the model including gas and dust absorption, while the dashed line illustrates the underlying synchrotron continuum emission. X-ray data have been binned to yield a S/N of at least 8 to enhance clarity. The g′-band photometry is not fitted, because this filter extends bluewards of the Lyα transition.
Current usage metrics show cumulative count of Article Views (full-text article views including HTML views, PDF and ePub downloads, according to the available data) and Abstracts Views on Vision4Press platform.
Data correspond to usage on the plateform after 2015. The current usage metrics is available 48-96 hours after online publication and is updated daily on week days.
Initial download of the metrics may take a while.