| Issue |
A&A
Volume 699, July 2025
|
|
|---|---|---|
| Article Number | A101 | |
| Number of page(s) | 15 | |
| Section | Cosmology (including clusters of galaxies) | |
| DOI | https://doi.org/10.1051/0004-6361/202554468 | |
| Published online | 02 July 2025 | |
Enhanced strong-lensing model of MACS J0138.0–2155 based on new JWST and VLT/MUSE observations
1
Instituto de Física de Cantabria (CSIC-UC), Avda. Los Castros s/n, 39005 Santander, Spain
2
INAF – IASF Milano, via A. Corti 12, I-20133 Milano, Italy
3
Dipartimento di Fisica, Università degli Studi di Milano, via Celoria 16, I-20133 Milano, Italy
4
INAF – OAS, Osservatorio di Astrofisica e Scienza dello Spazio di Bologna, via Gobetti 93/3, I-40129 Bologna, Italy
5
Dipartimento di Fisica e Scienze della Terra, Università degli Studi di Ferrara, via Saragat 1, I-44122 Ferrara, Italy
6
INAF – Osservatorio Astrofisico di Arcetri, Largo E. Fermi 5, I-50125 Firenze, Italy
7
Technical University of Munich, TUM School of Natural Sciences, Physics Department, James-Franck-Straße 1, 85748 Garching, Germany
8
Max-Planck-Institut für Astrophysik, Karl-Schwarzschild Straße 1, 85748 Garching, Germany
9
Institute of Cosmology and Gravitation, University of Portsmouth, Burnaby Rd, Portsmouth PO1 3FX, UK
10
Space Telescope Science Institute, 3700 San Martin Drive, Baltimore, MD 21218, USA
11
Department of Astronomy/Steward Observatory, University of Arizona, 933 N Cherry Ave, Tucson, AZ 85721-0009, USA
⋆ Corresponding author: This email address is being protected from spambots. You need JavaScript enabled to view it.
Received:
11
March
2025
Accepted:
22
May
2025
Abstract
We present a new parametric strong-lensing analysis of the galaxy cluster MACS J0138.0–2155 at zL = 0.336. This is the first lens cluster known to show two multiply imaged supernova (SN) siblings, SN Requiem and SN Encore at zSNe = 1.949, enabling a new measurement of the Hubble constant value from the measured relative time delays. We exploited Hubble Space Telescope and James Webb Space Telescope multi-band imaging in synergy with new Multi Unit Spectroscopic Explorer follow-up spectroscopy to develop an improved lens mass model. Specifically, we included 84 cluster members (∼60% of which are spectroscopically confirmed) and two perturber galaxies along the line of sight. Our observables consisted of 23 spectroscopically confirmed multiple images from eight background sources, spanning a fairly wide redshift range from 0.767 to 3.420. To accurately characterise the sub-halo mass component, we calibrated the Faber-Jackson scaling relation based on the stellar kinematic measurements of a subset of 14 bright cluster galaxies. We built several lens models by implementing different cluster total mass parametrisations to assess the statistical and systematic uncertainties on the predicted values of the position and magnification of the observed and future multiple images of SN Requiem and SN Encore. Our reference best-fit lens model reproduces the observed positions of the multiple images with a root mean square offset of 0.″36 and the multiple-image positions of the SNe and their host galaxy with a remarkable mean precision of only 0.″05. We measure a projected total mass of M(<60 kpc) = 2.89−0.03+0.04 × 10¹³ M⊙, which is consistent with that independently derived from the X-ray analysis of archival data from the Chandra observatory. We also demonstrate the reliability of the new lens model by reconstructing the extended surface-brightness distribution of the multiple images of the host galaxy. The significant discrepancy between the magnification values predicted by our reference model and those from previous studies, which is critical for understanding the intrinsic properties of the two SNe and their host galaxy, further underscores the need to combine cutting-edge observations with a detailed lens modelling.
Key words: gravitational lensing: strong / galaxies: clusters: general / galaxies: clusters: individual: MACS J0138.0–2155 / dark matter
© The Authors 2025
 Open Access article, published by EDP Sciences, under the terms of the Creative Commons Attribution License (https://creativecommons.org/licenses/by/4.0), which permits unrestricted use, distribution, and reproduction in any medium, provided the original work is properly cited.
This article is published in open access under the Subscribe to Open model. This email address is being protected from spambots. You need JavaScript enabled to view it. to support open access publication.
1. Introduction
While the Hubble Space Telescope (HST) has revolutionised the field of strong lensing in galaxy clusters with its multi-band high-resolution imaging, the James Webb Space Telescope (JWST) has already achieved a similar degree of advancement only three years after its launch. In the cluster strong-lensing field, the unprecedented capabilities of the JWST have enabled the identification of large samples of multiple images up to z ∼ 10 (Roberts-Borsani et al. 2023; Williams et al. 2023). In combination with follow-up spectroscopy from the Multi Unit Spectroscopic Explorer (MUSE, Bacon et al. 2010, 2014), which is mounted on the Very Large Telescope (VLT), a new generation of cluster-scale strong-lensing models have emerged (e.g. Caminha et al. 2022; Bergamini et al. 2023a; Diego et al. 2024; Furtak et al. 2023; Rihtaršič et al. 2025).
Two recent and particularly interesting findings by the JWST have been the discoveries of two supernovae (SNe) that are strongly lensed by galaxy clusters, SN H0pe (Frye et al. 2024; Pierel et al. 2024a; Pascale et al. 2025) and SN Encore (Pierel et al. 2024b). Leveraging the measured time delays between the multiple images of an SN together with a robust total mass reconstruction of the lens galaxy cluster allows for an independent one-step measurement of the Hubble constant (H0) value and the parameter values of the matter density, dark energy density, and dark energy density equation of state (Grillo et al. 2024).
MACS J0138.0–2155 (MACS J0138, hereafter) is a massive lens galaxy cluster at zL = 0.336 and the first galaxy cluster that is known to strongly lens two SNe in the same host galaxy at z = 1.949, called SN Requiem (Rodney et al. 2021) and SN Encore (Pierel et al. 2024b). Rodney et al. (2021) reported the discovery of three multiple images of SN Requiem in archival HST observations of MACS J0138, which was photometrically classified as a Type Ia SN (SN Ia). They also measured the relative time delays between the multiple images, with significantly large uncertainties (∼26% for the longest time delay). Three multiple images of SN Encore were then discovered in the JWST imaging of MACS J0138, one of which was spectroscopically confirmed as an SN Ia (Pierel et al. 2024b; Dhawan et al. 2024). The time delays between the observed multiple images of SN Encore are measured by Pierel et al. (in prep.). The study of the strongly-lensed host galaxy, MRG-M0138, is also worth on its own, being is one of the brightest lensed galaxies known in the near-infrared (F160W = 17.1, Newman et al. 2018a,b, 2025; Akhshik et al. 2020, 2023).
An event such as SN Encore provides a unique opportunity to blindly test the validity and robustness of the cluster-scale lens models of MACS J0138, as previously carried out with SN Refsdal and SN H0pe, which are strongly lensed by MACS J1149.5+2223 (Kelly et al. 2016, 2023; Treu et al. 2016) and PLCK G165.7+67.0 (Pascale et al. 2025), respectively. Seven independent groups used different strong-lensing modelling approaches and software and participated in the blind-modelling challenge of the galaxy cluster MACS J0138, in which the measured time delays between the multiple images of SN Encore were unknown to the lens modellers. The seven groups agreed on the secure samples of multiple images, cluster members, and line-of-sight perturbers to be included in their independent strong-lensing analyses based on recent JWST and VLT/MUSE observations. The collaboration and the comparison between the seven model predictions of the time-delay and magnification values for both SN Encore and SN Requiem are presented by Suyu et al. (in prep.).
In this context, we present here a new strong-lensing model of the galaxy cluster MACS J0138 with the parametric modelling software Lenstool (Kneib et al. 1996; Jullo et al. 2007). This is one of the seven blind lens models submitted to the comparison challenge (see Suyu et al., in prep.). In this paper, we describe our modelling method and forecasts, and we assess the systematic uncertainties. This paper is organised as follows. In Sect. 2 we describe the HST and JWST imaging, the VLT/MUSE spectroscopic observations, and the archival X-ray observations. Section 3 details the method we adopted for the strong-lensing modelling of MACS J0138. Our results are presented and discussed in Sect. 4. Finally, our conclusions are summarised in Sect. 5.
Throughout the paper, we adopt the standard flat ΛCDM cosmological model with H0 = 70 km s−1 Mpc−1, Ωm = 0.3, and ΩΛ = 0.7. In this cosmology, 1 corresponds to a physical scale of 4.81 kpc at the lens cluster redshift (zL = 0.336). The magnitudes are quoted in the AB system (Oke 1974). The statistical uncertainties are given as the 68% confidence interval.
2. Multi-wavelength observations of MACS J0138.0–2155
This section briefly reviews the HST and JWST multi-band imaging, the VLT/MUSE spectroscopy, and the X-ray data sets we used. We refer to Pierel et al. (2024b) and Granata et al. (2025, G25 hereafter) for a detailed overview.
MACS J0138 has been repeatedly surveyed by the HST and the JWST. Specifically, the lens cluster has been imaged within three HST programmes (P.I.: Newman, P.I.: Akhshik, and P.I.: Pierel) that collected observations with eight HST bands (F390W, F555W, F814W, F105W, F125W, F140W, and F160W). Following the discovery of SN Encore, the galaxy cluster was imaged with six JWST bands (F115W, F150W, F200W, F277W, F356W, and F444W) within two JWST programmes (P.I.: Newman, and P.I.: Pierel). All the HST and JWST imaging data were astrometrically aligned relative to each other and to the Gaia-DR3 absolute astrometric frame, and they were combined into mosaics with a pixel size of  , following the approaches first described by Koekemoer et al. (2011) and updated as needed (see Pierel et al. 2024b, for more details). A summary of the HST and JWST observations is given in Tables 1 and 2 in Ertl et al. (2025). The photometry of all the galaxies (with MAG_AUTO < 23 in the F160W band, as measured from Source-Extractor,
Bertin & Arnouts 1996) in the field of view is presented by Ertl et al. (2025). The surface-brightness distribution of the cluster members was modelled with the software Morphofit (Tortorelli & Mercurio 2023), which has proven to work well in highly crowded fields (Tortorelli et al. 2018, 2023). Within an automated and parallelised framework, Morphofit uses both Source-Extractor and Galfit (Peng et al. 2011) to estimate the galaxies structural parameters by fitting multiple surface-brightness components. Ertl et al. (2025) used several Sérsic profiles (when needed) to accurately estimate the multi-band photometry of 81 cluster member galaxies (i.e. for all but the three jellyfish galaxies).
, following the approaches first described by Koekemoer et al. (2011) and updated as needed (see Pierel et al. 2024b, for more details). A summary of the HST and JWST observations is given in Tables 1 and 2 in Ertl et al. (2025). The photometry of all the galaxies (with MAG_AUTO < 23 in the F160W band, as measured from Source-Extractor,
Bertin & Arnouts 1996) in the field of view is presented by Ertl et al. (2025). The surface-brightness distribution of the cluster members was modelled with the software Morphofit (Tortorelli & Mercurio 2023), which has proven to work well in highly crowded fields (Tortorelli et al. 2018, 2023). Within an automated and parallelised framework, Morphofit uses both Source-Extractor and Galfit (Peng et al. 2011) to estimate the galaxies structural parameters by fitting multiple surface-brightness components. Ertl et al. (2025) used several Sérsic profiles (when needed) to accurately estimate the multi-band photometry of 81 cluster member galaxies (i.e. for all but the three jellyfish galaxies).
For the spectroscopy, MACS J0138 was targeted by two VLT/MUSE programmes (IDs 0103.A-0777, P.I.: Edge and 110.23PS.016, P.I.: Suyu), which amounted to a cumulative exposure time of about 3.7 hours. The observations, data reduction, redshift, and stellar kinematic measurements are described in G25. We used the spectroscopically confirmed multiple images and cluster member galaxies to build our new strong-lensing model (see Sect. 3 for further details).
MACS J0138 was also observed by the Chandra telescope on 2015 June 11–12 with the Advanced CCD Imaging Spectrometer (ACIS-I; Observation ID 17186; P.I.: Boehringer) for a total exposure time of 24.7 ks after the data reduction. The data reduction was performed with the same procedure as was described by Tozzi et al. (2022), starting from the level 1 event files with CIAO 4.15 and the latest release of the Chandra Calibration Database (CALDB 4.10.4). The VFAINT observation mode allowed us to reject a significant fraction of the ACIS particle background. A small number of source photons (46 ± 7) were filtered out due to pile-up, given the brightness of the cool core. We verified a posteriori that this effect did not impact the spectral analysis of the nucleus, and therefore we kept the standard data reduction in the VFAINT mode to obtain a lower background and achieve a better characterisation of the diffuse intracluster medium (ICM) emission. The images were created in the 0.5–2 keV, 2–7 keV, and total (0.5–7 keV) bands without binning to preserve the full angular resolution of ∼1 arcsec (full width at half maximum) at the aimpoint (1 pixel corresponds to 0.492 arcsec). Based on the bright ICM emission of the galaxy cluster, we were able to detect about 7350 net counts within the 0.5-7 keV band. The image quality and the high signal from the ICM allowed us to perform a spatially resolved spectral analysis and, ultimately, to derive the hydrostatic mass profile (see Sect. 4.2).
3. Strong-lensing modelling
We modelled the total mass distribution of MACS J0138 with the publicly available and parametric pipeline Lenstool1 (Kneib et al. 1996; Jullo et al. 2007), which exploits a Bayesian Markov chain Monte Carlo (MCMC) sampler. The lens model we present was developed within the modelling challenge presented by Suyu et al. (in prep.). The seven independent participating teams agreed upon the selection of the observables and cluster members. We thus refer to Ertl et al. (2025), G25, and Suyu et al. (in prep.) for a detailed overview of the multiple images and cluster member selections and only provide a summary below.
We considered the gold sample of multiple images described by Ertl et al. (2025) and Suyu et al. (in prep.) as lensing observables. Briefly, these are 23 spectroscopically confirmed multiple images from eight background sources spanning a redshift range 0.767 < zs < 3.420 (see Table 5 in Ertl et al. 2025). For clarity, we adopted the same labelling as used by Ertl et al. (2025) and Suyu et al. (in prep.). The gold sample of multiple images considered in our lensing analysis is shown in Fig. 1. In particular, the two most noteworthy strongly lensed systems are systems 1 and 2, which correspond to the multiple images of SN Encore and SN Requiem, respectively, at zs1, s2 = 1.949.
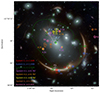 |
Fig. 1. JWST colour-composite image of MACS J0138–2155, created with the passbands F115W+F150W (blue), F200W+F277W (green), and F356W+F444W (red). The 23 spectroscopically confirmed multiple images included in our strong-lensing analysis are marked with circles, colour-coded per system, as specified in the legend. The crosses, following the same colour-coding scheme, mark the best-fit model-predicted positions of the multiple images from our reference strong-lensing model. The two line-of-sight galaxies and the three jellyfish member galaxies included in our model are labelled in grey and light blue, respectively, following Sect. 3. The best-fit critical curves from our reference strong-lensing model at the redshift of the SNe host galaxy (z = 1.949), are shown in green. The cyan cross indicates the reference position, associated with the BCG. |
The cluster member catalogue includes 84 galaxies with F160W < 24, of which ∼60% are spectroscopically confirmed through the VLT/MUSE observations. The 50 spectroscopic cluster members were selected as the galaxies with rest-frame line-of-sight velocities within ΔV = 2500 km s−1 from the galaxy cluster mean line-of-sight velocity (G25). The photometric cluster galaxies were firstly selected as those lying within 2σ of the red cluster sequence (defined in the F555W–F814W versus F814W colour-magnitude diagram). This sample was then complemented with a F277W–F444W versus F814W–F150W colour-colour selection, resulting in the inclusion of 10 additional member galaxies (Ertl et al. 2025). We remark that three cluster members are jellyfish galaxies, which are labelled JF-1, JF-2, and JF-3 in the following (see also Fig. 1).
We further exploited the stellar velocity dispersion measurements for a sub-set of cluster galaxies obtained by G25 to calibrate the galaxy cluster sub-halo mass component. In detail, G25 present a robust stellar kinematic measurement of 14 bright cluster member galaxies, with high averaged spectral signal-to-noise ratios (⟨S/N⟩≥10), down to F160W ∼ 21 (see Fig. 2). Following Bergamini et al. (2019, see their Appendix B), we adopted a Bayesian approach by making use of the Python implementation of the affine-invariant MCMC ensemble sampler (Goodman & Weare 2010; Foreman-Mackey et al. 2013). This allowed us to sample the posterior distribution and estimate the best-fit values of the reference central stellar velocity dispersion, σ0ref, its scatter, Δσ0ref, and the logarithmic slope, α, of the σ0−F160W relation (see Sect. 3.1). As shown in Fig. 2, the brightest cluster galaxy (BCG) seems to be an outlier in this relation, possibly due to its different assembly history compared to that of other galaxies. We thus performed two fits of the σ0−F160W relation, with and without the BCG. We present the results of the fits in Table 1, that is, the best-fit, together with the median and the 16th and 84th percentile values of σ0ref, Δσ0ref, and α, as obtained from their posterior probability distributions. These values were then considered as prior information for the scaling relations of the cluster members in Sect. 3.2.
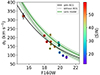 |
Fig. 2. Calibration of the Faber-Jackson relation. The filled circles show the measured stellar velocity dispersions, σ0, of a subset of 14 bright cluster member galaxies as a function of their total magnitudes in the HST F160W band (colour-coded depending on their averaged spectral ⟨S/N⟩ values) from G25. The black square highlights the σ0 measurement of the BCG. The solid and dotted black lines correspond to the best-fit σ0−F160W relations, obtained as described in Sect. 3. The green line and shaded area show the median and the 68% confidence level of the σ0−F160W relation from our reference strong-lensing model. |
We note that the values of the fitted relation without the BCG are perfectly consistent with those derived by G25, as both analyses implemented the same method. Our estimates also agree with those presented by Flowers et al. (2024), who exploited shallower VLT/MUSE data (associated with the programme 0103.A-0777) and applied different quality cuts from those by G25.
3.1. Modelling method
In a parametric lens model of MACS J0138, its total mass distribution can be separated into several mass components. We modelled all haloes with dual pseudo-isothermal elliptical (dPIE) mass density profiles (Elíasdóttir et al. 2007; Suyu & Halkola 2010), characterised by seven free parameters in Lenstool. These are the centre coordinates, x, y; the ellipticity, e = (a2 − b2)/(a2 + b2), where a and b are the values of the major and minor semi-axes, respectively; the orientation, θ (counted counterclockwise from the x-axis); the core and truncation radii, rcore and rcut, respectively; and a velocity dispersion, σLT, which is related to the central velocity dispersion of the dPIE mass density profile through  .
.
We described the cluster-scale halo with a non-truncated, elliptical dPIE mass density profile, while we considered singular circular dPIE profiles for the galaxy-scale haloes, which are associated with the 84 cluster members and the two line-of-sight galaxies. To significantly reduce the number of free parameters, the total masses of the early-type galaxy-scale haloes were scaled with total mass-to-light ratios increasing with their near-IR luminosities (which are good proxy of their stellar mass, Grillo et al. 2015). More specifically, we adopted the following two scaling relations (Jullo et al. 2007):
 (1)
(1)
where Lref represents the reference luminosity value of a galaxy at the cluster redshift, which we associated with the BCG (with a total magnitude value in the HST F160W band of 15.30). The parameters α and β, corresponding to the slopes of the σ0 and rcut scaling relations, respectively, were fixed in the lens model, and thus, the sub-halo mass component is completely described with only two free parameters: σ0ref and  . In our lens models, we used the normalisation and slope values of the best-fit σ0–F160W relations (see Fig. 2 and Table 1), whilst a large flat prior for the
  value was considered. In turn, the adopted value of β was inferred, following β = γ − 2α + 1, where γ represents the slope of the mass-to-light ratio. We adopted γ = 0.2, entailing that the galaxy total mass-to-light ratio varies with the luminosity as MitotLi−1 ∝ Li0.2, which is consistent with the fundamental plane (Faber et al. 1987; Bender et al. 1992).
Finally, we introduced further flexibility into the lens modelling of MACS J0138 by including an external shear component, characterised by two additional free parameters: its magnitude, γext, and orientation, ϕext. Previous studies have supported the use of this component to significantly improve the reproduction of the observed multiple image positions by limiting the effects of unmodelled mass structures present in the lens environment or along the line of sight, or of the complex internal structure of the lens (e.g. Lagattuta et al. 2019; Acebron et al. 2022; Rafee Adnan et al. 2025), as further discussed in Sect. 4.5.
The best-fit values of the model parameters that describe the total mass distribution of MACS J0138, p, were obtained by minimising on the image plane the distance between the observed, θobs, and model-predicted, θpred, positions of the multiple images through the following χ2 function:
 (2)
(2)
where Nfam and  are the total number of families and of multiple images for the family j included in the lens model, respectively, and σij, the positional uncertainty for each multiple image. We assumed initial circular values of σij based on the observed spatial extent of the multiple images. For each multiple image, the circularised uncertainty was obtained as
  , where σa and σb are the semi-major and semi-minor axis of the error ellipse, respectively, as given in Table 5 in Ertl et al. (2025). For each final model optimisation, the multiple image positional uncertainty was rescaled to obtain a minimum χ2 value comparable with the number of degrees of freedom (ν), or χ2/ν ∼ 1. This ensures that the posterior distributions of the model parameters are properly sampled to estimate robust and meaningful uncertainties. The median values and the associated 1σ uncertainties of the model parameters were instead extracted from the MCMC chains, which have a total number of 5 × 10⁵ samples, excluding the burn-in phase.
We also used the root mean square (rms) value of the difference between the observed and model-predicted positions of the multiple images to quantify the goodness of our models,
 (3)
(3)
where Ntot is the total number of multiple images. To robustly compare lens models with different numbers of free parameters, however, we also employed other statistical estimators, such as the logarithm of the maximum value of the likelihood, ℒ; and of the evidence, E; the Bayesian information criterion (BIC; Schwarz 1978); and the Akaike information criterion (AIC; Akaike 1974). These are defined as follows:
 (4)
(4)
and
 (5)
(5)
where Nparam and n are the number of free parameters and observables, respectively.
3.2. Total mass models
Investigating possible systematic uncertainties, arising from lens modelling choices of the total mass reconstruction of MACS J0138, is important given the prospects of using this lens cluster for time-delay cosmography. To do this, we explored several total mass parametrisations of the cluster and assessed the robustness of the model-predicted positions and magnifications of the SN Requiem and SN Encore multiple images. To ensure a blind cosmological analysis (eliminating any experimenter bias, see e.g. Pascale et al. 2025) both in the lens modelling and in the time-delay measurement analyses (Pierel et al., in prep.), the model-predicted time delays between the SNe multiple images and their uncertainties are not presented in this publication, but will instead be discussed by Suyu et al. (in prep.).
All of our lens models of MACS J0138 considered a single main cluster-scale halo, parametrised with a non-truncated dPIE mass density profile (see Sect. 3). All models but one included an external shear component. The sub-halo component and the perturber galaxies, such as the jellyfish members or the line-of-sight galaxies, were parametrised with singular circular dPIE mass density profiles. The three jellyfish member galaxies were modelled outside of the scaling relations. We also included the mass contribution from two line-of-sight perturber galaxies (see G25), the foreground spiral FG (zFG = 0.309) and the background BG (zBG = 0.371). Their positions are highlighted in Fig. 1. The two line-of-sight galaxies were modelled at the lens cluster redshift (zL = 0.336). As shown in Acebron et al. (2022), when the line-of-sight perturbers are close to the redshift of the main deflector (the redshift difference of both FG and BG with respect to MACS J0138 is ≤10%), this approximation limits biases on the model-predicted magnifications and time delays between multiple images that are angularly close to the perturbers (as is the case for FG, with systems 1, 2, and 3, see Fig. 1), compared to models that do not include such perturbers. The values of all the model parameters, but that of the scaling relation normalisation,  , were optimised within large flat priors, as shown in Table 2 (top). Below, we detail the specific characteristics of each lens model we built. The following four lens models were created during the blind comparison challenge described by Suyu et al. (in prep.).
Input and output parameters of the reference lens model for the galaxy cluster MACS J0138.
-
reference: By leveraging the calibrated Faber-Jackson relation including the BCG (see Table 1 and the solid line in Fig. 2), the sub-halo mass component that is associated with the 81 cluster member galaxies, including the BCG, was modelled within the scaling relations, as introduced in Sect. 3.1. We thus adopted a Gaussian distribution centred on the measured value of
 , with a standard deviation value equal to
  , as a prior for the normalisation of the kinematic scaling relation. This reference strong-lensing model was submitted for the modelling challenge presented by Suyu et al. (in prep.).
 -
circularBCGout: We instead exploited the calibrated Faber-Jackson relation without the BCG (see Table 1 and the dotted line in Fig. 2) to scale the mass-to-light ratio of 80 cluster member galaxies. The BCG was modelled outside of the scaling relations, with a circular dPIE mass density profile, where the values of its central stellar velocity dispersion and truncation radius were optimised within large flat priors.
-
ellipticalBCGout: In this model, the BCG was instead modelled with an elliptical dPIE mass density profile, where the values of the ellipticity and position angle were also freely optimised within large flat priors.
-
reference-noFG: The foreground spiral galaxy FG lies at a projected distance of only
 from the key multiple image systems 1 (SN Encore) and 3 (2, SN Requiem). To explore the impact of this perturber on our results, we considered the reference lens model, but without the mass contribution associated with FG.
The last two models were instead developed after the unblinding with the other lens modelling teams. We remark, however, that, importantly, the time delays between the SNe multiple images are still unknown at the time of writing.
-
reference-subs: Interestingly, wide-field imaging from the DESI Legacy Imaging Surveys of MACS J0138 reveals a massive structure 140
 or 673 kpc south-east of the BCG. This massive substructure is located at the edge of the JWST imaging of the MACS J0138 in the F150W and F444W bands (see Sect. 4.5). The galaxies colours and photometric redshifts are consistent with those of the spectroscopically confirmed cluster members in the main cluster core. We included this massive structure as a singular isothermal sphere (SIS) mass density profile. Its position was fixed to that of the brightest galaxy at (RA, Dec) = (24.525567°, −21.964201°), and its velocity dispersion value was optimised within a flat large prior, that is, we added one more free parameter.
 -
subs-noES: The last lens model was the same as the previous model, without an external shear component. Its scope was to test whether the external shear might be ascribed to the non-modelled lens cluster environment alone.
The number of free model parameters (Nparam) and degrees of freedom (ν) characterising each of the lens models explored are given in Table A.1.
4. Results and discussion
Section 4.1 presents the results of the six lens models we developed and the rigorous selection of the best-fitting lens model of MACS J0138. Subsequently, we focus on the best-fitting reference lens model that we used to study the total mass distribution of the deflector in Sect. 4.2 and the reconstructed surface-brightness distribution of the SNe host galaxy in Sect. 4.3. We assess in Sect. 4.4 the robustness of our new lens model in predicting the positions and magnifications of the observed and future multiple images of SN Encore and SN Requiem and we discuss possible implications for future cosmological applications, while Sect. 4.5 is dedicated to the analysis of the effect of the lens environment.
4.1. Best-fitting lens model
The goodness of the lens models presented in Sect. 3.2 in reproducing the observed positions of the multiple images is summarised in Table A.1, where the values of the statistical estimators introduced in Sect. 3.1 are given. We recall that lower values of χ2, rms, BIC, and AIC, and higher values of ℒ and log E identify the cluster total mass reconstructions that are preferred based on the observables considered in the models. The model that reproduces the observed positions of the multiple images best is ellipticalBCGout, with a value of the rms of  . When the values of all the figures of merit are considered as well, the three models, including FG, yield similar BIC values, and the reference model is weakly preferred over ellipticalBCGout (Raftery 1995). Thus, adopting calibrated Faber-Jackson relations with or without the BCG provide consistent results, and the better reproduction of the observed positions of the radial multiples images of systems 5 and 6 is driven by the introduction of an elliptical dPIE mass density profile for the BCG in the ellipticalBCGout model. These systems contribute ∼42% and ∼11% to the total χ2 term in the reference model, respectively. We also remark that it is crucial to include the mass contribution of the foreground spiral perturber FG for an accurate strong-lens model of MACS J0138. This decreases the minimum χ2 value by a factor ∼3.8. This comprehensive analysis shows that the reference lens model is statistically preferred while avoiding over-fitting. The lens models we developed after the unblinding between lens modellers in the comparison challenge (Suyu et al., in prep.) show that the inclusion of the massive clump significantly improves the χ2, by a factor of ∼2.5 with respect to the reference model. We focus in the following on the results from the reference lens model, which we submitted to the comparison study by Suyu et al. (in prep.). We further discuss the impact of directly modelling the lens environment in Sect. 4.5.
The reference best-fit lens model reproduces the observed positions of the multiple images with a root-mean-square offset of  . Figure 1 shows the comparison between the observed (circles) and model-predicted (crosses) positions of the 23 multiple images included in the analysis and the critical lines at the redshift of the strongly lensed SNe (zs1, s2 = 1.949). The observed positions of the two SN multiple image systems and their host galaxy are accurately reproduced, with a remarkable mean precision of only
  , which we further discuss in Sect. 4.4, together with our forecast of the reappearance of future multiple images. We note that some ghost multiple images of systems 1, 2, and 3 are predicted in the centre of the mass density profile associated with the jellyfish galaxy JF-2, which is angularly close to the BCG. Because of the uncertain total mass density profiles of jellyfish galaxies and model degeneracies between the different mass components (which might explain the high value of the velocity dispersion of JF-2, as given in Table 2), we do not consider these multiple images in the following. The other multiple image systems are well reproduced by our best-fit reference lens model, which predicts some additional multiple images. In particular, the multiple image 4.2b is predicted to lie close in projection to the jellyfish cluster member JF-2 (orange cross in Fig. 1). The light contamination by this star-forming galaxy both in the JWST and VLT/MUSE data make it extremely challenging to observe this source. Counter images of the systems 4.3 are also predicted close to the locations of the observed multiple image systems 4.1 and 4.2. Finally, our best-fit model predicts a counter-image of the radial image 6b. While there is some tentative signal in the VLT/MUSE cube, the diffuse emission, together with the averaged seeing of
  , prevented us from securely identifying it.
The previous lens model of MACS J0138 by Rodney et al. (2021), also developed with Lenstool, achieved a smaller root-mean-square offset of rms =  than the offset from all of the models explored in this work (see Table A.1). This can be explained by the fact that because they exploited shallower VLT/MUSE observations, Rodney et al. (2021) did not include systems 5 and 6, which dominate the contribution to the total χ2 term. The improvement of our new lens model over those presented by Newman et al. (2018a) and Rodney et al. (2021) is further discussed in the following sections. It further supports the statement that considering the value of the rms alone may not fully quantify the goodness of a given lens model (see also e.g. Acebron et al. 2017; Bergamini et al. 2023b).
4.2. Total mass distribution
The resulting median values of the parameters of the reference model and the associated 1σ statistical errors are summarised in Table 2 (bottom). We note that given our single-plane lens model approximation, the model-predicted velocity dispersion of the background galaxy BG,  (see Table 2), agrees to within 1σ, with the measured stellar kinematics presented by G25 of
  .
.
In the left panel of Fig. 3, we compare the cumulative projected total mass profile of MACS J0138 for the six lens models we explored. Regardless of the adopted modelling choices, the cumulative projected total mass profile is robustly determined. The typical statistical uncertainty is ∼2.5(6.0)% at ∼10(200) kpc and from the BCG. The systematic uncertainties dominate the total error budget, as expected, with a median value of ∼7.0(18.0)%. The agreement is particularly remarkable between ∼20 kpc and ∼70 kpc from the BCG, where the median projected distance of the 23 multiple images from the BCG is 62 kpc. At these projected distances from the BCG, the statistical plus systematic error is small, ≲3%. Based on our best-fitting reference lens model and not taking into account the two line-of-sight galaxies, we measured a precise projected total cluster mass of  .
.
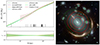 |
Fig. 3. Total mass distribution of MACS J0138. Left: Cumulative projected total mass profile of the lens cluster as a function of the distance from the BCG (highlighted with a cyan cross in Fig. 1). The coloured lines show the median values of the total mass profile, and the shaded regions encompass the 16th and the 84th percentiles, estimated from 1000 random MCMC realisations. The vertical black lines denote the projected distances of the 23 multiple images from the BCG. The bottom panel illustrates the ratio of the projected total mass profiles for the different models and the best-fitting reference one. The cumulative projected hydrostatic mass profile measured from the analysis of the Chandra data, with the associated 1σ uncertainties, is shown in dark red. Right: Colour-composite JWST image of MACS J0138, where we overlay the contour levels ( |
![Mathematical equation: $ [1.5, 2.2, 3.0, 4.5] \times 10^9\,M_{\odot}\,\mathrm{kpc}^{-2} $](/articles/aa/full_html/2025/07/aa54468-25/aa54468-25-eq60.gif)

Owing to the bright emission of the ICM in MACS J0138, we can compare its total mass distribution measured from our strong-lensing analysis with that inferred from the X-ray emission. To do this, we performed a spatially resolved spectral analysis of the X-ray data, optimally selecting five circular bins with a maximum radius of 172 arcsec (or ∼830 kpc at z = 0.336) centred on the BCG position. We find a clear indication of a cool core, despite the large uncertainties on the temperature due to the limited signal and the high temperatures involved. We measured kT = (4.00 ± 0.25) keV within 25 kpc and temperatures between 6 and 7 keV beyond 25 kpc. This agrees with the average global temperature found by Flowers et al. (2024). The presence of a cool core is consistent with the smooth and spherically symmetric surface brightness of the ICM.
After computing the deprojected temperature and electron density profiles, we derived the cumulative total mass radial profile of MACS J0138 by applying the hydrostatic equilibrium equation. We found a total virial mass of  within
  kpc. Finally, we derived the projected total mass profile as a function of the projected radius. The latter (in dark red) is compared with those obtained from the strong-lensing analysis in the left panel of Fig. 3. The agreement within the 1σ uncertainties between the Chandra hydrostatic equilibrium and the strong-lensing cumulative projected mass profiles is very good. This further demonstrates the robustness of our strong-lensing analysis of this unique lens cluster. We estimated a projected hydrostatic mass of
  , which agrees well with the strong-lensing measurement reported above.
The total surface mass density distribution of MACS J0138 is shown instead (with green contours) in the right panel of Fig. 3, where it is compared with the X-ray surface brightness distribution obtained from the Chandra observations. As illustrated, the distribution of the total mass and the mass associated with the ICM as traced from our strong-lensing analysis and the Chandra observations shows that the galaxy cluster is relaxed, with a symmetric mass distribution. The diffuse dark matter component is very well aligned with the position of the BCG, with an average projected distance of < 10 kpc in our reference lens model.
4.3. Reconstruction of the surface-brightness distribution of MRG-M0138
We reconstructed the surface-brightness distribution of the host galaxy MRG-M0138, in which SN Encore and SN Requiem exploded, with the forward modelling code GravityFM presented by Bergamini et al. (2023b). GravityFM operates in a Bayesian framework to optimise the model parameter values of a given parametric light profile, representing the strongly lensed sources, by minimising the difference between the measured and model-predicted light intensity of each pixel. We explored several source models of MRG-M0138: a single or double Sérsic profile (Sérsic 1963) with a fixed Sérsic index n = 4, and a double Sérsic profile with fixed Sérsic indexes of n = 1 and n = 4. The free model parameters associated with the Sérsic light profile are the centroid coordinates (x and y), the total flux (F), the effective radius (Re), the axis ratio (q), and the position angle (θ).
We selected the pixels associated with the multiple images 3a and 3b for the optimisation. They are encompassed within the green region in Fig. 4 (top panel) to reproduce the more complex morphology of the multiple image 1a (see Fig. 1). These observables (a total of 12113 JWST pixels with a pixel size of  ) were then exploited to predict the best-fit parameter values of the background source. Based on our best-fitting lens model reference, we predicted a posteriori the surface-brightness distribution of the other counter-images of the host galaxy, that is, without directly optimising it in the lens modelling. To reconstruct the MRG-M0138 colour surface brightness, we performed the forward modelling in three different JWST filters (F115W, F200W, and F444W), with their associated error maps.
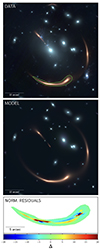 |
Fig. 4. Surface-brightness distribution of MRG-M0138. Top and middle panels: Observed (top panel) and model-predicted (middle panel) surface-brightness distribution of SNe Requiem and Encore host galaxy, MRG-M0138, from our best-fitting reference lens model. The colour images were created through a combination of three JWST filters (F115W, F200W, and F444W) with a pixel size of |

We found that a single Sérsic profile or a combination of two (with n = 4, or with n = 4 and n = 1) yields a similar fit to the data, and we therefore chose the single Sérsic as the best-fitting source model in the following because it has fewer (six) free parameters. The goal of this extended reconstruction was to demonstrate the robustness of the lens model and not to estimate the intrinsic properties of the source. We defer these analyses to future extended lens models of MACS J0138, following similar methods as those implemented by Acebron et al. (2024). In Fig. 4 we show the comparison between the observed (top panel) and the model-predicted (middle panel) surface-brightness distribution of the multiple images of MRG-M0138 from our best-fit reference model together with the normalised residuals in the F115W band in a range between −20σ and 20σ (bottom panel). The surface-brightness models of the other galaxies in the field, shown in the middle panel, were taken from Ertl et al. (2025), as described in Sect. 2. We did not include the light contribution from the BCG to allow for a better visualisation of model-predicted surface-brightness of the radial arc of MRG-M0138, however. The surface-brightness of the multiple images of MRG-M0138 is well reproduced. This further demonstrates the robustness of our new lens model. The normalised residuals are significant around the multiple image 3a, and our simple source models are not flexible enough to capture the asymmetries and the tilt in the light of MRG-M0138. This limitation might be resolved with surface-brightness models performed on a pixel grid (e.g. Suyu et al. 2006). We also note that based on the normalised residuals around the foreground galaxy FG, our reference lens model seems to overestimate its total mass, with a best-fit Einstein radius  . The imperfect reconstruction of the radial multiple images (3d and 3e) can be explained by the uncertain total mass density profiles of the jellyfish galaxies, in particular, those of JF-1 and JF-2. As shown by Acebron et al. (2024), a direct modelling of the surface-brightness distribution of MRG-M0138 will significantly improve the overall reconstruction and help us to further refine the total mass estimate of angularly close haloes along the line of sight, such as the foreground galaxy FG, or at the lens redshift, such as JF-1, JF-2, and JF-3.
4.4. Robustness of the model-predicted positions and magnifications of the two strongly lensed supernovae
We show in Figures 5 and 6 the probability distribution functions, estimated from 1000 different model realisations randomly extracted from the MCMC chains, of the model-predicted values of the position (x and y), and the magnification, μ of the observed (1a, 1b and 2a, 2b, and 2c), and the future (1d, 1e, and 2d) multiple images of SN Encore and SN Requiem, respectively. The magnification values were computed at the model-predicted positions of the multiple images. We highlight the median values obtained and the 68% confidence level intervals with vertical lines, whilst the gold shaded regions denote the observed positions of the multiple images, considering their circularised positional uncertainties (see Sect. 3). The filled histograms correspond to the model-predicted quantities yielded by the reference lens model, and the purple, brown, cyan, gold, and lime triangles represent the model-predicted median values from the circularBCGout, ellipticalBCGout, and reference-noFG, reference-subs, and subs-noES model predictions, respectively.
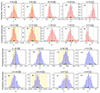 |
Fig. 5. Probability distribution functions for the positions of the observed and model-predicted multiples images of SN Encore (system 1, top) and SN Requiem (system 2, bottom), in arcsec with respect to our reference position (associated with the BCG). The filled histograms correspond to the marginalised probability distributions obtained from the best-fitting reference lens model, from 1000 different models randomly extracted from the MCMC chain. The solid and dashed black lines correspond to the 50th and the 16th and 84th percentiles of the marginalised distributions, and the corresponding values are reported at the top of each panel. The gold vertical lines in some of the panels denote the observed positions of the multiple images, and the shaded region shows the circularised positional uncertainties. The predicted median values from the lens models circularBCGout, ellipticalBCGout, reference-noFG, reference-subs, and subs-noES are shown with purple, green, cyan, gold, and lime triangles, respectively. |
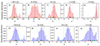 |
Fig. 6. Probability distribution functions for the magnification values of the observed and model-predicted multiple images of SN Encore (system 1, top) and SN Requiem (system 2, bottom). The shown quantities and labels follow the same notations as in Fig. 5. |
As anticipated, our lens modelling predicts the reappearance of both SN Encore and SN Requiem in the future, with two and one additional multiple image(s), respectively. The multiple images 1d and 2d are expected in the radial arc of MRG-M0138 at RA, Dec = ( ) and (
 ) from the BCG, respectively (see also the coloured crosses in Fig. 1). Our model predicts (in 15% of the chains) a fifth and central multiple image of SN Encore, 1e, at RA, Dec = (
 ). We note that the other three total mass model parametrisations do not predict the appearance of 1e. With a magnification factor of
  , the observation of this demagnified multiple image, which is angularly close to the bright BCG, would be challenging.
Accurate magnification maps are fundamental for characterising the intrinsic properties of background-lensed sources and to photometrically classify the strongly lensed SN Requiem (Rodney et al. 2021). We assessed the impact of systematic uncertainties that are associated with the different total mass parametrisations from Table A.1 by comparing the median values of the model-predicted magnifications, as shown in Fig. 6. We note that all the models in which the foreground galaxy FG is included provide consistent values, generally, well within the 1σ interval from the reference model. This entails that given the current observables, the systematic uncertainties arising from different mass modelling choices are comparable to the statistical errors. On the other hand, this analysis also demonstrates that the mass contribution from FG should be considered for accurate and precise magnification estimates, and thus, of the intrinsic properties of MRG-M0138 and SNe Requiem and Encore. Our model-predicted magnification values of the multiple images of SN Requiem strongly disagree with those presented by Newman et al. (2018a) and particularly with those from Rodney et al. (2021), however. In detail, the magnification values we estimated are systematically higher than those by Newman et al. (2018a) and Rodney et al. (2021), by factors ranging from ∼1.8 to ∼3.0 and from ∼3.8 to ∼5.5, respectively. The discrepancy might partly be ascribed to the addition of new observables that were revealed in the new JWST and VLT/MUSE observations (systems 1, 5, and 6, see Ertl et al. 2025), and to the improved selection of cluster members (G25, Ertl et al. 2025). The conflicting model-predicted magnification values are, however, mainly due to the different lens modelling choices, even when the same modelling code is used. We verified that the model-predicted magnification values by our reference model are robust by removing the multiply lensed systems 1, 5, and 6 from our catalogue of observables, that is, we included the same observables as Rodney et al. (2021). In particular, we found that the magnification values of the SN Requiem multiple images are perfectly consistent with those given in Fig. 6. This further demonstrates that lens modelling choices are important and significantly impact the magnification estimates, especially in the high-magnification regime (Treu et al. 2016; Meneghetti et al. 2017; Suyu et al., in prep.). For example, the value of the normalisation of the Faber-Jackson and the truncation radius scaling relations (see Eq. (1)) was fixed to given arbitrary values by Rodney et al. (2021), while in this analysis, the sub-halo mass component was calibrated based on the stellar kinematic measurements of a subset of cluster members (G25). This allowed us to reduce key model degeneracies between the BCG and the large-scale dark matter mass components (see Table 2 and Fig. 2), thus building a more accurate total mass model.
4.5. Impact of the lens cluster environment
In this section, we study the impact of directly modelling the massive substructure ∼140″ south-east of the BCG (see Fig. 7) on the reconstruction of the total mass distribution of the lens, and thus, on the model-predicted positions and magnifications of SN Requiem and SN Encore. Based on the current JWST and Chandra data, no clear strong-lensing features are identified and no X-ray emission is detected.
In Fig. 7 we show the JWST/F444W imaging on which the projected total mass density distribution of the galaxy cluster MACS J0138, as derived from the best-fit reference-subs model, is overlaid. The figure highlights that the total mass contribution from the distant substructure is comparable to that of the main cluster core, characterised by a high velocity dispersion value,  , but with a large statistical uncertainty. The SIS mass density profile represents a simplified parametrisation of the total mass contribution of this distant substructure, as the value of the total mass density diverges in the innermost region of this mass density profile. The comparison of the isodensity contours between the reference and reference-subs models reveals that this external substructure perturbs the elliptical total mass distribution in our reference model, which more closely resembles that found by Ertl et al. (2025, see their Fig. 9).
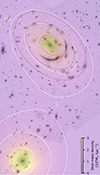 |
Fig. 7. Projected total mass density distribution of the galaxy cluster MACS J0138 obtained from the best-fit reference-subs model, in units of |
The subs-noES model yields a poorer fit to the observables than reference-subs (see Table A.1). This demonstrates that the external shear component in reference-subs (with  ) improves the reproduction of the observed positions of the 23 multiple images in the core of MACS J0138. We find that its magnitude in the reference lens model (
 ; see Table 2) can then only partly be ascribed to the lens environment. Based on the expression of the shear introduced by an SIS mass model at an angular separation θ, that is, γSIS(θ) = θE/2θ, we obtain a value of ∼0.08 for our reference-subs model. Furthermore, the orientation of the external shear component in reference-subs varies from that in reference, with
  , indicating a reconfiguration of the external shear field when explicitly modelling the environment. The residual external shear term required by reference-subs likely reflects complexities in the total mass distribution of the lens that cannot be fully captured with a single elliptical mass component in our parametric modelling or our simple approximation of the galaxy cluster environment (with an SIS mass density profile for both the dark matter and galaxies).
Figures 5 and 6 illustrate the effect of directly modelling the lens cluster environment on the model-predicted positions and magnifications of SN Requiem and SN Encore. The median values are consistent within 1σ with the reference model, especially for the reference-subs mass parametrisation.
While the impact of the lens environment can vary significantly from one field to the next, our analysis demonstrates that in this lensing system, its effect is significant for a robust and precise lens modelling (see also Acebron et al. 2017; McCully et al. 2017; Mahler et al. 2018; Bergamini et al. 2023a; Furtak et al. 2023). Our work proves that future lens models and time-delay cosmography analyses of MACS J0138, possibly supported with a wide-field spectroscopic follow-up campaign, will highly benefit from directly modelling the mass component associated with the environment of this unique lens system.
5. Conclusions
We have presented a new and detailed total mass reconstruction of the lens cluster MACS J0138.0–2155, which is a first and crucial step towards future cosmological applications. To do this, we exploited the most recent HST, JWST, and VLT/MUSE observations, prompted by the discovery of SN Encore. The new observations obtained with the JWST and the VLT/MUSE facilities (see Pierel et al. 2024b; Granata et al. 2025) have enabled us to construct extended and secure samples of multiple images and cluster members (Ertl et al. 2025). These crucial ingredients in turn yield new and improved total mass models. In addition, MACS J0138.0–2155, for which additional multiple images of SN-Requiem and SN Encore are expected in the future, provides us with a valuable opportunity to blindly test our lens modelling choices and results (Suyu et al., in prep.).
As one of the seven teams that developed an independent strong-lensing analysis of this unique lens system, we used the parametric software Lenstool (Jullo et al. 2007) to model its total mass distribution. We built six lens models by implementing different cluster total mass parametrisations to assess the statistical and systematic uncertainties on the predicted values of the position and magnification of the observed and future multiple images of SN Requiem and SN Encore. Our best-fitting reference model includes a single-cored elliptical pseudo-isothermal mass density profile, a sub-halo mass component with 81 cluster members anchored by the VLT/MUSE stellar kinematic information (see also Granata et al. 2025), three jellyfish cluster member galaxies, and one foreground and one background galaxy whose total mass parameters were free to vary. The observed positions of the multiple images were reproduced with a root-mean-square offset of  . We measured a precise projected total cluster mass of Mtot, SL(< 60 kpc) = 2.89 × 10¹³ M⊙, with a statistical plus systematic uncertainty of ≲3% in the region in which multiple images were identified. In addition, our measurements are consistent with those derived independently from the X-ray analysis of archival data from the Chandra observatory. We provided the model-predicted values of the position and magnification of the observed and future multiple images of SN Requiem and SN Encore. The systematic uncertainties arising from different mass modelling choices are comparable to the statistical errors when the mass contribution from the foreground spiral galaxy FG is considered. Moreover, the inclusion of the massive structure 140″ south-east of the BCG has a significant impact on the positions of the observed multiple images in the core of the galaxy cluster.
Our position-based strong-lens modelling of MACS J0138.0–2155 can further be enhanced in several ways. For instance, by refining the modelling of the lens system environment, by implementing a multi-plane lens analysis (e.g. Chirivì et al. 2018), by directly modelling the surface-brightness distribution of the supernovae host galaxy MRG-M0138 (e.g. Acebron et al. 2024), by including the hot-gas mass component (e.g. Bonamigo et al. 2017, 2018), and by considering the measured time delays (and their uncertainties) between the multiple images of SN Requiem (Rodney et al. 2021) and SN Encore (Pierel et al., in prep.) as observables. As previously highlighted in other studies (e.g. Grillo et al. 2018; Acebron et al. 2022), this method will be fundamental for a precise and accurate measurement of the Hubble constant value with MACS J0138.0–2155.
Acknowledgments
We kindly thank the referee for the useful comments received. This research is based partly on observations made with the NASA/ESA Hubble Space Telescope obtained from the Space Telescope Science Institute (associated with the programmes 14496, 15663, and 16264), which is operated by the Association of Universities for Research in Astronomy, Inc., under NASA contract NAS 5-26555, and on observations made with the NASA/ESA/CSA James Webb Space Telescope (associated with the programmes 2345 and 6549). The data were obtained from the Mikulski Archive for Space Telescopes at the Space Telescope Science Institute, which is operated by the Association of Universities for Research in Astronomy, Inc., under NASA contract NAS 5-03127 for JWST. The specific observations used in this work can be accessed via DOI:https://doi.org/10.17909/snj9-an10. AA warmly thanks the P.I.s of the HST, JWST, and VLT/MUSE observations obtained upon the discovery of SN Encore, Andrew Newman, Justin Pierel, and Sherry H. Suyu for making these data available and Marceau Limousin for the useful discussions. AA acknowledges financial support through the Beatriz Galindo programme and the project PID2022-138896NB-C51 (MCIU/AEI/MINECO/FEDER, UE), Ministerio de Ciencia, Investigación y Universidades. PB, PR, MM, GG, and CG acknowledge financial support through grants PRIN-MIUR 2017WSCC32 and 2020SKSTHZ. SE thanks the Max Planck Society for support through the Max Planck Fellowship for SHS. SS has received funding from the European Union’s Horizon 2022 research and innovation programme under the Marie Skłodowska-Curie grant agreement No 101105167 – FASTIDIoUS.
References
- Acebron, A., Jullo, E., Limousin, M., et al. 2017, MNRAS, 470, 1809 [Google Scholar]
- Acebron, A., Grillo, C., Bergamini, P., et al. 2022, ApJ, 926, 86 [NASA ADS] [CrossRef] [Google Scholar]
- Acebron, A., Grillo, C., Suyu, S. H., et al. 2024, ApJ, 976, 110 [Google Scholar]
- Akaike, H. 1974, IEEE Trans. Automat. Control, 19, 716 [Google Scholar]
- Akhshik, M., Whitaker, K. E., Brammer, G., et al. 2020, ApJ, 900, 184 [Google Scholar]
- Akhshik, M., Whitaker, K. E., Leja, J., et al. 2023, ApJ, 943, 179 [NASA ADS] [CrossRef] [Google Scholar]
- Bacon, R., Accardo, M., Adjali, L., et al. 2010, in Ground-based and Airborne Instrumentation for Astronomy III, eds. I. S. McLean, S. K. Ramsay, H. Takami, Society of Photo-Optical Instrumentation Engineers (SPIE) Conference Series, 7735, 773508 [Google Scholar]
- Bacon, R., Vernet, J., Borisova, E., et al. 2014, Messenger, 157, 13 [Google Scholar]
- Bender, R., Burstein, D., & Faber, S. M. 1992, ApJ, 399, 462 [NASA ADS] [CrossRef] [Google Scholar]
- Bergamini, P., Rosati, P., Mercurio, A., et al. 2019, A&A, 631, A130 [NASA ADS] [CrossRef] [EDP Sciences] [Google Scholar]
- Bergamini, P., Acebron, A., Grillo, C., et al. 2023a, ApJ, 952, 84 [NASA ADS] [CrossRef] [Google Scholar]
- Bergamini, P., Grillo, C., Rosati, P., et al. 2023b, A&A, 674, A79 [NASA ADS] [CrossRef] [EDP Sciences] [Google Scholar]
- Bertin, E., & Arnouts, S. 1996, A&AS, 117, 393 [NASA ADS] [CrossRef] [EDP Sciences] [Google Scholar]
- Bonamigo, M., Grillo, C., Ettori, S., et al. 2017, ApJ, 842, 132 [NASA ADS] [CrossRef] [Google Scholar]
- Bonamigo, M., Grillo, C., Ettori, S., et al. 2018, ApJ, 864, 98 [Google Scholar]
- Caminha, G. B., Suyu, S. H., Mercurio, A., et al. 2022, A&A, 666, L9 [NASA ADS] [CrossRef] [EDP Sciences] [Google Scholar]
- Chirivì, G., Suyu, S. H., Grillo, C., et al. 2018, A&A, 614, A8 [NASA ADS] [CrossRef] [EDP Sciences] [Google Scholar]
- Dhawan, S., Pierel, J. D. R., Gu, M., et al. 2024, MNRAS, 535, 2939 [Google Scholar]
- Diego, J. M., Adams, N. J., Willner, S. P., et al. 2024, A&A, 690, A114 [NASA ADS] [CrossRef] [EDP Sciences] [Google Scholar]
- Elíasdóttir, Á., Limousin, M., Richard, J., et al. 2007, arXiv e-prints [arXiv:0710.5636] [Google Scholar]
- Ertl, S., Suyu, S. H., Schuldt, S., et al. 2025, A&A submitted [Google Scholar]
- Faber, S. M., Dressler, A., Davies, R. L., et al. 1987, in Nearly Normal Galaxies. From the Planck Time to the Present, ed. S. M. Faber, 175 [CrossRef] [Google Scholar]
- Flowers, A., O’Donnell, J. H., Jeltema, T. E., Wetzell, V., & Roberts, M. G. 2024, Open J. Astrophys., submitted [arXiv:2412.19955] [Google Scholar]
- Foreman-Mackey, D., Hogg, D. W., Lang, D., & Goodman, J. 2013, PASP, 125, 306 [Google Scholar]
- Frye, B. L., Pascale, M., Pierel, J., et al. 2024, ApJ, 961, 171 [NASA ADS] [CrossRef] [Google Scholar]
- Furtak, L. J., Zitrin, A., Weaver, J. R., et al. 2023, MNRAS, 523, 4568 [NASA ADS] [CrossRef] [Google Scholar]
- Goodman, J., & Weare, J. 2010, Commun. Appl. Math. Comp. Sci., 5, 65 [NASA ADS] [CrossRef] [Google Scholar]
- Granata, G., Caminha, G. B., Ertl, S., et al. 2025, A&A, 697, A94 [NASA ADS] [CrossRef] [EDP Sciences] [Google Scholar]
- Grillo, C., Suyu, S. H., Rosati, P., et al. 2015, ApJ, 800, 38 [Google Scholar]
- Grillo, C., Rosati, P., Suyu, S. H., et al. 2018, ApJ, 860, 94 [Google Scholar]
- Grillo, C., Pagano, L., Rosati, P., & Suyu, S. H. 2024, A&A, 684, L23 [NASA ADS] [CrossRef] [EDP Sciences] [Google Scholar]
- Jullo, E., Kneib, J. P., Limousin, M., et al. 2007, New J. Phys., 9, 447 [Google Scholar]
- Kelly, P. L., Rodney, S. A., Treu, T., et al. 2016, ApJ, 819, L8 [NASA ADS] [CrossRef] [Google Scholar]
- Kelly, P. L., Rodney, S., Treu, T., et al. 2023, Science, 380, abh1322 [NASA ADS] [CrossRef] [Google Scholar]
- Kneib, J. P., Ellis, R. S., Smail, I., Couch, W. J., & Sharples, R. M. 1996, ApJ, 471, 643 [Google Scholar]
- Koekemoer, A. M., Faber, S. M., Ferguson, H. C., et al. 2011, ApJS, 197, 36 [NASA ADS] [CrossRef] [Google Scholar]
- Lagattuta, D. J., Richard, J., Bauer, F. E., et al. 2019, MNRAS, 485, 3738 [NASA ADS] [Google Scholar]
- Mahler, G., Richard, J., Clément, B., et al. 2018, MNRAS, 473, 663 [Google Scholar]
- McCully, C., Keeton, C. R., Wong, K. C., & Zabludoff, A. I. 2017, ApJ, 836, 141 [NASA ADS] [CrossRef] [Google Scholar]
- Meneghetti, M., Natarajan, P., Coe, D., et al. 2017, MNRAS, 472, 3177 [Google Scholar]
- Newman, A. B., Belli, S., Ellis, R. S., & Patel, S. G. 2018a, ApJ, 862, 125 [NASA ADS] [CrossRef] [Google Scholar]
- Newman, A. B., Belli, S., Ellis, R. S., & Patel, S. G. 2018b, ApJ, 862, 126 [NASA ADS] [CrossRef] [Google Scholar]
- Newman, A. B., Gu, M., Belli, S., et al. 2025, arXiv e-prints [arXiv:2503.17478] [Google Scholar]
- Oke, J. B. 1974, ApJS, 27, 21 [Google Scholar]
- Pascale, M., Frye, B. L., Pierel, J. D. R., et al. 2025, ApJ, 979, 13 [Google Scholar]
- Peng, C. Y., Ho, L. C., Impey, C. D., et al. 2011, Astrophysics Source Code Library [record ascl:1104.010] [Google Scholar]
- Pierel, J. D. R., Frye, B. L., Pascale, M., et al. 2024a, ApJ, 967, 50 [NASA ADS] [CrossRef] [Google Scholar]
- Pierel, J. D. R., Newman, A. B., Dhawan, S., et al. 2024b, ApJ, 967, L37 [NASA ADS] [CrossRef] [Google Scholar]
- Rafee Adnan, S. M., Jobair Hasan, M., Al-Imtiaz, A., et al. 2025, A&A, in press, https://doi.org/10.1051/0004-6361/202453239 [Google Scholar]
- Raftery, A. E. 1995, Sociol. Methodol., 25, 111 [CrossRef] [Google Scholar]
- Rihtaršič, G., Bradač, M., Desprez, G., et al. 2025, A&A, 696, A15 [NASA ADS] [CrossRef] [EDP Sciences] [Google Scholar]
- Roberts-Borsani, G., Treu, T., Chen, W., et al. 2023, Nature, 618, 480 [NASA ADS] [CrossRef] [Google Scholar]
- Rodney, S. A., Brammer, G. B., Pierel, J. D. R., et al. 2021, Nat. Astron., 5, 1118 [NASA ADS] [CrossRef] [Google Scholar]
- Schwarz, G. 1978, Ann. Stat., 6, 461 [Google Scholar]
- Sérsic, J. L. 1963, Boletin de la Asociacion Argentina de Astronomia La Plata Argentina, 6, 41 [Google Scholar]
- Suyu, S. H., & Halkola, A. 2010, A&A, 524, A94 [NASA ADS] [CrossRef] [EDP Sciences] [Google Scholar]
- Suyu, S. H., Marshall, P. J., Hobson, M. P., & Blandford, R. D. 2006, MNRAS, 371, 983 [Google Scholar]
- Tortorelli, L., & Mercurio, A. 2023, Front. Astron. Space Sci., 10, 51 [NASA ADS] [CrossRef] [Google Scholar]
- Tortorelli, L., Mercurio, A., Paolillo, M., et al. 2018, MNRAS, 477, 648 [NASA ADS] [CrossRef] [Google Scholar]
- Tortorelli, L., Mercurio, A., Granata, G., et al. 2023, A&A, 671, L9 [NASA ADS] [CrossRef] [EDP Sciences] [Google Scholar]
- Tozzi, P., Pentericci, L., Gilli, R., et al. 2022, A&A, 662, A54 [NASA ADS] [CrossRef] [EDP Sciences] [Google Scholar]
- Treu, T., Brammer, G., Diego, J. M., et al. 2016, ApJ, 817, 60 [Google Scholar]
- Williams, H., Kelly, P. L., Chen, W., et al. 2023, Science, 380, 416 [NASA ADS] [CrossRef] [Google Scholar]
Appendix A: Summary of the best-fitting lens models of MACS J0138
In Appendix A, Table A.1 provides the values of several statistical estimators (see Sect. 3) to quantify the goodness of the several cluster total mass models explored in this work. We also present, in Fig. A.1, the posterior probability distributions of the parameter values of the model free parameters for the reference lens model.
Description of the characteristics of the six developed lens models of MACS J0138 with the parametric pipeline Lenstool.
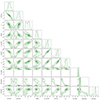 |
Fig. A.1. Posterior probability distributions of the parameter values of the cluster-scale and sub-halo mass components for the reference lens model. The contours correspond to the 1 σ confidence levels, and the vertical dashed lines in the histograms correspond to the 16th, 50th, and 84th percentiles. North is up and East is left. |
All Tables
Input and output parameters of the reference lens model for the galaxy cluster MACS J0138.
Description of the characteristics of the six developed lens models of MACS J0138 with the parametric pipeline Lenstool.
All Figures
|
Fig. 1. JWST colour-composite image of MACS J0138–2155, created with the passbands F115W+F150W (blue), F200W+F277W (green), and F356W+F444W (red). The 23 spectroscopically confirmed multiple images included in our strong-lensing analysis are marked with circles, colour-coded per system, as specified in the legend. The crosses, following the same colour-coding scheme, mark the best-fit model-predicted positions of the multiple images from our reference strong-lensing model. The two line-of-sight galaxies and the three jellyfish member galaxies included in our model are labelled in grey and light blue, respectively, following Sect. 3. The best-fit critical curves from our reference strong-lensing model at the redshift of the SNe host galaxy (z = 1.949), are shown in green. The cyan cross indicates the reference position, associated with the BCG. |
| In the text | |
|
Fig. 2. Calibration of the Faber-Jackson relation. The filled circles show the measured stellar velocity dispersions, σ0, of a subset of 14 bright cluster member galaxies as a function of their total magnitudes in the HST F160W band (colour-coded depending on their averaged spectral ⟨S/N⟩ values) from G25. The black square highlights the σ0 measurement of the BCG. The solid and dotted black lines correspond to the best-fit σ0−F160W relations, obtained as described in Sect. 3. The green line and shaded area show the median and the 68% confidence level of the σ0−F160W relation from our reference strong-lensing model. |
| In the text | |
|
Fig. 3. Total mass distribution of MACS J0138. Left: Cumulative projected total mass profile of the lens cluster as a function of the distance from the BCG (highlighted with a cyan cross in Fig. 1). The coloured lines show the median values of the total mass profile, and the shaded regions encompass the 16th and the 84th percentiles, estimated from 1000 random MCMC realisations. The vertical black lines denote the projected distances of the 23 multiple images from the BCG. The bottom panel illustrates the ratio of the projected total mass profiles for the different models and the best-fitting reference one. The cumulative projected hydrostatic mass profile measured from the analysis of the Chandra data, with the associated 1σ uncertainties, is shown in dark red. Right: Colour-composite JWST image of MACS J0138, where we overlay the contour levels ( |
| In the text | |
|
Fig. 4. Surface-brightness distribution of MRG-M0138. Top and middle panels: Observed (top panel) and model-predicted (middle panel) surface-brightness distribution of SNe Requiem and Encore host galaxy, MRG-M0138, from our best-fitting reference lens model. The colour images were created through a combination of three JWST filters (F115W, F200W, and F444W) with a pixel size of |
| In the text | |
|
Fig. 5. Probability distribution functions for the positions of the observed and model-predicted multiples images of SN Encore (system 1, top) and SN Requiem (system 2, bottom), in arcsec with respect to our reference position (associated with the BCG). The filled histograms correspond to the marginalised probability distributions obtained from the best-fitting reference lens model, from 1000 different models randomly extracted from the MCMC chain. The solid and dashed black lines correspond to the 50th and the 16th and 84th percentiles of the marginalised distributions, and the corresponding values are reported at the top of each panel. The gold vertical lines in some of the panels denote the observed positions of the multiple images, and the shaded region shows the circularised positional uncertainties. The predicted median values from the lens models circularBCGout, ellipticalBCGout, reference-noFG, reference-subs, and subs-noES are shown with purple, green, cyan, gold, and lime triangles, respectively. |
| In the text | |
|
Fig. 6. Probability distribution functions for the magnification values of the observed and model-predicted multiple images of SN Encore (system 1, top) and SN Requiem (system 2, bottom). The shown quantities and labels follow the same notations as in Fig. 5. |
| In the text | |
|
Fig. 7. Projected total mass density distribution of the galaxy cluster MACS J0138 obtained from the best-fit reference-subs model, in units of |
| In the text | |
|
Fig. A.1. Posterior probability distributions of the parameter values of the cluster-scale and sub-halo mass components for the reference lens model. The contours correspond to the 1 σ confidence levels, and the vertical dashed lines in the histograms correspond to the 16th, 50th, and 84th percentiles. North is up and East is left. |
| In the text | |
Current usage metrics show cumulative count of Article Views (full-text article views including HTML views, PDF and ePub downloads, according to the available data) and Abstracts Views on Vision4Press platform.
Data correspond to usage on the plateform after 2015. The current usage metrics is available 48-96 hours after online publication and is updated daily on week days.
Initial download of the metrics may take a while.