| Issue |
A&A
Volume 684, April 2024
|
|
|---|---|---|
| Article Number | L23 | |
| Number of page(s) | 7 | |
| Section | Letters to the Editor | |
| DOI | https://doi.org/10.1051/0004-6361/202449278 | |
| Published online | 24 April 2024 | |
Letter to the Editor
Cosmography with supernova Refsdal through time-delay cluster lensing: Independent measurements of the Hubble constant and geometry of the Universe
1
Dipartimento di Fisica, Università degli Studi di Milano, Via Celoria 16, 20133 Milano, Italy
e-mail: This email address is being protected from spambots. You need JavaScript enabled to view it.
2
INAF – IASF Milano, Via A. Corti 12, 20133 Milano, Italy
3
Dipartimento di Fisica e Scienze della Terra, Università degli Studi di Ferrara, Via Saragat 1, 44122 Ferrara, Italy
4
INFN – Sezione di Ferrara, Via Saragat 1, 44122 Ferrara, Italy
5
Université Paris-Saclay, CNRS, Institut d’Astrophysique Spatiale, 91405 Orsay, France
6
INAF – OAS, Osservatorio di Astrofisica e Scienza dello Spazio di Bologna, Via Gobetti 93/3, 40129 Bologna, Italy
7
Technical University of Munich, TUM School of Natural Sciences, Department of Physics, James-Franck-Str. 1, 85748 Garching, Germany
8
Max-Planck-Institut für Astrophysik, Karl-Schwarzschild-Str. 1, 85748 Garching, Germany
9
Academia Sinica Institute of Astronomy and Astrophysics (ASIAA), 11F of ASMAB, No. 1, Section 4, Roosevelt Road, Taipei 10617, Taiwan
Received:
19
January
2024
Accepted:
28
March
2024
Abstract
We present new measurements of the values of the Hubble constant, matter density, dark energy density, and dark energy density equation-of-state (EoS) parameters. These results have been obtained from a full strong-lensing analysis of the observed positions of 89 multiple images and 4 measured time delays of the supernova (SN) Refsdal in the Hubble Frontier Fields galaxy cluster MACS J1149.5+2223. By strictly following the identical modelling methodology (as done in our previous work undertaken before time delays were available), our cosmographic measurements are essentially blind, based on the frozen procedure. Without using any priors from other cosmological experiments, in an open wCDM cosmological model and via our reference cluster mass model, we measure the following values: H0 = 65.1−3.4+3.5 km s−1 Mpc−1, ΩDE = 0.76−0.10+0.15, and w = −0.92−0.21+0.15 (at the 68.3% confidence level). No other single cosmological probe has been able to simultaneously measure all these parameters. Remarkably, our estimated values of the cosmological parameters, in particular that of H0, are very robust and do not significantly depend on the assumed cosmological model or the cluster mass modelling details. The latter aspect introduces systematic uncertainties on the values of H0 and w, which are found to be largely subdominant compared to the statistical errors. The results of this study demonstrate that the combination of time delays in lens galaxy clusters with extensive photometric and spectroscopic information offers a novel and competitive cosmological tool.
Key words: gravitational lensing: strong / galaxies: clusters: general / cosmological parameters / cosmology: observations
© The Authors 2024
 Open Access article, published by EDP Sciences, under the terms of the Creative Commons Attribution License (https://creativecommons.org/licenses/by/4.0), which permits unrestricted use, distribution, and reproduction in any medium, provided the original work is properly cited.
This article is published in open access under the Subscribe to Open model. This email address is being protected from spambots. You need JavaScript enabled to view it. to support open access publication.
1. Introduction
In the standard cosmological model, the Universe is homogeneous and isotropic on its largest scales; its total mass-energy density is mainly identified in the form of dark energy (ΩΛ ≈ 0.7) and matter (Ωm ≈ 0.3, consisting of both ordinary and dark matter), and its geometry appears to be flat (Ω = Ωm + ΩΛ ≈ 1). These values of the cosmological parameters imply a fairly recent transition from a decelerating to an accelerating cosmic expansion. The current expansion rate, the Hubble constant H0 ≈ 70 km s−1 Mpc−1, represents another fundamental quantity that defines many of the most important scales in the Universe (e.g. its age and critical density). Despite the still unknown physical origin of the two dominant dark components, the standard cosmological ΛCDM model requires only a few parameters to aptly reproduce nearly all the current observational data: precision measurements of the temperature fluctuations in the cosmic microwave background (CMB; Planck Collaboration VI 2020), observed abundances of light elements (Cooke et al. 2018; Valerdi et al. 2019; Izotov et al. 2014; Aver et al. 2015), the large-scale distribution of galaxies (LSS; Alam et al. 2017), and the luminosity-distance relationship for distant type Ia supernovae (SNIa; Scolnic et al. 2018). The estimates of different cosmological parameters from a single observational method are often correlated, exhibiting significant uncertainties, and they can vary markedly with the adopted underlying cosmological model. This suggests that accurate and precise measurements of the cosmological parameters can only be obtained by combining complementary and independent techniques. In fact, considerable efforts are still being made in this direction (see e.g. Moresco et al. 2022).
In this Letter, we focus on the Hubble Frontier Fields (HFF) galaxy cluster MACS J1149.5+2223 (hereafter MACS 1149; z = 0.542), where the strongly lensed SN “Refsdal” (z = 1.489) was discovered (Kelly et al. 2015, 2016a). We exploit a large set of spectroscopically confirmed multiple images from different sources, identified from Hubble Space Telescope deep imaging and Multi Unit Spectroscopic Explorer (MUSE) data (Treu et al. 2016; Grillo et al. 2016, hereafter G16), as well as the measured values of the time delays of the SN Refsdal multiple images (Kelly et al. 2016b, 2023a; Rodney et al. 2016). We build on our previous strong lensing analyses (G16; Grillo et al. 2018, hereafter G18; Grillo et al. 2020, hereafter G20), where we have described and extensively tested the methodology. Here, we aim to establish the final, robust measurements of the values of the cosmological parameters introduced above, based on the data of MACS 1149 and SN Refsdal alone. A simultaneous measurement of all parameters in a very general cosmological model represents the most innovative part of our new time-delay cluster lensing probe, especially when compared to other methods and experiments.
2. Methods
To perform our strong-lensing and cosmographic study, we exploited the observed positions of 89 multiple images from 28 distinct background sources, distributed in redshift between 1.240 and 3.703 and approximated as point-like objects. We also used the measured values of the time delays of the images S2, S3, S4, and SX, relative to S1, of SN Refsdal, recently published by Kelly et al. (2023a). In particular, we adopted the median values and assumed symmetric 1σ errors for the time delays (obtained, respectively, from the 50th and the semi-difference between the 84th and 16th percentiles of the “Combined” method in Table 15 of Kelly et al. 2023a); namely, ΔtS2 : S1 = (9.9 ± 4.0) days, ΔtS3 : S1 = (9.0 ± 4.2) days, ΔtS4 : S1 = (20.3 ± 6.4) days, and ΔtSX : S1 = (376.0 ± 5.6) days. We modelled the cluster total mass distribution on the different cluster and member galaxy spatial scales with the combination of, respectively, three cored elliptical pseudo-isothermal and 300 dual pseudo-isothermal mass density profiles. All the details of this model have been presented in G16, G18, and G20 (r model).
We emphasise that this is the same mass parametrisation originally adopted in G16, which blindly predicted a position for SX less than 0.2 arcsec away from the value observed later, with a time delay of  days, for an assumed value of H0 = 70 km s−1 Mpc−1, and a flat ΛCDM cosmological model with Ωm = 0.3. As in G18 and G20, we reoptimised the same lens model by adding the constraints from the time delays and the position of SX, leaving all cosmological parameters free to vary. We remind that the values of the cosmological parameters affect the combinations of the angular-diameter distances appearing in the so-called time-delay distance, DΔt, and family ratios, Ξ (see Eqs. (2) and (3) in G18).
Following G20, we quantified the possible systematic uncertainties on the measurement of the values of the cosmological parameters by also taking into account: (1) a constant sheet of mass at the cluster redshift with a uniform prior between −0.2 and 0.2 on the value of the convergence k0 (model labeled as κ) and (2) a more flexible power-law mass density profile (i.e. ρ(r)∼r−γ in the outer regions, r ≫ rc) with a uniform prior between 1.4 and 2.6 on the value of γ for the cluster main halo (model labeled as γ).
We considered the following four cosmological models:
-
fΛCDM: a flat (Ωm + ΩΛ = 1) ΛCDM model;
-
oΛCDM: an open ΛCDM model, in which the values of Ωm and ΩΛ are independent;
-
fwCDM: a flat (Ωm + ΩDE = 1) wCDM model, in which the dark energy density is time dependent, with an equation-of-state parameter, w;
-
owCDM: an open wCDM model, where the values of Ωm and ΩDE are independent and the dark energy density is time dependent, with an equation-of-state parameter, w.
We adopted uniform priors on the values of H0, between 20 and 120 km s−1 Mpc−1, Ωm, between 0 and 1, ΩΛ or ΩDE, between 0 and 1, and w, between −2 and 0. We used the software GLEE (Suyu & Halkola 2010; Suyu et al. 2012) to perform the entire strong-lensing analysis.
3. Results
In all cosmological scenarios, our best-fitting models can reproduce the observed positions of the multiple images (SN Refsdal knots) with a root mean square (rms) offset of only 0.25″ (0.11″) and the measured time-delays within less than their 1σ errors.
We summarise in Table 1 the mean values and the 68.3% confidence level (CL) intervals for H0, Ωm, ΩΛ or ΩDE, and w, measured in the different cosmological models from our strong lensing analysis of MACS 1149 and without any information from other cosmological probes. Chains are analysed using the getdist software (Lewis 2019). Mean values are computed integrating the marginalised one-dimensional distributions. The confidence intervals are obtained slicing the marginalised distributions at constant ordinate and keeping the parameter intervals that contain 68.3% of their probability. In Fig. 1, we show the contour levels and the marginalised probability distribution functions of the same cosmological parameters and the corresponding 68.3% and 95.4% confidence regions.
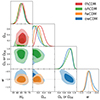 |
Fig. 1. Contour levels and marginalised probability distribution functions of H0, Ωm, ΩΛ or ΩDE, and w (from top to bottom) for different cosmological models (in different colours) from time-delay cosmography in MACS 1149 only (r model). The contour levels on the planes represent the 68.3% and 95.4% confidence regions. Uniform priors on the values of all cosmological parameters (H0 ∈ [20, 120] km s−1 Mpc−1, Ωm ∈ [0, 1], ΩΛ or ΩDE ∈ [0, 1], w ∈ [ − 2, 0]) are considered in our analysis. Final MCMC chains have 2 × 10⁶ samples for each model. The dashed lines indicate models with w = −1, i.e. corresponding to a cosmological constant. |
Cosmological parameters for different cosmological models from time-delay cosmography in MACS 1149 only (r model).
First, we remark that the centres and the dispersions of the marginalised probability distribution functions (i.e. the mean values and the 68.3% CL intervals) of H0, ΩΛ or ΩDE, and w, depend only very mildly on the adopted cosmological model (i.e. flat or open, with a cosmological constant or a more general dark-energy component). The inference on the value of Ωm is instead quite sensitive to the chosen cosmology.
In keeping with the results in G18 and G20, we find that we can estimate the value of H0 with the smallest uncertainty, namely, less than 6%. The value of ΩΛ or ΩDE is affected by an error ranging between 10% and 20%. Surprisingly, the value of w can also be measured with an uncertainty slightly smaller than 20%. The value of Ωm can be estimated with 40−50% uncertainty in models with a cosmological constant and only upper limits can be obtained in more general dark-energy models (i.e., when w is allowed to vary).
The achieved precision on the values of the considered cosmological parameters can be ascribed to the combined information contained in (1) the measured time delays of the multiple images of SN Refsdal, depending primarily on the value of H0 and more mildly on those of the other parameters, and (2) the observed positions of the multiple images of the other sources at different redshifts, which are insensitive to the value of H0 but sensitive to those of the other parameters (see G18 and G20 for more details).
In Fig. 2, we show in the most general cosmological model considered in this study, namely, an open wCDM model, the estimated values of the cosmological parameters for the three r, κ, and γ cluster mass models. We remark that all measurements are consistent, with very similar uncertainties for the same cosmological parameter. The inferred value of H0 is notably stable: the maximum difference between the three mean values (1.4 km s−1 Mpc−1) is approximately 40% of the mean statistical error (3.6 km s−1 Mpc−1). The measured mean values of Ωm and ΩDE vary less than their average statistical uncertainties. The different mean values of w span a range approximately equal to half the mean statistical error. By taking the differences in the mean values of the three models into account, we can include statistical plus systematic errors when quoting relative uncertainties for H0 and w, finding approximately 6% and 21%, respectively. We estimated the values of the Bayesian information criterion (BIC; Schwarz 1978) and of the Akaike information criterion (AIC; Akaike 1974) and found positive evidence that the reference (r) model is preferred to the κ and γ models. We also notice the 68.3% CL intervals for κ and γ include the fixed values adopted in the r model (i.e., κ = 0 and γ = 2).
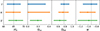 |
Fig. 2. Mean values and 68.3% CL intervals of H0, Ωm, ΩDE, and w in an open wCDM (owCDM) model for the reference model (r; see also Table 1) and the extended models with an additional constant sheet of mass at the cluster redshift (κ) and a power-law density profile for the cluster main halo (γ). For Ωm, in the r and κ models, we show 95.4% upper limits. Vertical lines highlight the mean values of the reference model. |
In Figs. 3–6, we compare the measurements of the cosmological parameters derived from time-delay cosmography in MACS 1149 (r model) and from other probes. As parameter sampler, we employed cosmomc (Lewis & Bridle 2002; Lewis 2013) coupled with camb Boltzmann code (Lewis et al. 2000; Howlett et al. 2012). In what follows, we briefly outline the datasets used and the main assumptions behind each of them.
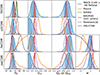 |
Fig. 3. Marginalised probability distribution functions of H0, Ωm, ΩΛ or ΩDE, and w (from left to right) for different cosmological models (from top to bottom). Coloured lines show the one-dimensional posterior distributions obtained from various cosmological datasets: time-delay cosmography in MACS 1149 (r model) in blue; Planck (Planck Collaboration VI 2020) in orange; SH0ES (Riess et al. 2021) in green; Baryon acoustic oscillations (BAO) and redshift-space distortions (RSD; Alam et al. 2021) in red; the SN Pantheon sample (Scolnic et al. 2018) in purple; and H0LiCOW (Wong et al. 2020) in brown. Blue shaded regions represent the 68.3% (darker) and 95.4% (lighter) CL regions for time-delay cosmography in MACS 1149. For SH0ES, only the probability density distribution function of H0 in a fΛCDM model is available and shown here. For BAORSD, we also included Gaussian priors on the values of ωb and ns (see the list of datasets in Sect. 3). For H0LiCOW, chains for the fΛCDM, oΛCDM and fwCDM models are available and here only the probability density distribution functions of H0 and w are shown, since the adopted smaller prior on Ωm causes a sharp edge in the posteriors of Ωm and ΩΛ or ΩDE. |
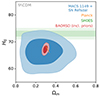 |
Fig. 4. Contour levels at the 68.3% (darker) and 95.4% (lighter) CL of H0 and Ωm in a flat ΛCDM (fΛCDM) model for different cosmological probes: time-delay cosmography in MACS 1149 (r model; blue), Planck (orange), and BAORSD (red). For completeness, we also show the SH0ES measurement of the Hubble parameter (green; Riess et al. 2021). BAORSD includes Gaussian priors on the values of ωb and ns. Details on these datasets are given in Sect. 3. |
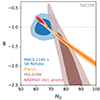 |
Fig. 5. Contour levels at the 68.3% (darker) and 95.4% (lighter) CL of w and H0 in a flat wCDM (fwCDM) model for different cosmological probes: time-delay cosmography in MACS 1149 (r model; blue), Planck (orange), H0LiCOW (brown), and BAORSD (red). The horizontal dashed line corresponds to models with w = −1, i.e. with a cosmological constant. BAORSD includes Gaussian priors on the values of ωb and ns. Details on these datasets are given in Sect. 3. |
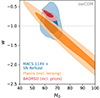 |
Fig. 6. Contour levels at the 68.3% (darker) and 95.4% (lighter) CL of w and H0 in an open wCDM (owCDM) model for different cosmological probes: time-delay cosmography in MACS 1149 (r model; blue), Planck (incl. lensing; orange), and BAORSD (red). The horizontal dashed line corresponds to models with w = −1, i.e. with a cosmological constant. BAORSD includes Gaussian priors on the values of ωb and ns. Details on these datasets are given in Sect. 3. |
Planck 2018 cosmic microwave background (CMB) temperature and polarization measurements, described in Planck Collaboration V (2020). For this dataset, we explored the canonical parameter space, sampling both cosmological and nuisance parameters. Following Planck Collaboration VI (2020), we did not directly vary the value of the Hubble parameter, but instead that of θMC instead (an approximation to the angular size of the sound horizon at the last scattering). We then obtained the value of H0 as a derived parameter. We refer to this dataset as Planck. In Fig. 6, we also added the Planck 2018 lensing potential power spectrum likelihood (Planck Collaboration VIII 2020). We label this dataset as Planck (incl. lensing).
Distance ladder measurements from the SH0ES program (Riess et al. 2021) in a fΛCDM model. We label this dataset as SH0ES.
Baryon acoustic oscillations (BAO) and redshift-space distortions (RSD) measurements from the completed SDSS-IV eBOSS survey, as described in Table 3 of Alam et al. (2021). As suggested by the authors, for this dataset, we also included a BBN-inspired prior on ωb (i.e. 𝒩(0.0222, 0.0005)) and a prior of ns (i.e., 𝒩(0.96, 0.02)), and we explored the same parameter space considered in the CMB analysis1. We refer to this combination as BAORSD (incl. priors).
Type Ia Supernovae (SNe Ia) included in the “Pantheon sample” (Scolnic et al. 2018). We label this dataset as Pantheon18. Here, we only explored the cosmological parameters H0, Ωm, ΩΛ or ΩDE, and w.
A collection of six gravitationally lensed quasars with measured time delays provided by the H0LiCOW collaboration (Wong et al. 2020). In this case, we show the posteriors obtained by analysing the public chains2. While analyses of new lenses and data are underway with more flexible mass models in some cases (e.g. Shajib et al. 2020, 2022, 2023; Millon et al. 2020; Birrer et al. 2020), we used the publicly-available H0LiCOW chains for the fΛCDM, oΛCDM and fwCDM models, which were computed with a narrower prior on Ωm; namely, [0.05, 0.5]. We refer to this dataset as H0LiCOW.
In Fig. 3, we compare the marginalised probability distribution functions of H0, Ωm, ΩΛ or ΩDE, and w obtained from analysing the data of the various cosmological probes mentioned above and assuming different underlying cosmological models. Time-delay cosmography in MACS 1149 shows remarkably stable results across the models, even when relaxing the assumptions on the geometry of the Universe (as already highlighted in Fig. 1). Despite being more sensitive within the minimal flat ΛCDM model, the other probes show probability distribution functions that vary more significantly, both in terms of centre and dispersion, in more general cosmological models. This suggests that they cannot break as efficiently as time-delay cosmography in MACS 1149 the degeneracies among the different parameters in the extended cosmological models. We notice that no other probe, without any additional priors, can measure the values of all key cosmological parameters, namely, H0, Ωm, ΩΛ or ΩDE, and w, at the level of consistency found for time-delay cosmography in MACS 1149 in all four cosmological models considered here. In particular, the maximum differences of the parameter values obtained in the four considered cosmological models, in units of the 1σ error of an open wCDM cosmological model, are approximately 0.4, 0.8, and 0.4 for H0, ΩΛ or ΩDE, and w, respectively. As visible and already noted above, the values of Ωm are consistent, but their differences are statistically more significant.
In a flat ΛCDM model, the constraining power of time-delay cosmography in MACS 1149 is surpassed by both BAO (combined with redshift-space distortions) and Planck measurements (see Fig. 4). In particular, the temperature and polarization data of the CMB are very sensitive to the quantity Ωmh3, leading to very precise estimates of both the values of Ωm and H0. However, those constraints are strongly model-dependent (Planck Collaboration VI 2020). We note that the BAORSD dataset is supplemented by a BBN-inspired prior that allows one to highly increase the sensitivity to H0 (see Alam et al. 2021 for more details). In general, time-delay cosmography in MACS 1149 cannot measure very precisely the values of the matter and dark-energy density parameters, in particular that of Ωm, as clearly visible in Fig. 3. However, relaxing the assumption of a cosmological constant and exploring the equation-of-state parameter of dark energy, w, Planck data lose constraining power, while time-delay cosmography in MACS 1149 is still capable of providing robust results. The same is true for most of the other cosmological probes, such as H0LiCOW, for which the degeneracy between the values of H0 and w cannot be broken without the inclusion of additional data (e.g. Taubenberger et al. 2019). For a flat wCDM cosmological model, the most recent results of the different probes on the plane H0 − w are shown in Fig. 5. If we further relax the model, considering an open wCDM model, time-delay cosmography in MACS 1149 is even more competitive. As illustrated in Fig. 6, this is the only method that (without the addition of any external dataset or prior) is currently able to provide results that are consistent with those obtained in the other cosmological models and showing on the H0 − w plane closed contours at the 95.4% CL.
Interestingly, the constraints on the cosmological parameter planes from time-delay cluster lensing are oriented in such a way to be complementary to those coming from other observational techniques. Although each method probes very different physics, the results are consistent and the overall agreement on very small regions of the planes supports the validity of the concordance wCDM model.
We note that the recent work by Kelly et al. (2023b) reported a value of H0 only in a fΛCDM model, in which the values of all the other cosmological parameters are fixed to Ωm = 0.3, ΩΛ = 0.7, and w = −1. The authors weighted the different results (including the non-revised ones we originally provided) of the groups who participated in the initial analysis on the reappearance of SN Refsdal (Treu et al. 2016). The value of H0 published by Kelly et al. (2023b;  km s−1 Mpc−1) is consistent with the blind one presented three years earlier in Table 1 of G20 (assuming a similar time-delay value of ΔtSX : S1 = (375 ± 10) days) and with that obtained in this study (see Table 1).
By considering the spectroscopically confirmed and multiply imaged galaxies within the fields of view of five massive lens galaxy clusters and the expected number of galaxy clusters in the Vera C. Rubin Observatory Legacy Survey of Space and Time (LSST; LSST Science Collaboration 2009; Oguri & Blandford 2009), Petrushevska (2020) predicted a lower limit of more than ten SNe strongly lensed by massive galaxy clusters only. After SN Refsdal, three additional multiply imaged and spatially resolved SNe (named “Requiem”, “H0pe”, and “Encore”) were identified in data from Hubble Space Telescope (Rodney et al. 2021) and James Webb Space Telescope (Frye et al. 2024; Pierel et al. 2024) targeting galaxy cluster fields. Cosmographic analyses through strong lensing (similar to those presented here) are currently underway in those fields. Moreover, thanks to the Sloan Digital Sky Survey observations, three (Inada et al. 2003, 2006; Dahle et al. 2013) out of less than a hundred multiply-imaged QSOs3 were detected behind lens galaxy groups or clusters (see e.g. Acebron et al. 2022a,b for some modelling results). LSST is expected to discover around 2600 strongly lensed QSOs (LSST Science Collaboration 2009). Thus, by simply rescaling the SDSS statistics, several tens of multiply-imaged QSOs found by LSST will be lensed by galaxy groups or clusters. Furthermore, the ongoing Euclid mission is expected to significantly increase the number of QSOs strongly lensed by galaxy clusters, providing high angular resolution imaging. These forecasts suggest that the cosmological study performed in this work will be the first among many future ones and that time-delay cluster lensing will rapidly grow in the next decade (see also Acebron et al. 2023; Bergamini et al. 2024).
4. Conclusions
We measured the values and the uncertainties of the Hubble constant, matter and dark-energy density parameters, and dark-energy equation-of-state parameter by means of a strong lensing analysis of the galaxy cluster MACS J1149.5+2223. We exploited high-quality photometric and spectroscopic data for a large number of multiple images at different redshifts and the new measured time delays of the multiple images of SN Refsdal. Compared to other standard cosmological probes, we have shown that this method can provide very stable results, depending only very mildly on the underlying cosmological model and on the lens modelling details. We have found only small differences in the probability distribution functions of the key cosmological parameters by extending the cosmological model from a flat ΛCDM to an open wCDM model. We have also demonstrated that the so-called “mass-sheet” and “mass-slope” degeneracies are substantially mitigated by the presence of many multiple images, observed over relatively large ranges of projected distances from the cluster centre and redshifts. In particular, H0 constraints only vary within 1.4 km s−1 Mpc−1 for all the lensing models we have considered. Without using any priors from previous cosmological experiments, we have found that in an open wCDM model, this novel technique offers results that are superior to those of the most recent CMB and BAO data. In particular, it is able to produce combined statistical and systematic relative errors (at the 68.3% CL) of approximately 6% and 21% for H0 and w, respectively. We expect that time-delay cluster lensing will become a new accurate and precise cosmological probe, thanks also to the many cluster strong lenses that will be discovered in forthcoming deep and wide surveys.
The complete list of measurements, likelihood code, and settings used in Alam et al. (2021) are available at https://github.com/evamariam/CosmoMC_SDSS2020 and at https://www.sdss4.org/science/final-bao-and-rsd-measurements/
H0LiCOW likelihood code and chains are available here: https://github.com/shsuyu/H0LiCOW-public (Millon & Bonvin 2020). These results are based on lensing distances measured using physically-motivated lens mass models by Suyu et al. (2010. 2014), Wong et al. (2017), Birrer et al. (2019), Chen et al. (2019), Jee et al. (2019), Rusu et al. (2020).
Acknowledgments
C.G. and P.R. acknowledge support through grants MIUR2017 WSCC32 and MIUR2020 SKSTHZ. L.P. acknowledges the financial support from the INFN InDark project and from the COSMOS network (www.cosmosnet.it) through the ASI (Italian Space Agency) Grants 2016-24-H.0 and 2016-24-H.1-2018. S.H.S. thanks the Max Planck Society for support through the Max Planck Research Group and Fellowship, and the European Research Council (ERC) for support under the European Union’s Horizon 2020 research and innovation programme (LENSNOVA: grant agreement No. 771776). This work is based in large part on data collected in service mode at ESO VLT, through the Director’s Discretionary Time Programme 294.A-5032. The CLASH Multi-Cycle Treasury Program is based on observations made with the NASA/ESA Hubble Space Telescope. The Space Telescope Science Institute is operated by the Association of Universities for Research in Astronomy, Inc., under NASA contract NAS 5-26555. ACS was developed under NASA Contract NAS 5-32864. We acknowledge the use of numpy (Harris et al. 2020), matplotlib (Hunter 2007), and getdist (Lewis 2019) software packages, and the use of computing facilities at CINECA.
References
- Acebron, A., Grillo, C., Bergamini, P., et al. 2022a, A&A, 668, A142 [NASA ADS] [CrossRef] [EDP Sciences] [Google Scholar]
- Acebron, A., Grillo, C., Bergamini, P., et al. 2022b, ApJ, 926, 86 [NASA ADS] [CrossRef] [Google Scholar]
- Acebron, A., Schuldt, S., Grillo, C., et al. 2023, A&A, 680, L9 [NASA ADS] [CrossRef] [EDP Sciences] [Google Scholar]
- Akaike, H. 1974, IEEE Trans. Autom. Control, 19, 716 [Google Scholar]
- Alam, S., Ata, M., Bailey, S., et al. 2017, MNRAS, 470, 2617 [Google Scholar]
- Alam, S., Aubert, M., Avila, S., et al. 2021, Phys. Rev. D, 103, 083533 [NASA ADS] [CrossRef] [Google Scholar]
- Aver, E., Olive, K. A., & Skillman, E. D. 2015, JCAP, 2015, 011 [CrossRef] [Google Scholar]
- Bergamini, P., Schuldt, S., Acebron, A., et al. 2024, A&A, 682, L2 [NASA ADS] [CrossRef] [EDP Sciences] [Google Scholar]
- Birrer, S., Treu, T., Rusu, C. E., et al. 2019, MNRAS, 484, 4726 [Google Scholar]
- Birrer, S., Shajib, A. J., Galan, A., et al. 2020, A&A, 643, A165 [NASA ADS] [CrossRef] [EDP Sciences] [Google Scholar]
- Chen, G. C. F., Fassnacht, C. D., Suyu, S. H., et al. 2019, MNRAS, 490, 1743 [NASA ADS] [CrossRef] [Google Scholar]
- Cooke, R. J., Pettini, M., & Steidel, C. C. 2018, ApJ, 855, 102 [Google Scholar]
- Dahle, H., Gladders, M. D., Sharon, K., et al. 2013, ApJ, 773, 146 [NASA ADS] [CrossRef] [Google Scholar]
- Frye, B. L., Pascale, M., Pierel, J., et al. 2024, ApJ, 961, 171 [NASA ADS] [CrossRef] [Google Scholar]
- Grillo, C., Karman, W., Suyu, S. H., et al. 2016, ApJ, 822, 78 [Google Scholar]
- Grillo, C., Rosati, P., Suyu, S. H., et al. 2018, ApJ, 860, 94 [Google Scholar]
- Grillo, C., Rosati, P., Suyu, S. H., et al. 2020, ApJ, 898, 87 [Google Scholar]
- Harris, C. R., Millman, K. J., van der Walt, S. J., et al. 2020, Nature, 585, 357 [NASA ADS] [CrossRef] [Google Scholar]
- Howlett, C., Lewis, A., Hall, A., & Challinor, A. 2012, JCAP, 2012, 027 [Google Scholar]
- Hunter, J. D. 2007, Comput. Sci. Eng., 9, 90 [NASA ADS] [CrossRef] [Google Scholar]
- Inada, N., Oguri, M., Pindor, B., et al. 2003, Nature, 426, 810 [NASA ADS] [CrossRef] [Google Scholar]
- Inada, N., Oguri, M., Morokuma, T., et al. 2006, ApJ, 653, L97 [Google Scholar]
- Izotov, Y. I., Thuan, T. X., & Guseva, N. G. 2014, MNRAS, 445, 778 [NASA ADS] [CrossRef] [Google Scholar]
- Jee, I., Suyu, S. H., Komatsu, E., et al. 2019, Science, 365, 1134 [NASA ADS] [CrossRef] [Google Scholar]
- Kelly, P. L., Rodney, S. A., Treu, T., et al. 2015, Science, 347, 1123 [Google Scholar]
- Kelly, P. L., Brammer, G., Selsing, J., et al. 2016a, ApJ, 831, 205 [NASA ADS] [CrossRef] [Google Scholar]
- Kelly, P. L., Rodney, S. A., Treu, T., et al. 2016b, ApJ, 819, L8 [NASA ADS] [CrossRef] [Google Scholar]
- Kelly, P. L., Rodney, S., Treu, T., et al. 2023a, ApJ, 948, 93 [NASA ADS] [CrossRef] [Google Scholar]
- Kelly, P. L., Rodney, S., Treu, T., et al. 2023b, Science, 380, abh1322 [NASA ADS] [CrossRef] [Google Scholar]
- Lewis, A. 2013, Phys. Rev. D, 87, 103529 [NASA ADS] [CrossRef] [Google Scholar]
- Lewis, A. 2019, arXiv e-prints [arXiv:1910.13970] [Google Scholar]
- Lewis, A., & Bridle, S. 2002, Phys. Rev. D, 66, 103511 [Google Scholar]
- Lewis, A., Challinor, A., & Lasenby, A. 2000, ApJ, 538, 473 [Google Scholar]
- LSST Science Collaboration (Abell, P. A., et al.) 2009, arXiv e-prints [arXiv:0912.0201] [Google Scholar]
- Millon, M., & Bonvin, V. 2020, https://doi.org/10.5281/zenodo.3633035 [Google Scholar]
- Millon, M., Galan, A., Courbin, F., et al. 2020, A&A, 639, A101 [NASA ADS] [CrossRef] [EDP Sciences] [Google Scholar]
- Moresco, M., Amati, L., Amendola, L., et al. 2022, Liv. Rev. Relat., 25, 6 [NASA ADS] [Google Scholar]
- Oguri, M., & Blandford, R. D. 2009, MNRAS, 392, 930 [CrossRef] [Google Scholar]
- Petrushevska, T. 2020, Symmetry, 12, 1966 [NASA ADS] [CrossRef] [Google Scholar]
- Pierel, J. D. R., Newman, A. B., Dhawan, S., et al. 2024, ApJL, submitted [arXiv:2404.02139] [Google Scholar]
- Planck Collaboration V. 2020, A&A, 641, A5 [NASA ADS] [CrossRef] [EDP Sciences] [Google Scholar]
- Planck Collaboration VI. 2020, A&A, 641, A6 [NASA ADS] [CrossRef] [EDP Sciences] [Google Scholar]
- Planck Collaboration VIII. 2020, A&A, 641, A8 [NASA ADS] [CrossRef] [EDP Sciences] [Google Scholar]
- Riess, A. G., Casertano, S., Yuan, W., et al. 2021, ApJ, 908, L6 [NASA ADS] [CrossRef] [Google Scholar]
- Rodney, S. A., Strolger, L. G., Kelly, P. L., et al. 2016, ApJ, 820, 50 [NASA ADS] [CrossRef] [Google Scholar]
- Rodney, S. A., Brammer, G. B., Pierel, J. D. R., et al. 2021, Nat. Astron., 5, 1118 [NASA ADS] [CrossRef] [Google Scholar]
- Rusu, C. E., Wong, K. C., Bonvin, V., et al. 2020, MNRAS, 498, 1440 [Google Scholar]
- Schwarz, G. 1978, Ann. Stat., 6, 461 [Google Scholar]
- Scolnic, D. M., Jones, D. O., Rest, A., et al. 2018, ApJ, 859, 101 [NASA ADS] [CrossRef] [Google Scholar]
- Shajib, A. J., Birrer, S., Treu, T., et al. 2020, MNRAS, 494, 6072 [Google Scholar]
- Shajib, A. J., Wong, K. C., Birrer, S., et al. 2022, A&A, 667, A123 [NASA ADS] [CrossRef] [EDP Sciences] [Google Scholar]
- Shajib, A. J., Mozumdar, P., Chen, G. C. F., et al. 2023, A&A, 673, A9 [NASA ADS] [CrossRef] [EDP Sciences] [Google Scholar]
- Suyu, S. H., & Halkola, A. 2010, A&A, 524, A94 [NASA ADS] [CrossRef] [EDP Sciences] [Google Scholar]
- Suyu, S. H., Marshall, P. J., Auger, M. W., et al. 2010, ApJ, 711, 201 [Google Scholar]
- Suyu, S. H., Hensel, S. W., McKean, J. P., et al. 2012, ApJ, 750, 10 [Google Scholar]
- Suyu, S. H., Treu, T., Hilbert, S., et al. 2014, ApJ, 788, L35 [NASA ADS] [CrossRef] [Google Scholar]
- Taubenberger, S., Suyu, S. H., Komatsu, E., et al. 2019, A&A, 628, L7 [NASA ADS] [CrossRef] [EDP Sciences] [Google Scholar]
- Treu, T., Brammer, G., Diego, J. M., et al. 2016, ApJ, 817, 60 [Google Scholar]
- Valerdi, M., Peimbert, A., Peimbert, M., & Sixtos, A. 2019, ApJ, 876, 98 [NASA ADS] [CrossRef] [Google Scholar]
- Wong, K. C., Suyu, S. H., Auger, M. W., et al. 2017, MNRAS, 465, 4895 [NASA ADS] [CrossRef] [Google Scholar]
- Wong, K. C., Suyu, S. H., Chen, G. C. F., et al. 2020, MNRAS, 498, 1420 [Google Scholar]
All Tables
Cosmological parameters for different cosmological models from time-delay cosmography in MACS 1149 only (r model).
All Figures
|
Fig. 1. Contour levels and marginalised probability distribution functions of H0, Ωm, ΩΛ or ΩDE, and w (from top to bottom) for different cosmological models (in different colours) from time-delay cosmography in MACS 1149 only (r model). The contour levels on the planes represent the 68.3% and 95.4% confidence regions. Uniform priors on the values of all cosmological parameters (H0 ∈ [20, 120] km s−1 Mpc−1, Ωm ∈ [0, 1], ΩΛ or ΩDE ∈ [0, 1], w ∈ [ − 2, 0]) are considered in our analysis. Final MCMC chains have 2 × 10⁶ samples for each model. The dashed lines indicate models with w = −1, i.e. corresponding to a cosmological constant. |
| In the text | |
|
Fig. 2. Mean values and 68.3% CL intervals of H0, Ωm, ΩDE, and w in an open wCDM (owCDM) model for the reference model (r; see also Table 1) and the extended models with an additional constant sheet of mass at the cluster redshift (κ) and a power-law density profile for the cluster main halo (γ). For Ωm, in the r and κ models, we show 95.4% upper limits. Vertical lines highlight the mean values of the reference model. |
| In the text | |
|
Fig. 3. Marginalised probability distribution functions of H0, Ωm, ΩΛ or ΩDE, and w (from left to right) for different cosmological models (from top to bottom). Coloured lines show the one-dimensional posterior distributions obtained from various cosmological datasets: time-delay cosmography in MACS 1149 (r model) in blue; Planck (Planck Collaboration VI 2020) in orange; SH0ES (Riess et al. 2021) in green; Baryon acoustic oscillations (BAO) and redshift-space distortions (RSD; Alam et al. 2021) in red; the SN Pantheon sample (Scolnic et al. 2018) in purple; and H0LiCOW (Wong et al. 2020) in brown. Blue shaded regions represent the 68.3% (darker) and 95.4% (lighter) CL regions for time-delay cosmography in MACS 1149. For SH0ES, only the probability density distribution function of H0 in a fΛCDM model is available and shown here. For BAORSD, we also included Gaussian priors on the values of ωb and ns (see the list of datasets in Sect. 3). For H0LiCOW, chains for the fΛCDM, oΛCDM and fwCDM models are available and here only the probability density distribution functions of H0 and w are shown, since the adopted smaller prior on Ωm causes a sharp edge in the posteriors of Ωm and ΩΛ or ΩDE. |
| In the text | |
|
Fig. 4. Contour levels at the 68.3% (darker) and 95.4% (lighter) CL of H0 and Ωm in a flat ΛCDM (fΛCDM) model for different cosmological probes: time-delay cosmography in MACS 1149 (r model; blue), Planck (orange), and BAORSD (red). For completeness, we also show the SH0ES measurement of the Hubble parameter (green; Riess et al. 2021). BAORSD includes Gaussian priors on the values of ωb and ns. Details on these datasets are given in Sect. 3. |
| In the text | |
|
Fig. 5. Contour levels at the 68.3% (darker) and 95.4% (lighter) CL of w and H0 in a flat wCDM (fwCDM) model for different cosmological probes: time-delay cosmography in MACS 1149 (r model; blue), Planck (orange), H0LiCOW (brown), and BAORSD (red). The horizontal dashed line corresponds to models with w = −1, i.e. with a cosmological constant. BAORSD includes Gaussian priors on the values of ωb and ns. Details on these datasets are given in Sect. 3. |
| In the text | |
|
Fig. 6. Contour levels at the 68.3% (darker) and 95.4% (lighter) CL of w and H0 in an open wCDM (owCDM) model for different cosmological probes: time-delay cosmography in MACS 1149 (r model; blue), Planck (incl. lensing; orange), and BAORSD (red). The horizontal dashed line corresponds to models with w = −1, i.e. with a cosmological constant. BAORSD includes Gaussian priors on the values of ωb and ns. Details on these datasets are given in Sect. 3. |
| In the text | |
Current usage metrics show cumulative count of Article Views (full-text article views including HTML views, PDF and ePub downloads, according to the available data) and Abstracts Views on Vision4Press platform.
Data correspond to usage on the plateform after 2015. The current usage metrics is available 48-96 hours after online publication and is updated daily on week days.
Initial download of the metrics may take a while.