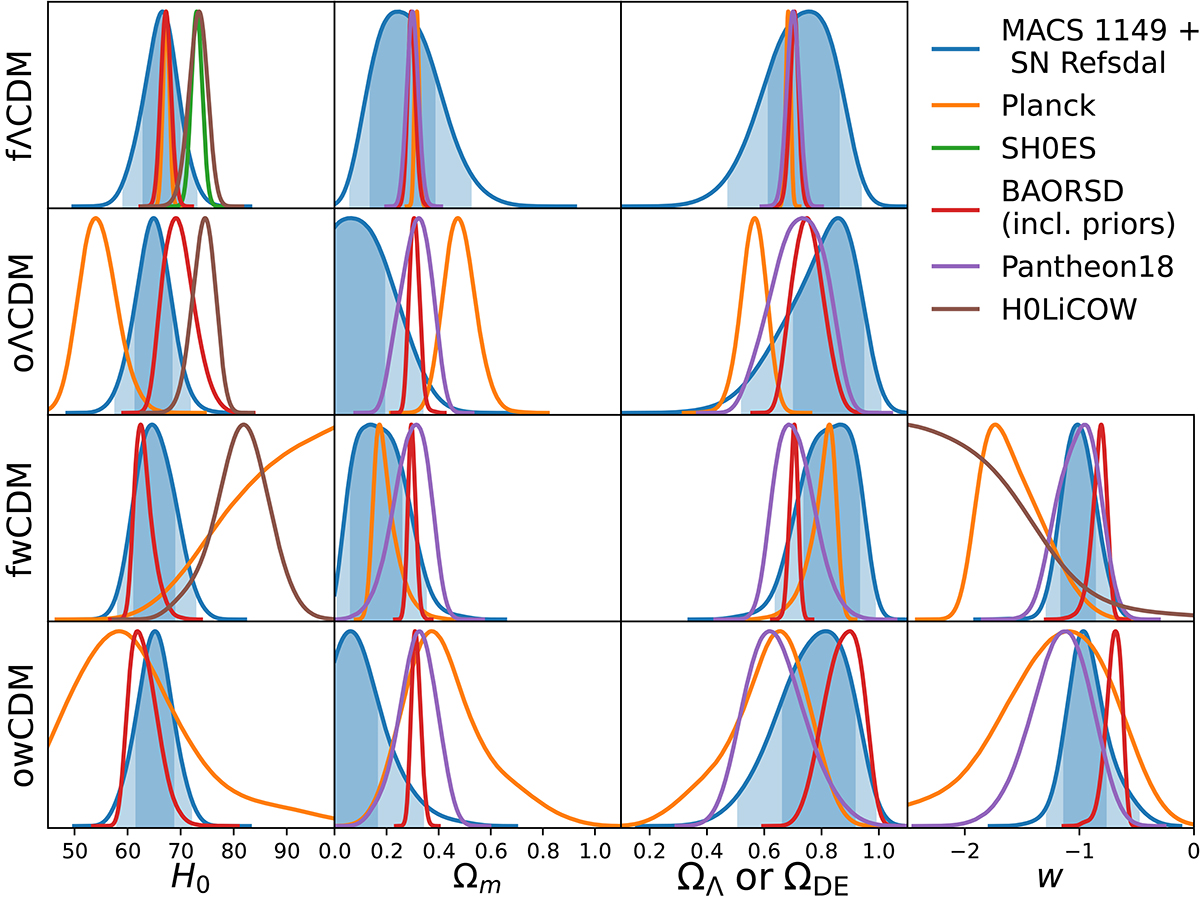
Fig. 3.
Download original image
Marginalised probability distribution functions of H0, Ωm, ΩΛ or ΩDE, and w (from left to right) for different cosmological models (from top to bottom). Coloured lines show the one-dimensional posterior distributions obtained from various cosmological datasets: time-delay cosmography in MACS 1149 (r model) in blue; Planck (Planck Collaboration VI 2020) in orange; SH0ES (Riess et al. 2021) in green; Baryon acoustic oscillations (BAO) and redshift-space distortions (RSD; Alam et al. 2021) in red; the SN Pantheon sample (Scolnic et al. 2018) in purple; and H0LiCOW (Wong et al. 2020) in brown. Blue shaded regions represent the 68.3% (darker) and 95.4% (lighter) CL regions for time-delay cosmography in MACS 1149. For SH0ES, only the probability density distribution function of H0 in a fΛCDM model is available and shown here. For BAORSD, we also included Gaussian priors on the values of ωb and ns (see the list of datasets in Sect. 3). For H0LiCOW, chains for the fΛCDM, oΛCDM and fwCDM models are available and here only the probability density distribution functions of H0 and w are shown, since the adopted smaller prior on Ωm causes a sharp edge in the posteriors of Ωm and ΩΛ or ΩDE.
Current usage metrics show cumulative count of Article Views (full-text article views including HTML views, PDF and ePub downloads, according to the available data) and Abstracts Views on Vision4Press platform.
Data correspond to usage on the plateform after 2015. The current usage metrics is available 48-96 hours after online publication and is updated daily on week days.
Initial download of the metrics may take a while.