Fig. 2.
Download original image
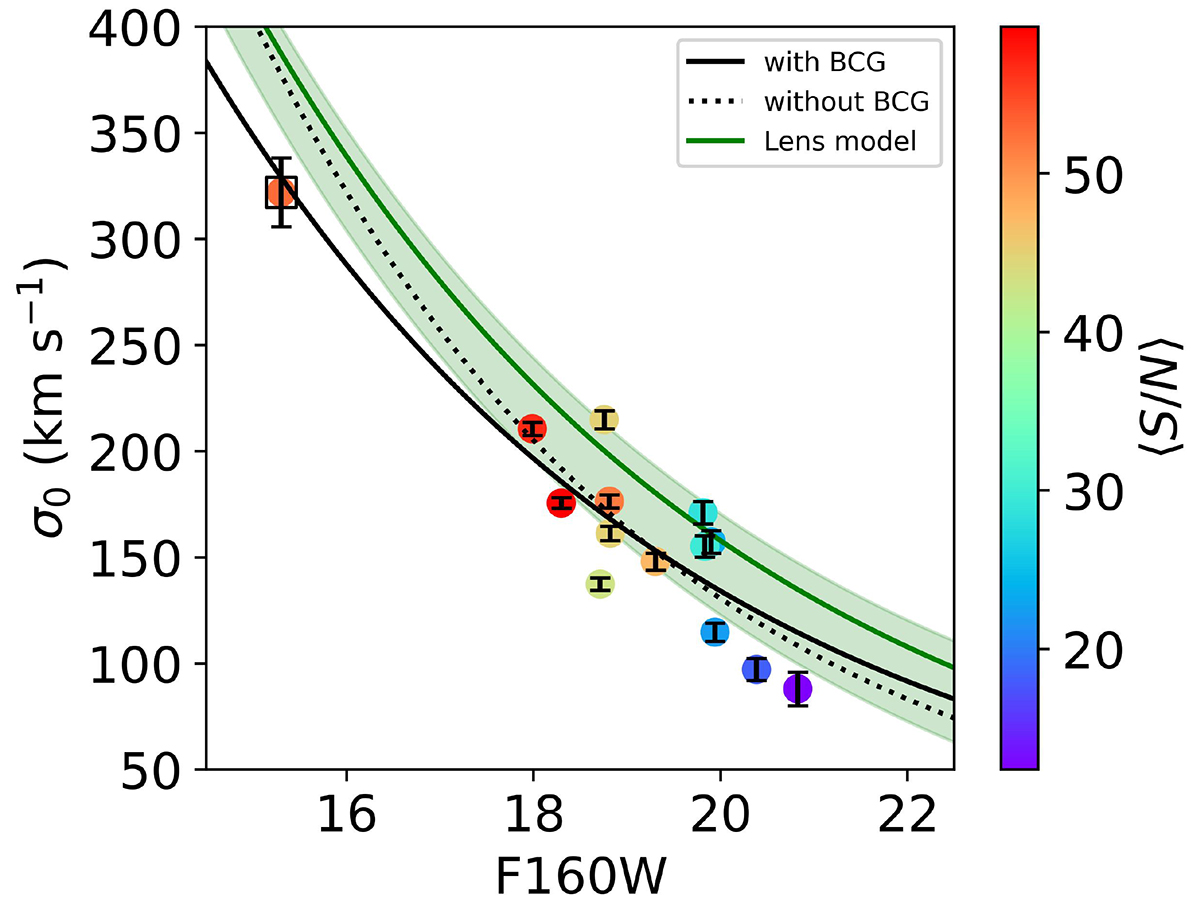
Calibration of the Faber-Jackson relation. The filled circles show the measured stellar velocity dispersions, σ0, of a subset of 14 bright cluster member galaxies as a function of their total magnitudes in the HST F160W band (colour-coded depending on their averaged spectral ⟨S/N⟩ values) from G25. The black square highlights the σ0 measurement of the BCG. The solid and dotted black lines correspond to the best-fit σ0−F160W relations, obtained as described in Sect. 3. The green line and shaded area show the median and the 68% confidence level of the σ0−F160W relation from our reference strong-lensing model.
Current usage metrics show cumulative count of Article Views (full-text article views including HTML views, PDF and ePub downloads, according to the available data) and Abstracts Views on Vision4Press platform.
Data correspond to usage on the plateform after 2015. The current usage metrics is available 48-96 hours after online publication and is updated daily on week days.
Initial download of the metrics may take a while.