Fig. 3.

Download original image
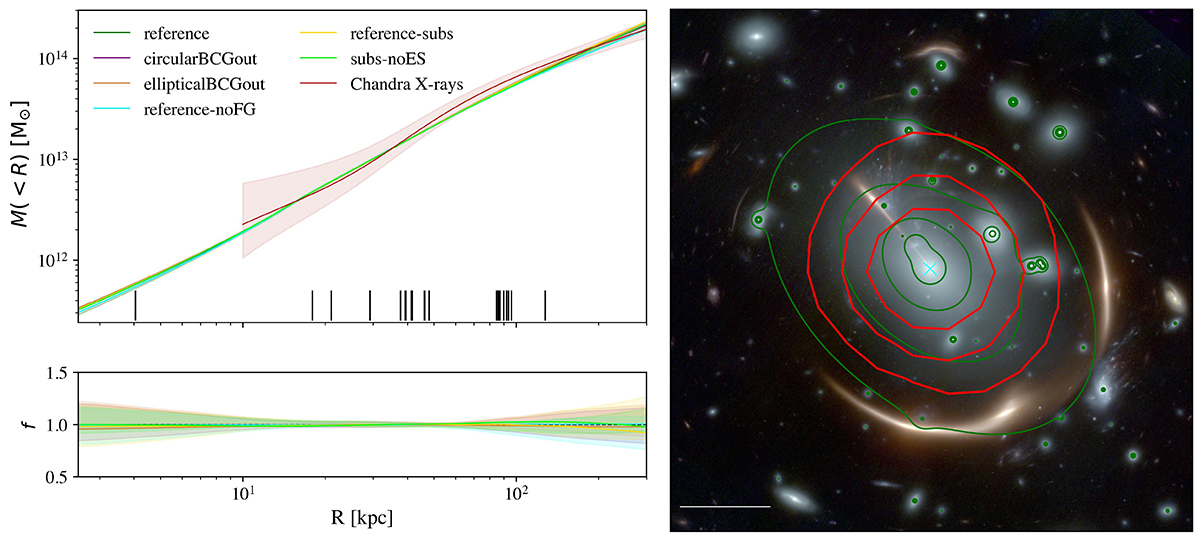
Total mass distribution of MACS J0138. Left: Cumulative projected total mass profile of the lens cluster as a function of the distance from the BCG (highlighted with a cyan cross in Fig. 1). The coloured lines show the median values of the total mass profile, and the shaded regions encompass the 16th and the 84th percentiles, estimated from 1000 random MCMC realisations. The vertical black lines denote the projected distances of the 23 multiple images from the BCG. The bottom panel illustrates the ratio of the projected total mass profiles for the different models and the best-fitting reference one. The cumulative projected hydrostatic mass profile measured from the analysis of the Chandra data, with the associated 1σ uncertainties, is shown in dark red. Right: Colour-composite JWST image of MACS J0138, where we overlay the contour levels (![]() ) of the total projected surface mass density distribution from our best-fit reference strong-lensing model (in dark green) and the Chandra X-ray surface brightness (in red). The white bar represents a scale of 10
) of the total projected surface mass density distribution from our best-fit reference strong-lensing model (in dark green) and the Chandra X-ray surface brightness (in red). The white bar represents a scale of 10![]() . North is up, and east is left.
. North is up, and east is left.
Current usage metrics show cumulative count of Article Views (full-text article views including HTML views, PDF and ePub downloads, according to the available data) and Abstracts Views on Vision4Press platform.
Data correspond to usage on the plateform after 2015. The current usage metrics is available 48-96 hours after online publication and is updated daily on week days.
Initial download of the metrics may take a while.


