| Issue |
A&A
Volume 698, June 2025
|
|
|---|---|---|
| Article Number | A227 | |
| Number of page(s) | 11 | |
| Section | Extragalactic astronomy | |
| DOI | https://doi.org/10.1051/0004-6361/202554110 | |
| Published online | 17 June 2025 | |
Investigating photometric and spectroscopic variability in the multiply imaged little red dot A2744-QSO1
1
Department of Physics, Ben-Gurion University of the Negev, P.O. Box 653, Be’er-Sheva 84105, Israel
2
Center for Computational Astrophysics, Flatiron Institute, New York, NY 10010, USA
3
Department of Astrophysical Sciences, Princeton University, Princeton, NJ 08544, USA
4
Centre for Astrophysics and Supercomputing, Swinburne University of Technology, Melbourne, VIC 3122, Australia
5
Department of Physics & Astronomy and PITT PACC, University of Pittsburgh, Pittsburgh, PA 15260, USA
6
Department of Astronomy, The University of Texas at Austin, Austin, TX 78712, USA
7
Institut d’Astrophysique de Paris, CNRS, Sorbonne Université, 98bis Boulevard Arago, 75014 Paris, France
8
Cosmic Dawn Center (DAWN), Copenhagen, Denmark
9
Niels Bohr Institute, University of Copenhagen, Jagtvej 128, Copenhagen, Denmark
10
Department of Astronomy, University of Massachusetts, Amherst, MA 01003, USA
11
Kapteyn Astronomical Institute, University of Groningen, PO Box 800, 9700 AV Groningen, The Netherlands
12
Department of Astrophysics, Universität Zürich, Winterthurerstrasse 190, CH-8044 Zurich, Switzerland
13
Department of Astronomy & Astrophysics, The Pennsylvania State University, University Park, PA 16802, USA
14
Institute for Computational & Data Sciences, The Pennsylvania State University, University Park, PA 16802, USA
15
Institute for Gravitation and the Cosmos, The Pennsylvania State University, University Park PA 16802, USA
16
Institute of Science and Technology Austria (ISTA), Am Campus 1, 3400 Klosterneuburg, Austria
17
MIT Kavli Institute for Astrophysics and Space Research, 70 Vassar Street, Cambridge, 02139 Massachusetts, USA
18
Department for Astrophysical and Planetary Science, University of Colorado, Boulder, CO 80309, USA
19
Département d’Astronomie, Université de Genève, Chemin Pegasi 51, 1290 Versoix, Switzerland
20
Department of Physics and Astronomy, Tufts University, 574 Boston Ave., Medford MA 02155, USA
⋆ Corresponding author: This email address is being protected from spambots. You need JavaScript enabled to view it.
Received:
12
February
2025
Accepted:
2
May
2025
Abstract
JWST observations have uncovered a new population of red, compact objects at high redshifts dubbed “little red dots” (LRDs), which typically show broad emission lines and are thought to be dusty active galactic nuclei (AGNs). Some of their other features, however, challenge the AGN explanation, such as prominent Balmer breaks and extremely faint or even missing metal high-ionization lines, X-ray, or radio emission, including in deep stacks. Time variability is another robust test of AGN activity. Here, we exploit the z = 7.045 multiply imaged LRD A2744-QSO1, which offers a particularly unique test of variability due to lensing-induced time delays between the three images spanning 22 yr (2.7 yr in the rest-frame), to investigate its photometric and spectroscopic variability. We find the equivalent widths (EWs) of the broad Hα and Hβ lines, which are independent of magnification and other systematics, to exhibit significant variations, of up to 18 ± 3% for Hα and up to 22 ± 8% in Hβ, on a timescale of 875 d (2.4 yr) in the rest-frame. This suggests that A2744-QSO1 is indeed an AGN. We find no significant photometric variability beyond the limiting systematic uncertainties, so it currently cannot be determined whether the EW variations are due to line-flux or continuum variability. These results are consistent with a typical damped random walk variability model for an AGN such as A2744-QSO1 (MBH = 4 × 10⁷ M⊙) given the sparse sampling of the light curve with the available data. Our results therefore support the AGN interpretation of this LRD, and highlight the need for further photometric and spectroscopic monitoring in order to build a detailed and reliable light curve.
Key words: gravitational lensing: strong / galaxies: high-redshift / quasars: emission lines / quasars: supermassive black holes / quasars: individual: A2744-QSO1
© The Authors 2025
 Open Access article, published by EDP Sciences, under the terms of the Creative Commons Attribution License (https://creativecommons.org/licenses/by/4.0), which permits unrestricted use, distribution, and reproduction in any medium, provided the original work is properly cited.
This article is published in open access under the Subscribe to Open model. This email address is being protected from spambots. You need JavaScript enabled to view it. to support open access publication.
1. Introduction
One of the most prominent results from the JWST (Gardner et al. 2023; McElwain et al. 2023) in its first few years of operations is the serendipitous discovery of a new population of extremely red point-sources at high redshifts (z ≳ 4), the so-called “little red dots” (LRDs; e.g., Matthee et al. 2024a). These were initially identified in JWST imaging data (e.g., Endsley et al. 2023; Labbé et al. 2023, 2025; Furtak et al. 2023a; Barro et al. 2024), with follow-up spectroscopy later revealing broad emission lines, consistent with heavily dust-attenuated (AV ≳ 3), broad-line type 1 active galactic nuclei (AGNs; e.g., Kocevski et al. 2023; Harikane et al. 2023; Matthee et al. 2024a; Furtak et al. 2024; Kokorev et al. 2023; Greene et al. 2024; Killi et al. 2024), although the picture has grown more complicated with time (e.g., Pérez-González et al. 2024; Baggen et al. 2024, 2025). Many LRD AGNs have been observed to date, down to z ∼ 2.5 (e.g., Wang et al. 2024a; Kocevski et al. 2024; Naidu et al. 2024), with the largest photometric samples encompassing several hundred objects selected in JWST’s blank fields (e.g., Kokorev et al. 2024; Kocevski et al. 2024). At z ≳ 4, LRDs seem to represent 20% to 30% of the AGN population (e.g., Kocevski et al. 2024) and tend to reside in over-densities (e.g., Schindler et al. 2024; Matthee et al. 2024b). If LRDs are indeed powered by an accreting black hole, they pose a challenge for black hole growth models as they present extreme black-hole-to-galaxy mass ratios, MBH/M⋆ ≳ 0.03 (e.g., Kokorev et al. 2023; Furtak et al. 2024; Durodola et al. 2024; Matthee et al. 2024b), which are not observed in the low-redshift Universe (though compare Lin et al. 2025; Euclid Collaboration: Bisigello et al. 2025).
Most LRDs are, however, extremely faint in X-rays (e.g., Ananna et al. 2024; Yue et al. 2024) or radio (Mazzolari et al. 2024; Perger et al. 2025; Gloudemans et al. 2025), and seem to lack a hot dust component in the mid-infrared (e.g., Williams et al. 2024; Akins et al. 2024; Setton et al. 2025). These features could be explained with, for example, Compton-thick broad-line regions (Maiolino et al. 2025), super-Eddington accretion (e.g. Pacucci & Narayan 2024; Lambrides et al. 2024; Inayoshi et al. 2024; Madau & Haardt 2024; Madau 2025; Tripodi et al. 2024), or seeds of primordial origin (e.g. Dayal 2024). However, they have also, in combination with the detection of distinct Balmer breaks in some LRDs (e.g. Wang et al. 2024b; Setton et al. 2024; Ma et al. 2025; Labbé et al. 2024), led to alternative models where their spectral energy distribution (SED) is dominated by stars (e.g. Pérez-González et al. 2024; Wang et al. 2024b). While the extreme stellar densities implied in such a picture could a priori help explain the observed broad lines (Baggen et al. 2024, 2025), such extreme densities are not otherwise observed in the Universe. On the other hand, the presence of a Balmer break does not necessarily contradict an AGN interpretation, as material around the black hole can in theory have physical conditions such that a significant fraction of the hydrogen atoms have their electrons in or above the second energy level (e.g. Laor & Davis 2011; Inayoshi & Maiolino 2025; Li et al. 2025; Ji et al. 2025; Naidu et al. 2025).
Since all type 1 AGNs vary temporally (e.g. Matthews & Sandage 1963; Kelly et al. 2009; MacLeod et al. 2012; Cammelli et al. 2025), variability could be a key discriminator between AGN and stellar-only models. Recent studies have therefore also looked for evidence of variability in LRDs (Kokubo & Harikane 2024; Zhang et al. 2024; Tee et al. 2025; Ji et al. 2025). The investigated samples show mostly no variability in several epochs of broadband photometry, both in the rest-frame ultraviolet (UV) and the optical (Kokubo & Harikane 2024; Zhang et al. 2024; Tee et al. 2025), with only a small subsample of LRDs displaying potential variability (Zhang et al. 2024). However, since JWST has only been operational for a little over two years, time-domain data are still sparse. Therefore, variability studies of LRDs so far are based on a select number of JWST epochs or rely on archival Hubble Space Telescope (HST) data (e.g. Tee et al. 2025), which only probe the faint rest-frame UV emission of LRDs.
In this work, we examine the variability of the multiply imaged LRD A2744-QSO1 (Furtak et al. 2023a, 2024), one of the first LRDs ever detected. It was first identified photometrically as a uniquely red-and-compact object in the Ultra-deep NIRSpec and NIRCam ObserVations before the Epoch of Reionization (UNCOVER; Bezanson et al. 2024) observations of the strong lensing (SL) cluster Abell 2744 (A2744; e.g. Abell et al. 1989; Merten et al. 2011) and then spectroscopically confirmed as a broad-line LRD at zspec = 7.0451 ± 0.0001 (Furtak et al. 2023a, 2024). Being multiply imaged, A2744-QSO1 is ideal for this type of study because SL induces a delay in the relative arrival time of each of the three images. This means that each visit effectively provides three epochs of observation, separated by several years. With two years of JWST imaging and spectroscopy of A2744-QSO1 available to date, we can investigate it for variability in its emission over a two-decade timescale (see Ji et al. (2025) for another recent analysis of variability in this object; we also compare our results with theirs in our discussion).
This letter is organized as follows. The data are described in Sect. 2. We then present our spectroscopic and photometric analyses in Sects. 3 and 4, respectively, and then discuss our results and their implications in Sect. 5. We assume a flat ΛCDM cosmology with H0 = 70 km s−1 Mpc−1, ΩΛ = 0.7, and Ωm = 0.3, and use AB magnitudes (Oke & Gunn 1983). Errors are typically 1σ unless stated otherwise.
2. Data
In the two years since the first JWST observations of UNCOVER, the center of A2744 was imaged numerous times with JWST. Here, we use the Grism redshift & line analysis software for space-based slitless spectroscopy (grizli; Brammer 2023a) to query the Mikulski Archive for Space Telescopes (MAST) for Near Infrared Camera (NIRCam; Rieke et al. 2023) imaging targeted at the cluster center, and to perform the data reduction. Each filter and epoch is drizzled into mosaics of 0.04″ per pixel. We list our six imaging epochs in Table 2. The NIRCam observations reduced here include data from programs 2756 (PI: W. Chen), 2561 (UNCOVER; PIs: I. Labbé & R. Bezanson; Bezanson et al. 2024), 2883 (Magnif; PI: F. Sun), 3538 (PI: E. Iani), 4111 (MegaScience; PI: K. Suess; Suess et al. 2024), and 3516 (All the Little Things; PIs: R. Naidu & J. Matthee; Naidu et al. 2024, ALT).
Our spectroscopic analysis is based on data from the UNCOVER program (Price et al. 2025), which also obtained ultra-deep Near Infrared Spectrograph (NIRSpec; Jakobsen et al. 2022; Böker et al. 2023) prism observations using the micro-shutter array (MSA; Ferruit et al. 2022; Jakobsen 2024) in July 2023. Due to a guide-star acquisition failure in the initial observations, a second epoch of prism spectra was taken in July 2024, which includes image A of A2744-QSO1 in the MSA. For this work, we utilized v4 reductions from the DAWN JWST Archive (DJA; Heintz et al. 2024; de Graaff et al. 2025a), which were reduced using the development version (v0.9.5) of MSAEXP (Brammer 2023b). We refer the reader to Price et al. (2025) for most of the details of the MSAEXP reduction and refer to Appendix B for more information. The primary improvement of the new reductions is a substantial extension of the wavelength coverage to include the full NIRSpec prism disperser throughput to cover wavelengths 0.6 μm < λ < 5.5 μm, achieving spectral resolutions of R ∼ 30 − 300. This has the advantage of fully covering the Hα line for our target on the red end of the detector (see Sect. 3). While several JWST grism spectroscopy programs targeted A2744 as well, namely GLASS-JWST (ID 1324; Treu et al. 2022), Magnif, and ALT, GLASS-JWST does not cover wavelength ranges with emission lines for our target, and Magnif only covers the Hγ line, which has too low a signal-to-noise ratio (S/N) to be exploited here. The ALT spectroscopy covers the Hβ line, but only shows marginal detections in two images and is therefore not usable for our variability studies.
Gravitational magnifications, μ, and time delays, Δtgrav, listed in Table 1, were computed analytically from the UNCOVER lens model v2, which was constructed by Furtak et al. (2023b) using a revised version of the Zitrin et al. (2015) parametric method and was recently updated with JWST/NIRSpec spectroscopic redshifts in Price et al. (2025). We assumed a floor of 20% uncertainty in the magnification to account for lensing systematics1 (e.g. Zitrin et al. 2015). While the time delays are also prone to the same systematics, we find these to be on the order of a few hundred days at most, which does not affect the search for variability conducted in this work.
Three images of A2744-QSO1 and their gravitational magnifications, μ, and time delays, Δt.
3. Spectroscopic analysis
With the UNCOVER JWST/NIRSpec spectra of the three images, and the repeat observation spectrum of image A (see Table 2), we effectively have four epochs of spectroscopy for A2744-QSO1, spanning rest-frame wavelengths from Lyman-α (Lyα) to Hα. The spectrum presents no other permitted (i.e., broad) emission lines other than the hydrogen Balmer series and Lyα (see e.g. Furtak et al. 2024). All four spectra are shown in Fig. 1, with a special focus on Hα and Hβ, which we investigate for variability because they have the most robust S/Ns. Thanks to the new spectroscopic reductions (see Sect. 2), Hα no longer falls off the detector as in our previous work on this object (Furtak et al. 2024, see also Ji et al. 2025), which enables us to probe the variability at a much higher S/N than with Hβ alone.
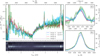 |
Fig. 1. JWST/NIRSpec prism spectroscopy from UNCOVER of all three images of A2744-QSO1 in both spectroscopic epochs (see Table 2). Image A is shown in blue (dark for epoch 7, light for epoch 8), image B in red and image C in green. Left: Full NIRSpec-prism spectra, normalized to the total luminosity of image A in epoch 7, obtained by integrating the spectra in wavelengths 1.0 μm < λobs < 5.4, μm. Thanks to the new reductions (see Sect. 2), the broad Hα line no longer falls off the detector as in previous work, but is seen entirely here for the first time. Right: Zoom-ins on the Hα (bottom) and Hβ (top) lines, scaled by their continua listed in Table 3, such that they become independent of magnification, similar to the EW. |
List of epochs of JWST observations available for A2744-QSO1 to date.
We measured the line fluxes by fitting spectra, as is explained in detail in Appendix B. The resulting integrated emission line fluxes, underlying continua, and rest-frame equivalent widths (EWs) are listed in Table 3 for each image and epoch. Unlike absolute line fluxes, the EWs are prone to neither lensing nor instrumental systematics (e.g. slit losses), which is why we use them as the primary and most robust indicators of variability (see also Ji et al. 2025). As can be seen in Fig. 2, both Hα and Hβ show a consistent variability in their EW over time2. More quantitatively, we note a drop in EW of 18 ± 3% in Hα and 22 ± 8% in Hβ between the times probed by image C and image A (in both its epochs). The absolute calibration of the red edge of the NIRSpec prism, where Hα is located, is uncertain (5 − 10%), but this should not impact the EW measurements directly. Finally, we do not find any variability in the broad line widths within the uncertainties.
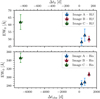 |
Fig. 2. Spectroscopic variability of A2744-QSO1 as a function of time, with image A shown in blue, image B in red, and image C in green as in Fig. 3. –Top: Hβ rest-frame EW, presenting a drop of 22 ± 8% between images C and A. –Bottom: Hα rest-frame EW, presenting a drop of 18 ± 3% in the time between images C and A. We note that the variability is consistent in both broad Balmer lines, as can be expected, since they both originate from the broad-line region of A2744-QSO1. The EWs represent excellent indicators of variability, since they are insensitive to most systematics such as lensing, slit losses, and calibration. |
Four data points do not, however, sufficiently sample the light curve to robustly characterize the spectroscopic variability of this source or to determine if the variations in the broad-line EWs arise from line-flux variations, continuum flux variations, or both. If driven by continuum variability, these EW variations would translate to |Δm|∼0.2 magnitudes – far below the uncertainty floor in our photometric analysis over the same timescale (Sect. 4) – and thus would not be detected. Our results nonetheless clearly show significant variability in A2744-QSO1, in particular given the high S/N in the Hα line, and confirm the results recently found by Ji et al. (2025) using Hβ alone. We take this as an indication that the broad lines in A2744-QSO1 indeed originate from an AGN. It is hard to imagine a systematic effect that would simultaneously affect the EWs of both lines.
4. Photometric analysis
We also investigates A2744-QSO1 for photometric variability. In Sect. 4.1 we present its photometric light curve, and then assess what level of variability can be expected with dedicated simulations in Sect. 4.2.
4.1. Observed photometric light curve
Since we are dealing with three perfect point-sources in all NIRCam bands (see Furtak et al. 2023a), we measured simple aperture photometry of the three images in all bands and epochs in a consistent way and list the fluxes in Table A.1. The details on the flux measurements can be found in Appendix A. In addition to the NIRCam photometry, we integrated the NIRSpec spectra in the NIRCam filter band-passes to gain four additional effective epochs of photometry in each band, also listed in Table A.1.
In Fig. 3 we show the photometric light curve of A2744-QSO1 in selected filters chosen to have at least one epoch in each of the November windows of 2022 and 2023, and thus bridging the one-year gap. The F115W, F200W, and F277W bands, which cover the rest-frame UV emission of our object, present small NIRCam flux variations that are fully consistent with the photometric systematics (see Fig. A.1). Likewise, we see no variability in rest-frame optical photometry for the three images taken alone (F356W, F410M, and F444W; Fig. A.1). We do find variations up to |Δm|∼0.4 magnitudes3 in the full light curve covering longer timescales (22 yr, i.e., 2.7 yr in the rest-frame).
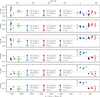 |
Fig. 3. De-magnified light curve of A2744-QSO1 in each photometric band with at least one epoch in both 2022 and 2023, as a function of time, incorporating the gravitational time delays, Δtgrav, given in Table 1. Image A is shown in blue, image B in red, and image C in green. Solid circles represent NIRCam (NC) data-points and solid triangles represent the synthetic photometry obtained by integrating the NIRSpec (NS) spectra in the broadband filter band-passes. The horizontal dashed line represents the mean, |

While the individual error bars on each point of photometry are very small, in particular in the optical bands, our measurement is dominated by systematics. The main sources of uncertainty in this case are the magnification errors, of 0.22 magnitudes (20%) chosen to represent the typical systematic uncertainties associated with SL mass modeling (see Sect. 2). Our measurement is furthermore prone to significant additional systematics of ∼0.05 − 0.3 magnitudes at the observed brightnesses of the images (see Fig. A.1), arising from varying depths, coverage, and observing strategy between the epochs. We also note that image B lies close to a cluster galaxy (see Furtak et al. 2023a), meaning that its photometry and background estimate might be contaminated.
Thus, the variations that we see in the photometry of A2744-QSO1 are at best marginal detections. The current data do not yield a robust measurement of photometric variability beyond the uncertainties, at least not with the current sampling of the light curve. Nonetheless, given the limited temporal sampling and the stochastic nature of AGN variability, this does not necessarily imply there to be no intrinsic variability in the source, as is discussed in Sect. 4.2.
4.2. Simulated light curves
In order to assess what can be expected in terms of broadband variability from an AGN like A2744-QSO1, we simulated 100 light curves using a damped random walk (DRW) model as in Kelly et al. (2009). The DRW has been shown to be a decent representation of quasar light curves for timescales of days to years (e.g., Kozłowski et al. 2010; MacLeod et al. 2010; Zu et al. 2013). It is a stochastic process that characterizes the variability power spectrum as a power law with exponent −2 at high frequencies and white noise at frequencies below a certain damping timescale τDRW. We used τDRW = 76 d, which corresponds to the damping timescale for an AGN with mass MBH = 4 × 10⁷ M⊙ (corresponding to A2744-QSO1; Furtak et al. 2024) as parameterized by Burke et al. (2021), and a structure function at infinity of SF∞ = 0.3, which is a typical value for Sloan Digital Sky Survey (SDSS) quasars (MacLeod et al. 2010). We then sampled each light curve at the relative (rest-frame) observation times of each epoch and image for the F115W band in the UV, and the three optical bands, F356W, F410M, and F444W, because they have the highest S/Ns. We added Gaussian noise to the mock observations scaled by the S/Ns of the observations.
The resulting distribution of |Δm| per mock light curve is shown in Fig. 4 for all three images combined. While we find the probability of observing a |Δm|> 0.3 magnitude event, in other words one slightly above the average uncertainties, to be of 56%, 67%, 53%, and 56% in the F115W, F356W, F410M, and F444W bands, respectively, the probability of observing a significant event, such as |Δm|> 0.5 magnitudes, is of only 6% (F115W), 17% (F356W), 15% (F410M), and 6% (F444W).
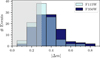 |
Fig. 4. Histogram of maximum variation, |Δm|, from 100 simulated DRW light curves of an MBH = 4 × 10⁷ M⊙ black hole, sampled at the rest-frame effective times of our combined observations of all three images of A2744-QSO1 as is shown in Fig. 3. Rest-frame UV (F115W) variations are shown in light blue and optical variations (F356W) are shown in dark blue. We chose to show the F356W band here because it has the most epochs (see Table A.1) and therefore has the highest probability of detecting a significant event. The gray-shaded area represents variations that are below the typical errors of 0.3 magnitudes (including systematics) in our photometry measurements in both bands. Even with the sampling of our full light curve, the probability of detecting a significant variation event (|Δm|> 0.5 magnitudes) is relatively low. |
We also broke up our mock light curves into the three separate images, which have two to five epochs each, in Fig. 5. The probability of a significant event in the F356W band, in other words |Δm|> 0.3 magnitudes given the dispersion between epochs at the observed brightness of each image shown in Fig. A.1, is < 13% and < 3% for a |Δm|> 0.5 magnitude event. In all other bands, the probability is < 6% for a |Δm|> 0.3 magnitude event, and a |Δm|> 0.5 magnitude event cannot be observed for any of the mock light curves in these filters. In our highest S/N band, F444W, a significant event in the individual images would be |Δm|> 0.2 in magnitude. Given our sampling of the light curve, the probabilities of detecting such an event there would, however, also only be 1 − 17%.
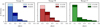 |
Fig. 5. Histogram of maximum variation, |Δm|, from our simulated light curves (see Fig. 4) in F115W (light) and F356W (dark), now sampled at the rest-frame observation times of each image individually. As in Fig. 4, we show the F356W band to represent the rest-frame optical because it has the most epochs. Image A is shown in blue, image B in red, and image C in green. The probabilities of observing a significant event are much lower for the individual images than when combining the images to a full light curve. |
The difference in the likelihood of detecting variability in the various wavebands depends only on the S/N of the observations and the specific observation times in each band. We find the likelihood of detecting variability is greatest for the F356W band because it has the largest number of observations. However, if we take the wavelength dependence of SF∞ from Burke et al. (2023) into account, the probability of detecting variability in the F356W band and the other optical wavebands decreases significantly. Finally, if we hold SF∞ constant, for MBH ≤ 106 M⊙, the probability of a significant excursion of |Δm| = 0.2 − 0.3 magnitudes for the F356W or F444W bands becomes ∼70 − 100%, making such low masses seem less likely for A2744-QSO1.
5. Discussion and conclusion
Our variability measurements in the multiply imaged LRD A2744-QSO1 come after several years of debate as to the nature of LRDs, which started when they were first identified photometrically (e.g., Labbé et al. 2023, 2025; Furtak et al. 2023a; Barro et al. 2024), and which has continued as more and more of the puzzling aspects of their SEDs have been revealed (e.g., Pérez-González et al. 2024; Ananna et al. 2024; Yue et al. 2024; Setton et al. 2024; Gloudemans et al. 2025). Because of the elusive nature of the LRDs’ SED (e.g., Setton et al. 2024; Labbé et al. 2024), at this stage we cannot predict which part of the SED – the optical or the UV continuum – can be expected to vary in the first place. The hardest components of the SED to explain with a purely stellar model are the broad emission lines – both their high luminosity and their width. And indeed, we do find these to vary consistently in Hα and Hβ, by 18 ± 3% and 22 ± 8%, respectively, as is shown in Sect. 3. Note that Ji et al. (2025) find a similar result for Hβ in the same source, which we here confirm via the higher-S/N Hα line. The current data, however, are insufficient to securely determine whether the EW variations are dominated by variations in the continuum, the line fluxes, or perhaps most probably – both. If dominated by continuum variation, our detection of broad-line EW variability in Sect. 3 would correspond to |Δm|∼0.2 magnitude excursions, which are below the limiting sensitivity of our photometric analysis in Sect. 4.1.
While the last year in particular saw several studies looking into photometric variability of LRDs, the vast majority of LRDs did not display significant variations over the select number of epochs considered (Kokubo & Harikane 2024; Zhang et al. 2024; Tee et al. 2025), similar to what we find for each image individually. Only eight out of several hundred investigated LRDs seem to present significant variability (Zhang et al. 2024). This could a priori indicate the LRD population at large to not necessarily be AGN, although it has also been claimed that, for example, super-Eddington accretion, could explain the lack of variability (e.g., Inayoshi et al. 2024). In the context of these non-detections in the literature, our photometric results do not come as a surprise. Even when combining the three images, and thus tripling the number of effective epochs to 11 − 14, we do not find any significant photometric variability, in other words large |Δm|> 0.5 magnitude excursions (see Sect. 4.1). This is nonetheless still consistent with the stochastic nature of AGN variability (e.g., Kelly et al. 2009; MacLeod et al. 2010), as we have shown in Sect. 4.2. Indeed, our DRW simulations show that even if there were intrinsic photometric variability in A2744-QSO1, the probability of detecting it with our sampling is low and nearly impossible in the small amount of epochs for each image separately. The lack of significant photometric variability in LRDs in the literature therefore cannot rule out intrinsic variability of LRDs, nor that they are AGNs. It merely means that with the data available so far, the light curves of LRDs are not sufficiently sampled to rule out expected levels of photometric variability.
Our detection of significant broad-line EW variability in the multiply imaged z = 7 LRD A2744-QSO1 presents strong evidence in support of the AGN interpretation of this object, and a varying AGN at that, even if we do not find significant photometric variability at this stage. At the time of writing, high-resolution JWST/NIRSpec spectroscopy of A2744-QSO1 has revealed strong narrow absorption features in the Balmer-lines (Ji et al. 2025; D’Eugenio et al. 2025), which further corroborate the scenario in which this object is dominated by an AGN, though of lower black-hole mass than previous estimates, with a nearly absent host galaxy (MBH/Mdyn > 0.02 − 0.4; D’Eugenio et al. 2025). Most recently, the detection of two peculiar LRD objects, with extreme Balmer breaks and a complete absence of metal lines as in A2477-QSO1 (Naidu et al. 2025; de Graaff et al. 2025b), has further shed light on the nature of LRDs: the extreme Balmer break, broad lines, and absorption features in said lines are consistent with emission from a supermassive black hole embedded in an extremely dense cocoon of hot gas, similar to a stellar atmosphere (e.g., Inayoshi & Maiolino 2025; Ji et al. 2025; Naidu et al. 2025), which in addition suppresses the radio and X-ray emission (e.g., Lambrides et al. 2024; Inayoshi et al. 2024; Maiolino et al. 2025; Rusakov et al. 2025). As is demonstrated in detail in Naidu et al. (2025), the combination of such a “black hole star” (BH*) with a (very weak) host galaxy, to make up the rest-frame UV emission, reproduces the observed spectrum of A2744-QSO1 quite well. This scenario also perfectly explains our simultaneous detection of broad-line EW variability, which come from the BH*, and non-detection of rest-frame UV variability, which would originate from young stars forming in the vicinity of the BH*.
Our results further show that robust investigations into the variability of LRDs, including A2744-QSO1, will require dedicated monitoring with numbers of epochs large enough to sample the light curve frequently and maximize the probability of detecting significant variation events. More importantly, we stress that such monitoring campaigns need to be consistent in depth, coverage, and observing strategy to minimize the systematics between single epochs. Thanks to the gravitational time delays, this source is ideally suited for further study of its variability and could make for a prime target for a large-scale reverberation mapping campaign in the future. With that, one could potentially measure the black-hole mass of an AGN at z = 7 directly and, for the first time, calibrate the scaling relations used to measure black-hole masses beyond the nearby Universe (e.g., Liu et al. 2024). Thanks to SL time delays, multiply imaged, cluster-lensed AGNs such as A2744-QSO1 may open a door to achieving this on a reasonable timescale out to high redshifts and high black-hole masses (e.g., Golubchik et al. 2024).
In practice the systematics estimated for these magnification values can reach ∼40% (Zitrin et al. 2015). However, the exact level does not affect the conclusions of this work.
Note, the  is defined here as the maximum difference to the mean across our entire light curve in each band (dashed horizontal lines in Fig. 3).
DR3, including the additional broad and medium bands from the MegaScience program (Suess et al. 2024): https://jwst-uncover.github.io/#releases.
Acknowledgments
We would like to thank Xihan Ji, Hannah Übler, and Roberto Maiolino, for cordial and useful discussions. The BGU lensing group acknowledges support by grant No. 2020750 from the United States-Israel Binational Science Foundation (BSF) and grant No. 2109066 from the United States National Science Foundation (NSF), and by the Israel Science Foundation Grant No. 864/23. P.D. warmly thanks the European Commission’s and University of Groningen’s CO-FUND Rosalind Franklin program. This work is based on observations obtained with the NASA/ESA/CSA JWST, namely programs GO-2756, -2561, -2883, -3538, -4111, and -3516, retrieved from the Mikulski Archive for Space Telescopes (MAST) at the Space Telescope Science Institute (STScI). STScI is operated by the Association of Universities for Research in Astronomy, Inc. under NASA contract NAS 5-26555. The spectroscopy products presented herein, from JWST program GO-2561, were retrieved from the Dawn JWST Archive (DJA). DJA is an initiative of the Cosmic Dawn Center (DAWN), which is funded by the Danish National Research Foundation under grant DNRF140. The data used in this work may be retrieved from the MAST archive at: http://dx.doi.org/10.17909/p7t7-te67. This work also makes use of the Center for Computational Astrophysics at the Flatiron Institute which is supported by the Simons Foundation. Support for JWST programs GO-2561, -4111, and -3516 was provided by NASA through grants from STScI. This research made use of Astropy, (http://www.astropy.org) a community-developed core Python package for Astronomy (Astropy Collaboration 2013, 2018) and Photutils, an Astropy package for detection and photometry of astronomical sources (Bradley et al. 2024), as well as the packages NumPy (van der Walt et al. 2011), SciPy (Virtanen et al. 2020), Matplotlib (Hunter 2007), and the MAAT Astronomy and Astrophysics tools for MATLAB (Ofek 2014).
References
- Abell, G. O., Corwin, H. G., Jr, & Olowin, R. P. 1989, ApJS, 70, 1 [Google Scholar]
- Akins, H. B., Casey, C. M., Lambrides, E., et al. 2024, arXiv e-prints [arXiv:2406.10341] [Google Scholar]
- Ananna, T. T., Bogdán, Á., Kovács, O. E., Natarajan, P., & Hickox, R. C. 2024, ApJ, 969, L18 [NASA ADS] [CrossRef] [Google Scholar]
- Astropy Collaboration (Robitaille, T. P., et al.) 2013, A&A, 558, A33 [NASA ADS] [CrossRef] [EDP Sciences] [Google Scholar]
- Astropy Collaboration (Price-Whelan, A. M., et al.) 2018, AJ, 156, 123 [Google Scholar]
- Baggen, J. F. W., van Dokkum, P., Brammer, G., et al. 2024, ApJ, 977, L13 [NASA ADS] [CrossRef] [Google Scholar]
- Baggen, J. F. W., van Dokkum, P., Brammer, G., et al. 2025, ApJ, 980, L47 [Google Scholar]
- Barro, G., Pérez-González, P. G., Kocevski, D. D., et al. 2024, ApJ, 963, 128 [CrossRef] [Google Scholar]
- Bezanson, R., Labbe, I., Whitaker, K. E., et al. 2024, ApJ, 974, 92 [NASA ADS] [CrossRef] [Google Scholar]
- Böker, T., Beck, T. L., Birkmann, S. M., et al. 2023, PASP, 135, 038001 [CrossRef] [Google Scholar]
- Bradley, L., Sipőcz, B., Robitaille, T., et al. 2024, https://doi.org/10.5281/zenodo.12585239 [Google Scholar]
- Brammer, G. 2023a, https://doi.org/10.5281/zenodo.8370018 [Google Scholar]
- Brammer, G. 2023b, https://doi.org/10.5281/zenodo.8319596 [Google Scholar]
- Buchner, J., Georgakakis, A., Nandra, K., et al. 2014, A&A, 564, A125 [NASA ADS] [CrossRef] [EDP Sciences] [Google Scholar]
- Burke, C. J., Shen, Y., Blaes, O., et al. 2021, Science, 373, 789 [NASA ADS] [CrossRef] [Google Scholar]
- Burke, C. J., Shen, Y., Liu, X., et al. 2023, MNRAS, 518, 1880 [Google Scholar]
- Cammelli, V., Tan, J. C., Young, A. R., et al. 2025, arXiv e-prints [arXiv:2501.17675] [Google Scholar]
- Dayal, P. 2024, A&A, 690, A182 [NASA ADS] [CrossRef] [EDP Sciences] [Google Scholar]
- de Graaff, A., Rix, H.-W., Carniani, S., et al. 2024, A&A, 684, A87 [NASA ADS] [CrossRef] [EDP Sciences] [Google Scholar]
- de Graaff, A., Brammer, G., Weibel, A., et al. 2025a, A&A, 697, A189 [NASA ADS] [CrossRef] [EDP Sciences] [Google Scholar]
- de Graaff, A., Rix, H.-W., Naidu, R. P., et al. 2025b, A&A, submitted [arXiv:2503.16600] [Google Scholar]
- D’Eugenio, F., Maiolino, R., Perna, M., et al. 2025, arXiv e-prints [arXiv:2503.11752] [Google Scholar]
- Durodola, E., Pacucci, F., & Hickox, R. C. 2024, arXiv e-prints [arXiv:2406.10329] [Google Scholar]
- Endsley, R., Stark, D. P., Whitler, L., et al. 2023, MNRAS, 524, 2312 [NASA ADS] [CrossRef] [Google Scholar]
- Euclid Collaboration (Bisigello, L., et al.) 2025, A&A, submitted [arXiv:2503.15323] [Google Scholar]
- Ferruit, P., Jakobsen, P., Giardino, G., et al. 2022, A&A, 661, A81 [NASA ADS] [CrossRef] [EDP Sciences] [Google Scholar]
- Furtak, L. J., Zitrin, A., Plat, A., et al. 2023a, ApJ, 952, 142 [NASA ADS] [CrossRef] [Google Scholar]
- Furtak, L. J., Zitrin, A., Weaver, J. R., et al. 2023b, MNRAS, 523, 4568 [NASA ADS] [CrossRef] [Google Scholar]
- Furtak, L. J., Labbé, I., Zitrin, A., et al. 2024, Nature, 628, 57 [NASA ADS] [CrossRef] [Google Scholar]
- Gardner, J. P., Mather, J. C., Abbott, R., & Zondag, E. 2023, PASP, 135, 068001 [CrossRef] [Google Scholar]
- Gloudemans, A. J., Duncan, K. J., Eilers, A. C., et al. 2025, arXiv e-prints [arXiv:2501.04912] [Google Scholar]
- Golubchik, M., Steinhardt, C. L., Zitrin, A., et al. 2024, ApJ, 976, 108 [Google Scholar]
- Greene, J. E., Labbé, I., Goulding, A. D., et al. 2024, ApJ, 964, 39 [CrossRef] [Google Scholar]
- Harikane, Y., Zhang, Y., Nakajima, K., et al. 2023, ApJ, 959, 39 [NASA ADS] [CrossRef] [Google Scholar]
- Heintz, K. E., Watson, D., Brammer, G., et al. 2024, Science, 384, 890 [NASA ADS] [CrossRef] [Google Scholar]
- Hunter, J. D. 2007, Comput. Sci. Eng., 9, 90 [NASA ADS] [CrossRef] [Google Scholar]
- Inayoshi, K., & Maiolino, R. 2025, ApJ, 980, L27 [Google Scholar]
- Inayoshi, K., Kimura, S., & Noda, H. 2024, arXiv e-prints [arXiv:2412.03653] [Google Scholar]
- Jakobsen, P. 2024, arXiv e-prints [arXiv:2405.04530] [Google Scholar]
- Jakobsen, P., Ferruit, P., Alves de Oliveira, C., et al. 2022, A&A, 661, A80 [NASA ADS] [CrossRef] [EDP Sciences] [Google Scholar]
- Ji, X., Maiolino, R., Übler, H., et al. 2025, arXiv e-prints [arXiv:2501.13082] [Google Scholar]
- Kelly, B. C., Bechtold, J., & Siemiginowska, A. 2009, ApJ, 698, 895 [Google Scholar]
- Killi, M., Watson, D., Brammer, G., et al. 2024, A&A, 691, A52 [NASA ADS] [CrossRef] [EDP Sciences] [Google Scholar]
- Kocevski, D. D., Onoue, M., Inayoshi, K., et al. 2023, ApJ, 954, L4 [NASA ADS] [CrossRef] [Google Scholar]
- Kocevski, D. D., Finkelstein, S.L., Barro, G., et al. 2024, arXiv e-prints [arXiv:2404.03576] [Google Scholar]
- Kokorev, V., Fujimoto, S., Labbé, I., et al. 2023, ApJ, 957, L7 [NASA ADS] [CrossRef] [Google Scholar]
- Kokorev, V., Caputi, K. I., Greene, J. E., et al. 2024, ApJ, 968, 38 [NASA ADS] [CrossRef] [Google Scholar]
- Kokubo, M., & Harikane, Y. 2024, arXiv e-prints [arXiv:2407.04777] [Google Scholar]
- Kozłowski, S., Kochanek, C. S., Udalski, A., et al. 2010, ApJ, 708, 927 [CrossRef] [Google Scholar]
- Labbé, I., van Dokkum, P., Nelson, E., et al. 2023, Nature, 616, 266 [CrossRef] [Google Scholar]
- Labbé, I., Greene, J. E., Matthee, J., et al. 2024, arXiv e-prints [arXiv:2412.04557] [Google Scholar]
- Labbé, I., Greene, J. E., Bezanson, R., et al. 2025, ApJ, 978, 92 [NASA ADS] [CrossRef] [Google Scholar]
- Lambrides, E., Garofali, K., Larson, R., et al. 2024, arXiv e-prints [arXiv:2409.13047] [Google Scholar]
- Laor, A., & Davis, S. W. 2011, MNRAS, 417, 681 [NASA ADS] [CrossRef] [Google Scholar]
- Li, Z., Inayoshi, K., Chen, K., Ichikawa, K., & Ho, L. C. 2025, ApJ, 980, 36 [Google Scholar]
- Lin, R., Zheng, Z.-Y., Jiang, C., et al. 2025, ApJ, 980, L34 [Google Scholar]
- Liu, T., Edelson, R., Hernández Santisteban, J. V., et al. 2024, ApJ, 964, 167 [NASA ADS] [CrossRef] [Google Scholar]
- Ma, Y., Greene, J. E., Setton, D. J., et al. 2025, ApJ, 981, 191 [Google Scholar]
- MacLeod, C. L., Ivezić, Ž., Kochanek, C. S., et al. 2010, ApJ, 721, 1014 [Google Scholar]
- MacLeod, C. L., Ivezić, Ž., Sesar, B., et al. 2012, ApJ, 753, 106 [NASA ADS] [CrossRef] [Google Scholar]
- Madau, P. 2025, arXiv e-prints [arXiv:2501.09854] [Google Scholar]
- Madau, P., & Haardt, F. 2024, ApJ, 976, L24 [Google Scholar]
- Maiolino, R., Risaliti, G., Signorini, M., et al. 2025, MNRAS, 538, 1921 [Google Scholar]
- Matthee, J., Naidu, R. P., Brammer, G., et al. 2024a, ApJ, 963, 129 [NASA ADS] [CrossRef] [Google Scholar]
- Matthee, J., Naidu, R. P., Kotiwale, G., et al. 2024b, arXiv e-prints [arXiv:2412.02846] [Google Scholar]
- Matthews, T. A., & Sandage, A. R. 1963, ApJ, 138, 30 [CrossRef] [Google Scholar]
- Mazzolari, G., Gilli, R., Maiolino, R., et al. 2024, A&A, submitted [arXiv:2412.04224] [Google Scholar]
- McElwain, M. W., Feinberg, L. D., Perrin, M. D., et al. 2023, PASP, 135, 058001 [NASA ADS] [CrossRef] [Google Scholar]
- Merten, J., Coe, D., Dupke, R., et al. 2011, MNRAS, 417, 333 [NASA ADS] [CrossRef] [Google Scholar]
- Naidu, R. P., Matthee, J., Kramarenko, I., et al. 2024, arXiv e-prints [arXiv:2410.01874] [Google Scholar]
- Naidu, R. P., Matthee, J., Katz, H., et al. 2025, arXiv e-prints [arXiv:2503.16596] [Google Scholar]
- Ofek, E. O. 2014, MAAT: MATLAB Astronomy and Astrophysics Toolbox, Astrophysics Source Code Library [record ascl:1407.005] [Google Scholar]
- Oke, J. B., & Gunn, J. E. 1983, ApJ, 266, 713 [NASA ADS] [CrossRef] [Google Scholar]
- Pacucci, F., & Narayan, R. 2024, ApJ, 976, 96 [NASA ADS] [CrossRef] [Google Scholar]
- Pérez-González, P. G., Barro, G., Rieke, G. H., et al. 2024, ApJ, 968, 4 [CrossRef] [Google Scholar]
- Perger, K., Fogasy, J., Frey, S., & Gabányi, K. É. 2025, A&A, 693, L2 [NASA ADS] [CrossRef] [EDP Sciences] [Google Scholar]
- Price, S. H., Bezanson, R., Labbe, I., et al. 2025, ApJ, 982, 51 [Google Scholar]
- Rieke, M. J., Kelly, D. M., Misselt, K., et al. 2023, PASP, 135, 028001 [CrossRef] [Google Scholar]
- Rusakov, V., Watson, D., Nikopoulos, G. P., et al. 2025, arXiv e-prints [arXiv:2503.16595] [Google Scholar]
- Schindler, J. T., Hennawi, J. F., Davies, F. B., et al. 2024, arXiv e-prints [arXiv:2411.11534] [Google Scholar]
- Setton, D. J., Greene, J. E., de Graaff, A., et al. 2024, arXiv e-prints [arXiv:2411.03424] [Google Scholar]
- Setton, D. J., Greene, J. E., Spilker, J. S., et al. 2025, arXiv e-prints [arXiv:2503.02059] [Google Scholar]
- Suess, K. A., Weaver, J. R., Price, S. H., et al. 2024, ApJ, 976, 101 [Google Scholar]
- Tee, W. L., Fan, X., Wang, F., & Yang, J. 2025, ApJ, 983, L26 [Google Scholar]
- Treu, T., Roberts-Borsani, G., Bradac, M., et al. 2022, ApJ, 935, 110 [NASA ADS] [CrossRef] [Google Scholar]
- Tripodi, R., Martis, N., Markov, V., et al. 2024, arXiv e-prints [arXiv:2412.04983] [Google Scholar]
- van der Walt, S., Colbert, S. C., & Varoquaux, G. 2011, Comput. Sci. Eng., 13, 22 [Google Scholar]
- Virtanen, P., Gommers, R., Oliphant, T. E., et al. 2020, Nat. Methods, 17, 261 [Google Scholar]
- Wang, B., de Graaff, A., Davies, R. L., et al. 2024a, arXiv e-prints [arXiv:2403.02304] [Google Scholar]
- Wang, B., Leja, J., de Graaff, A., et al. 2024b, ApJ, 969, L13 [NASA ADS] [CrossRef] [Google Scholar]
- Weaver, J. R., Cutler, S. E., Pan, R., et al. 2024, ApJS, 270, 7 [NASA ADS] [CrossRef] [Google Scholar]
- Williams, C. C., Alberts, S., Ji, Z., et al. 2024, ApJ, 968, 34 [NASA ADS] [CrossRef] [Google Scholar]
- Yue, M., Eilers, A.-C., Ananna, T. T., et al. 2024, ApJ, 974, L26 [CrossRef] [Google Scholar]
- Zhang, Z., Jiang, L., Liu, W., & Ho, L. C. 2024, arXiv e-prints [arXiv:2411.02729] [Google Scholar]
- Zitrin, A., Fabris, A., Merten, J., et al. 2015, ApJ, 801, 44 [Google Scholar]
- Zu, Y., Kochanek, C. S., Kozłowski, S., & Udalski, A. 2013, ApJ, 765, 106 [NASA ADS] [CrossRef] [Google Scholar]
Appendix A: Photometric measurements and systematic uncertainties
De-magnified photometry of A2744-QSO1 used in section 4 to investigate the source’s variability.
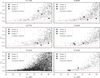 |
Fig. A.1. Systematic dispersion (standard deviation) σm across all epochs of NIRCam imaging as a function of observed magnitude for each band used in our analysis in section 4. The black dots represent compact (z < 0.4″) sources selected from the Weaver et al. (2024) UNCOVER catalog, chosen to be covered by each epoch. Image A is shown in blue, image B in red, and image C in green. A2744-QSO1 does not present photometric variability beyond the typical dispersion of objects in the catalog objects across all epochs. |
In order to have consistent photometry measurements across all three images and all epochs, we measure photometry in fixed circular apertures of 0.16″ radius with photutils (v1.13.0 Bradley et al. 2024) in all epochs and bands, without re-centering the aperture between measurements. The latter ensures a more robust sampling of the error-space. The background is measured as the sigma-clipped median in circular annulii of inner and outer radii 0.4″ and 0.7″ and is subtracted from the flux measurement. Both the measurement aperture and the background annulus are carefully chosen to avoid any possible contamination in all three images. Note that since all three images are point-sources in all NIRCam bands (see Furtak et al. 2023a), our measurements are agnostic to differential magnification. In Tab. A.1, we list the fluxes of each image in each filter and epoch used in section 4. While F070W and F090W observations are also available from, for example, MegaScience (Suess et al. 2024) and ALT (Naidu et al. 2024), the object is not detected in these bands due to its Lyman-break and we therefore do not consider them further here. The fluxes are de-magnified with the nominal magnification factors listed in Tab. 1, but without propagating the magnification uncertainties and other systematics. We however estimate our measurements to be dominated by significant systematics from lensing and between the multiple epochs as discussed in section 4 and in the following. We also integrate the NIRSpec spectra in the NIRCam band-passes for extra epochs of photometry as mentioned in section 4. The resulting flux values are also listed in Tab. A.1.
Since our epochs of observation comprise JWST/NIRCam imaging data from several different programs (see Tab. 2 and section 2), which were all targeted at different science cases and therefore have vastly differing coverages in area and filters, depths, and observing strategies, our photometric light curves are prone to significant systematics, in addition to the magnification uncertainties, that are not taken into account in the flux uncertainties listed in Tab. A.1. In an attempt to quantify these systematics, we use the public UNCOVER photometric catalog4 by Weaver et al. (2024) to select compact sources (a < 0.4″) in the A2744-field with magnitudes 20 < m < 29.5. This selection is further re-fined with the use_phot and flag_nearbcg flags (see Weaver et al. 2024). With a catalog of reference objects in hand, we cross-match their positions with the footprints of the data per band and epoch and keep only objects that are observed in every epoch in each band. We then compute the dispersion (standard deviation) in magnitude σm across all epochs in each filter for each object as a quantification of the systematics between epochs. These are shown as a function of magnitude in Fig. A.1 for the six filters used in our analysis in section 4, alongside the same dispersion measurement for the three images of A2744-QSO1. As can be seen in the figure, the systematics between epochs are larger than any expected photometric variations in the three rest-frame UV bands according to the simulations that we conducted in section 5. In the optical bands, the systematics are somewhat lower for our source because it has much higher S/Ns in those filters, but still of similar order as typically expected variations. None of the individual images show any variation above the systematic floor at its observed magnitude, which is consistent with what could be expected for DRW AGN variability (again see section 5). This shows that a robust investigation of the photometric variability of A2744-QSO1, and LRDs in general, requires a dedicated monitoring program with consistent depths and observing strategies to minimize these systematics.
Appendix B: Spectroscopic measurements
For spectroscopy, we use the latest reductions of the UNCOVER spectroscopic data (Price et al. 2025) available from the DJA (Heintz et al. 2024; de Graaff et al. 2025a). The spectra are reduced with MSAEXPv0.9.5 and reach 5.5 μm, fully covering Hα at z = 7.04. The spectra of images A and B have typical S/N = 15 − 20 per pixel in the continuum, while the spectrum of images C, and A in epoch 8, have S/N = 8 − 10. In addition to the uncertainties provided by MSAEXP, we adopt a systematic error floor of 3% per pixel in the continuum and 6% per pixel at the location of strong lines. These errors are added in quadrature before fitting the spectra to account for spectro-photometric calibration uncertainties and other uncertainties related to the detailed shape of the intrinsic lines and the NIRSpec line-spread-function (LSF). The spectra are modeled over an observed wavelength-range λ = 3.1 − 5.4 μm, in other words redward of the red-shifted Balmer break, as we are here primarily interested in a robust measurement of the strongest Balmer lines and the continuum at the location of said lines.
The model fit to the spectra consists of the following components: The continuum is modeled with a power-law slope, β, convolved with an exponential dust law with index −0.7 and 0 < AV < 6. This simple model reproduces the curvature of the continuum well over the considered wavelength range, better than a power law of variable slope. Note that fitting with the latter only changes the results of Hα and Hβ by < 1.5%. The Hβ line is modeled with a single broad-line Gaussian profile since the spectral resolution at the observed wavelength (R ∼ 320) is not sufficient to resolve the narrow component, as was already shown in Furtak et al. (2024). Hα on the other hand has both a higher S/N and a higher spectral resolution. It is therefore more complicated, requiring a broad-line and a narrow-line component, even at the JWST/NIRSpec prism resolution (effectively R > 500 at 5 μm for point sources, see de Graaff et al. 2024). Fainter lines adjacent to Hβ (the [O III]λλ4959, 5007Å-doublet, He IIλ4686Å, and Hγ) are masked. The [N II]λλ6548, 6583Å-doublet is undetectable and including it in the fit changes the Hα by < 1%, which is why we omit it. The model is convolved with the wavelength-dependent NIRSpec prism LSF for a point-source (de Graaff et al. 2024). Finally, we include two nuisance parameters: One is a rescaling of the resolution of the spectrum by a factor lsf_scale = 1.0 − 2.0 with a uniform prior, reflecting uncertainty in the JWST/NIRSpec LSF. A value of 1.0 is appropriate for uniformly exposed shutters and 1.8 − 2.0 may be appropriate for point sources (de Graaff et al. 2024). The second nuisance parameter is noise_scale = 0.1 − 10 with a logarithmic prior, reflecting a possible over- or underestimate of the noise in the fit. We list all free parameters and their priors in Tab. B.1. The posterior distributions are then sampled with PyMultiNest (Buchner et al. 2014).
First, we fit the spectrum of image A (epoch 7), which has the highest S/N, with the broad- and narrow-line widths as free parameters, finding FWHMbroad = 2533 ± 120 km/s for both broad lines, FWHMnarrow = 800 ± 60 km/s, and lsf_scale = 1.51. In the subsequent fitting of the spectra of images B, C, and A (epoch 8), we fix the line widths and LSF scaling to the values of image A to ensure consistency. Typical values of noise_scale are noise_scale = 1.0 − 1.15, indicating that the errors in the spectrum were only slightly underestimated. Finally, from the best-fit model posterior samples, we determine for Hα and Hβ the continuum at the line center, the total line flux, and the EW, taking into account parameter correlations. For Hα, we sum the narrow and broad components as they are difficult to separate reliably. Basic convergence tests were done (live points, sampling efficiency), showing the measurements were robust. The resulting continuum fluxes, integrated line fluxes and EWs are listed in Tab. 3 in section 3.
Free parameters of our spectral fit with their priors.
All Tables
Three images of A2744-QSO1 and their gravitational magnifications, μ, and time delays, Δt.
De-magnified photometry of A2744-QSO1 used in section 4 to investigate the source’s variability.
All Figures
|
Fig. 1. JWST/NIRSpec prism spectroscopy from UNCOVER of all three images of A2744-QSO1 in both spectroscopic epochs (see Table 2). Image A is shown in blue (dark for epoch 7, light for epoch 8), image B in red and image C in green. Left: Full NIRSpec-prism spectra, normalized to the total luminosity of image A in epoch 7, obtained by integrating the spectra in wavelengths 1.0 μm < λobs < 5.4, μm. Thanks to the new reductions (see Sect. 2), the broad Hα line no longer falls off the detector as in previous work, but is seen entirely here for the first time. Right: Zoom-ins on the Hα (bottom) and Hβ (top) lines, scaled by their continua listed in Table 3, such that they become independent of magnification, similar to the EW. |
| In the text | |
|
Fig. 2. Spectroscopic variability of A2744-QSO1 as a function of time, with image A shown in blue, image B in red, and image C in green as in Fig. 3. –Top: Hβ rest-frame EW, presenting a drop of 22 ± 8% between images C and A. –Bottom: Hα rest-frame EW, presenting a drop of 18 ± 3% in the time between images C and A. We note that the variability is consistent in both broad Balmer lines, as can be expected, since they both originate from the broad-line region of A2744-QSO1. The EWs represent excellent indicators of variability, since they are insensitive to most systematics such as lensing, slit losses, and calibration. |
| In the text | |
|
Fig. 3. De-magnified light curve of A2744-QSO1 in each photometric band with at least one epoch in both 2022 and 2023, as a function of time, incorporating the gravitational time delays, Δtgrav, given in Table 1. Image A is shown in blue, image B in red, and image C in green. Solid circles represent NIRCam (NC) data-points and solid triangles represent the synthetic photometry obtained by integrating the NIRSpec (NS) spectra in the broadband filter band-passes. The horizontal dashed line represents the mean, |
| In the text | |
|
Fig. 4. Histogram of maximum variation, |Δm|, from 100 simulated DRW light curves of an MBH = 4 × 10⁷ M⊙ black hole, sampled at the rest-frame effective times of our combined observations of all three images of A2744-QSO1 as is shown in Fig. 3. Rest-frame UV (F115W) variations are shown in light blue and optical variations (F356W) are shown in dark blue. We chose to show the F356W band here because it has the most epochs (see Table A.1) and therefore has the highest probability of detecting a significant event. The gray-shaded area represents variations that are below the typical errors of 0.3 magnitudes (including systematics) in our photometry measurements in both bands. Even with the sampling of our full light curve, the probability of detecting a significant variation event (|Δm|> 0.5 magnitudes) is relatively low. |
| In the text | |
|
Fig. 5. Histogram of maximum variation, |Δm|, from our simulated light curves (see Fig. 4) in F115W (light) and F356W (dark), now sampled at the rest-frame observation times of each image individually. As in Fig. 4, we show the F356W band to represent the rest-frame optical because it has the most epochs. Image A is shown in blue, image B in red, and image C in green. The probabilities of observing a significant event are much lower for the individual images than when combining the images to a full light curve. |
| In the text | |
|
Fig. A.1. Systematic dispersion (standard deviation) σm across all epochs of NIRCam imaging as a function of observed magnitude for each band used in our analysis in section 4. The black dots represent compact (z < 0.4″) sources selected from the Weaver et al. (2024) UNCOVER catalog, chosen to be covered by each epoch. Image A is shown in blue, image B in red, and image C in green. A2744-QSO1 does not present photometric variability beyond the typical dispersion of objects in the catalog objects across all epochs. |
| In the text | |
Current usage metrics show cumulative count of Article Views (full-text article views including HTML views, PDF and ePub downloads, according to the available data) and Abstracts Views on Vision4Press platform.
Data correspond to usage on the plateform after 2015. The current usage metrics is available 48-96 hours after online publication and is updated daily on week days.
Initial download of the metrics may take a while.