Fig. 3.
Download original image
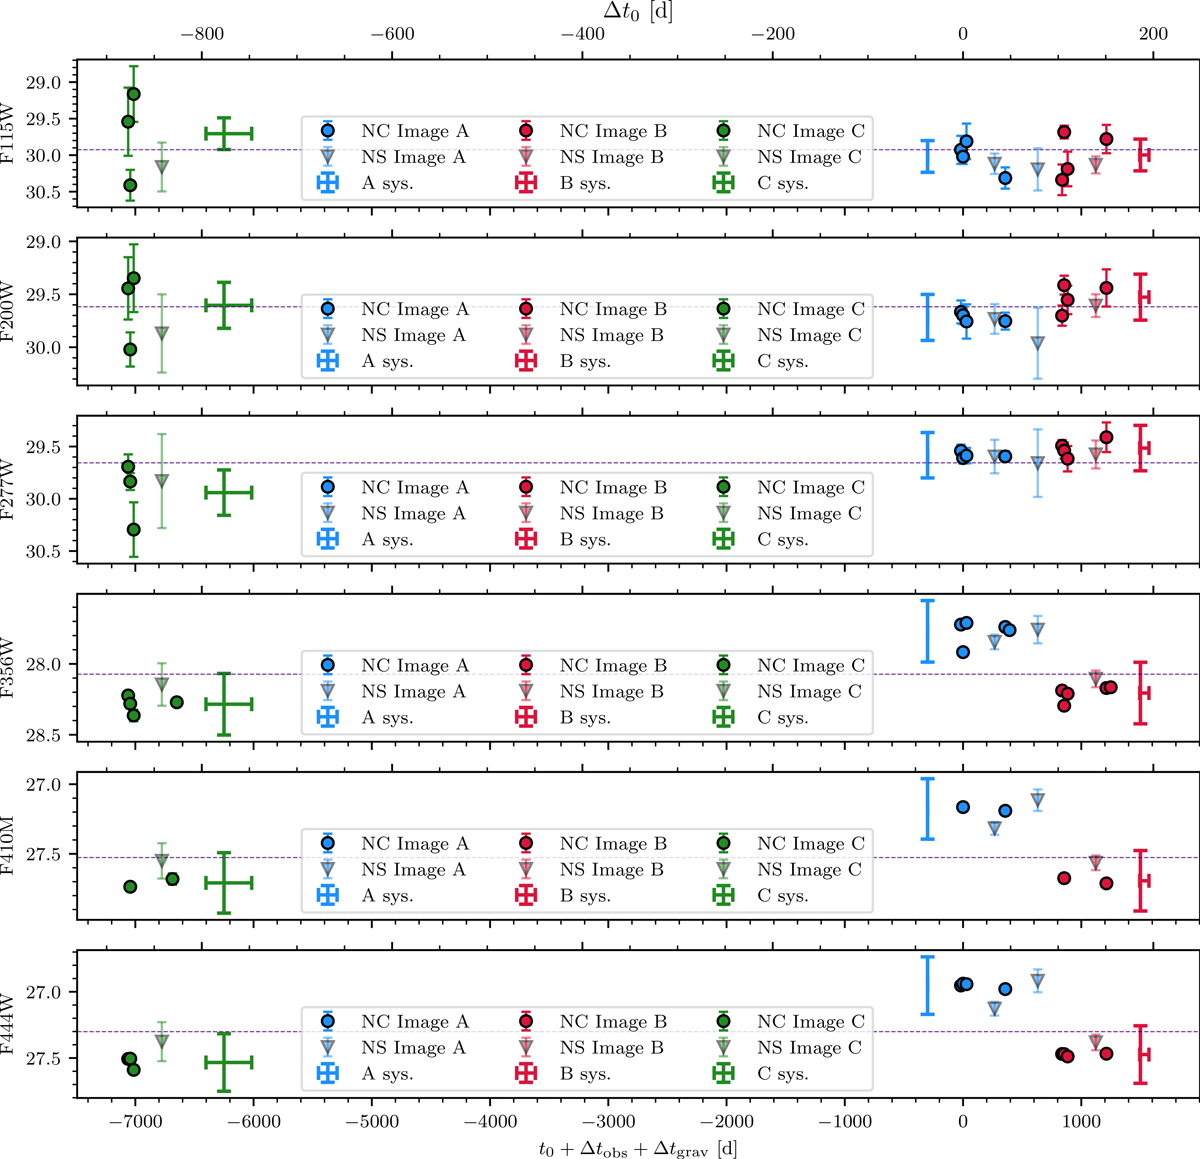
De-magnified light curve of A2744-QSO1 in each photometric band with at least one epoch in both 2022 and 2023, as a function of time, incorporating the gravitational time delays, Δtgrav, given in Table 1. Image A is shown in blue, image B in red, and image C in green. Solid circles represent NIRCam (NC) data-points and solid triangles represent the synthetic photometry obtained by integrating the NIRSpec (NS) spectra in the broadband filter band-passes. The horizontal dashed line represents the mean, ![]() , from which variations, |Δm|, are calculated in each band. Note that the magnification uncertainties are not propagated into the photometry here, since for each image the magnification remains constant and is only relevant when comparing to the other images. Instead, the colored crosses indicate the level of SL (magnification and time-delay) systematics for each image. We also note that image B lies close to a cluster galaxy, which might contaminate its photometry.
, from which variations, |Δm|, are calculated in each band. Note that the magnification uncertainties are not propagated into the photometry here, since for each image the magnification remains constant and is only relevant when comparing to the other images. Instead, the colored crosses indicate the level of SL (magnification and time-delay) systematics for each image. We also note that image B lies close to a cluster galaxy, which might contaminate its photometry.
Current usage metrics show cumulative count of Article Views (full-text article views including HTML views, PDF and ePub downloads, according to the available data) and Abstracts Views on Vision4Press platform.
Data correspond to usage on the plateform after 2015. The current usage metrics is available 48-96 hours after online publication and is updated daily on week days.
Initial download of the metrics may take a while.