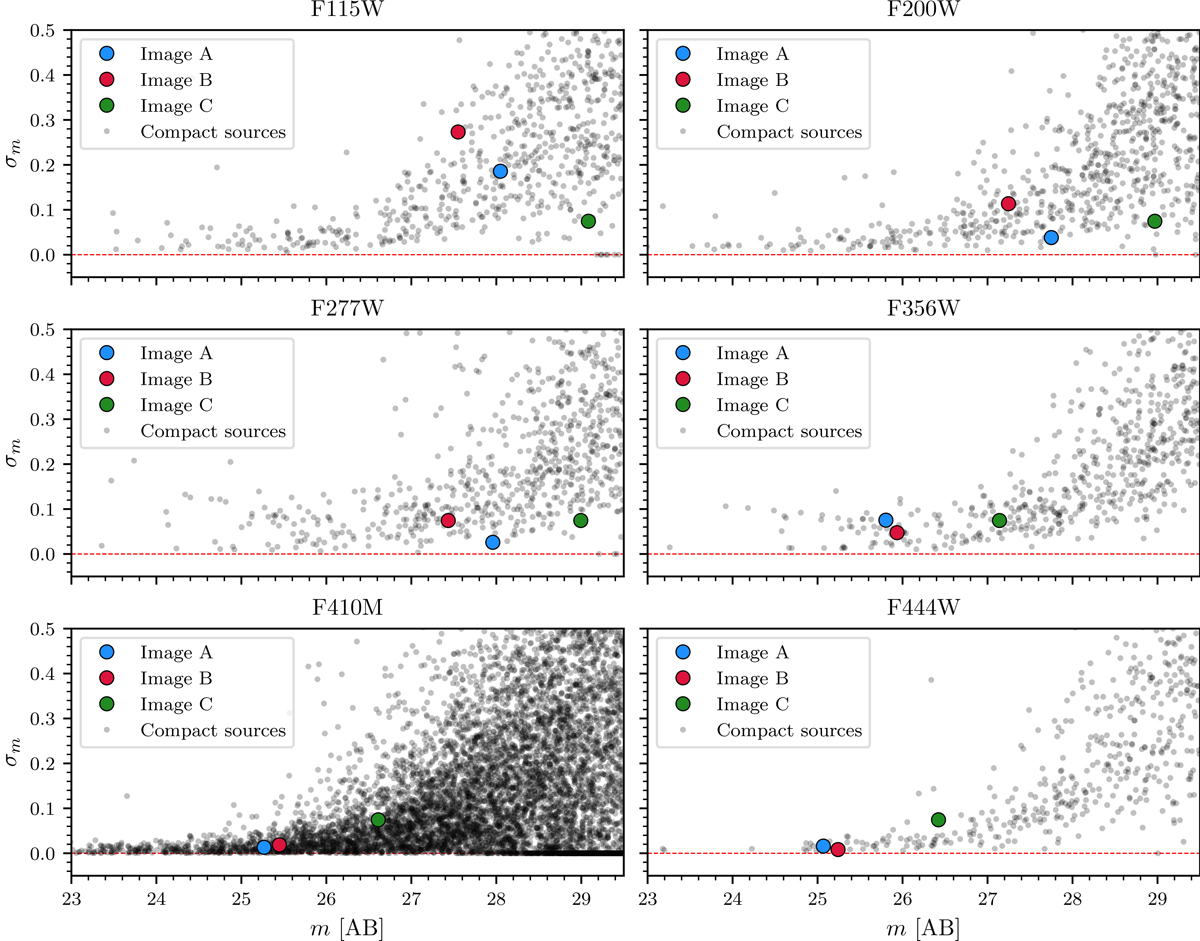
Fig. A.1.
Download original image
Systematic dispersion (standard deviation) σm across all epochs of NIRCam imaging as a function of observed magnitude for each band used in our analysis in section 4. The black dots represent compact (z < 0.4″) sources selected from the Weaver et al. (2024) UNCOVER catalog, chosen to be covered by each epoch. Image A is shown in blue, image B in red, and image C in green. A2744-QSO1 does not present photometric variability beyond the typical dispersion of objects in the catalog objects across all epochs.
Current usage metrics show cumulative count of Article Views (full-text article views including HTML views, PDF and ePub downloads, according to the available data) and Abstracts Views on Vision4Press platform.
Data correspond to usage on the plateform after 2015. The current usage metrics is available 48-96 hours after online publication and is updated daily on week days.
Initial download of the metrics may take a while.