Fig. 1.
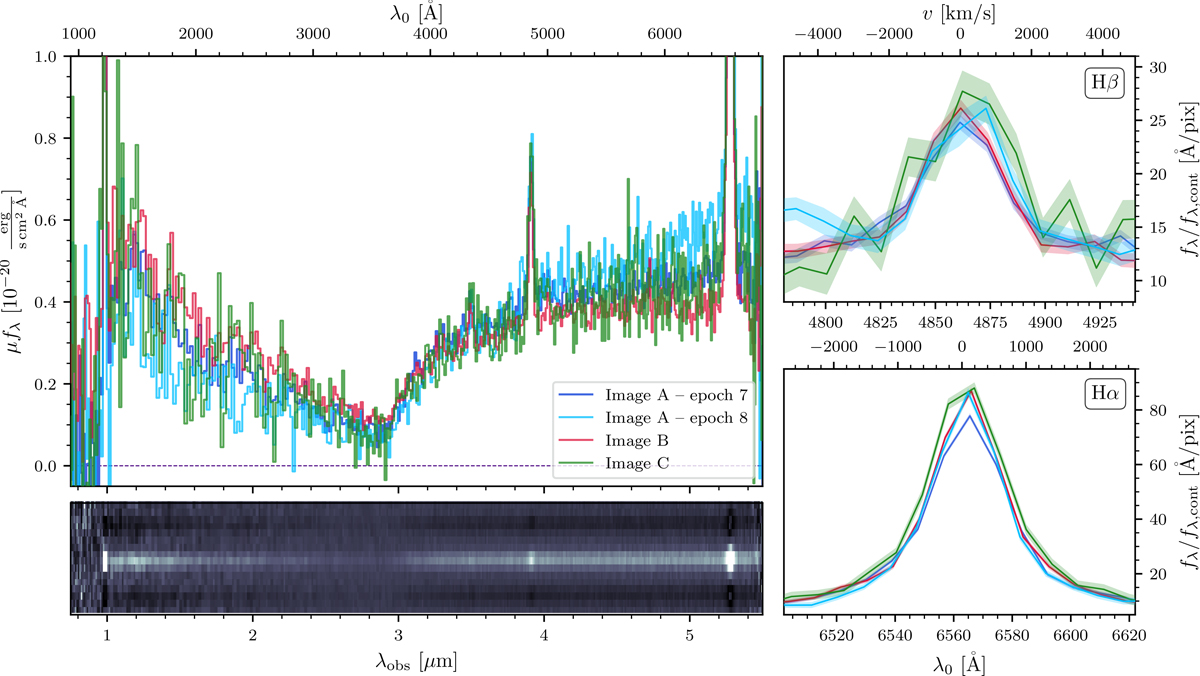
Download original image
JWST/NIRSpec prism spectroscopy from UNCOVER of all three images of A2744-QSO1 in both spectroscopic epochs (see Table 2). Image A is shown in blue (dark for epoch 7, light for epoch 8), image B in red and image C in green. Left: Full NIRSpec-prism spectra, normalized to the total luminosity of image A in epoch 7, obtained by integrating the spectra in wavelengths 1.0 μm < λobs < 5.4, μm. Thanks to the new reductions (see Sect. 2), the broad Hα line no longer falls off the detector as in previous work, but is seen entirely here for the first time. Right: Zoom-ins on the Hα (bottom) and Hβ (top) lines, scaled by their continua listed in Table 3, such that they become independent of magnification, similar to the EW.
Current usage metrics show cumulative count of Article Views (full-text article views including HTML views, PDF and ePub downloads, according to the available data) and Abstracts Views on Vision4Press platform.
Data correspond to usage on the plateform after 2015. The current usage metrics is available 48-96 hours after online publication and is updated daily on week days.
Initial download of the metrics may take a while.