Fig. 5.
Download original image
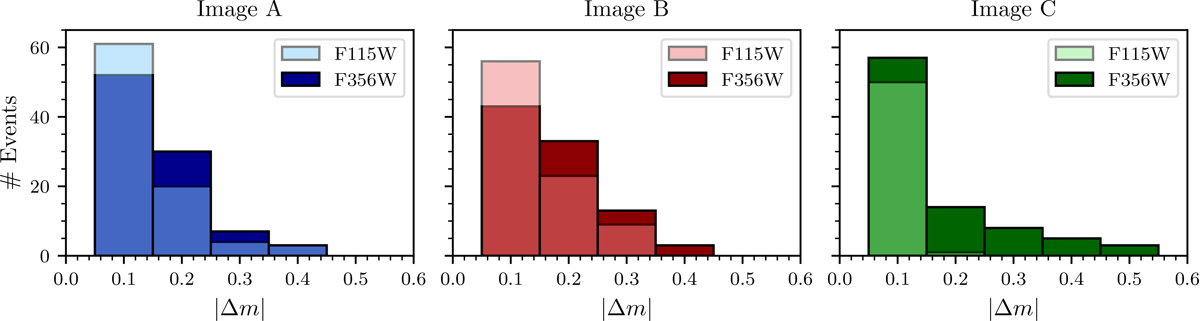
Histogram of maximum variation, |Δm|, from our simulated light curves (see Fig. 4) in F115W (light) and F356W (dark), now sampled at the rest-frame observation times of each image individually. As in Fig. 4, we show the F356W band to represent the rest-frame optical because it has the most epochs. Image A is shown in blue, image B in red, and image C in green. The probabilities of observing a significant event are much lower for the individual images than when combining the images to a full light curve.
Current usage metrics show cumulative count of Article Views (full-text article views including HTML views, PDF and ePub downloads, according to the available data) and Abstracts Views on Vision4Press platform.
Data correspond to usage on the plateform after 2015. The current usage metrics is available 48-96 hours after online publication and is updated daily on week days.
Initial download of the metrics may take a while.