Fig. 2.
Download original image
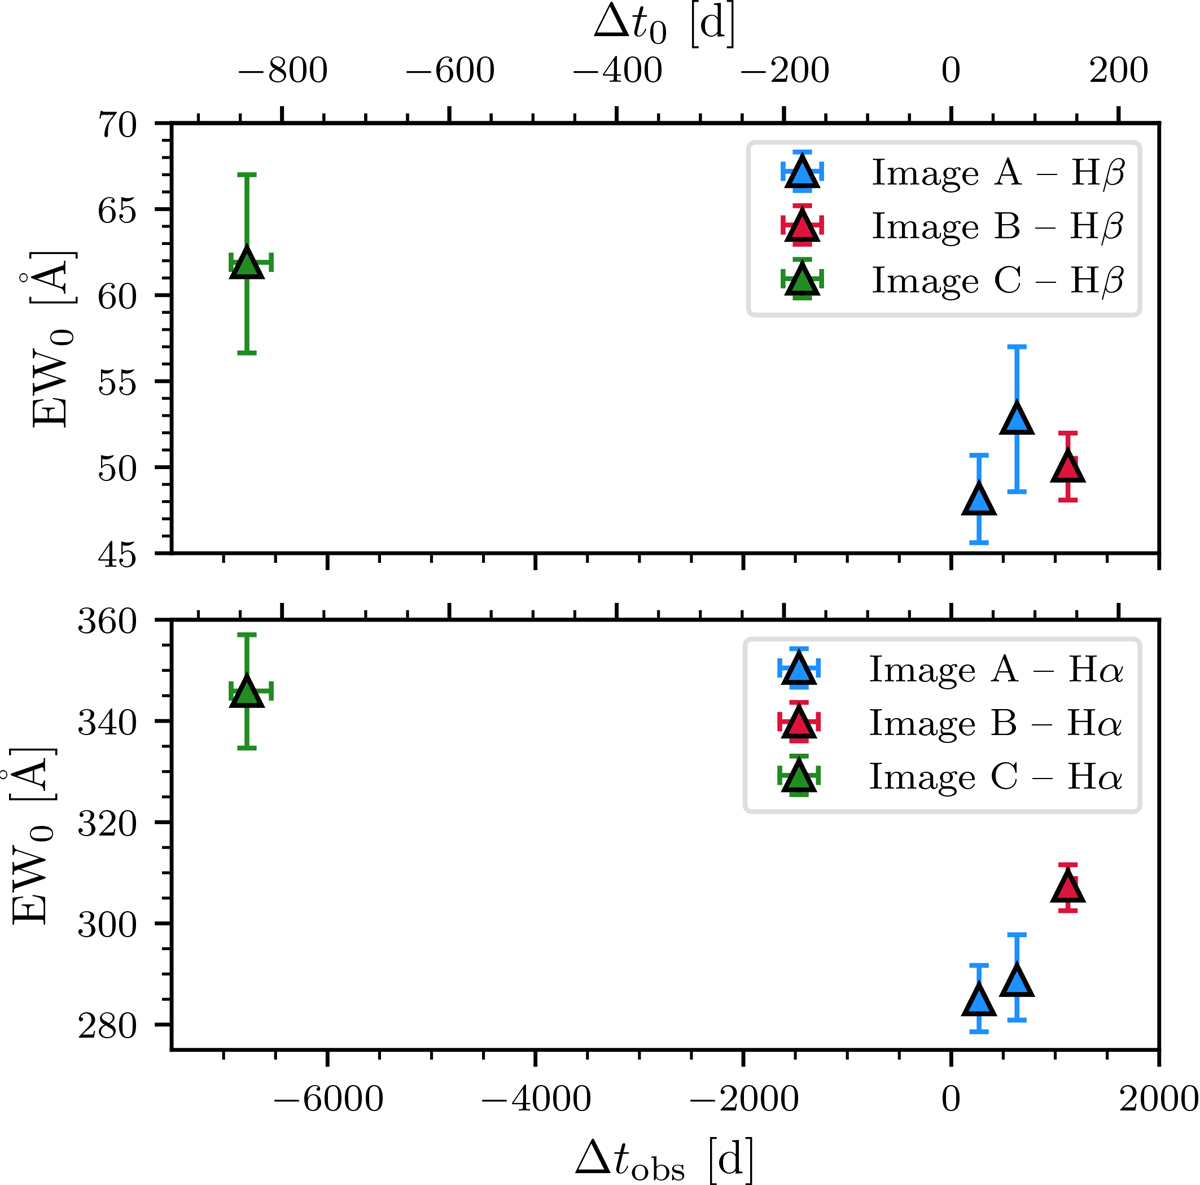
Spectroscopic variability of A2744-QSO1 as a function of time, with image A shown in blue, image B in red, and image C in green as in Fig. 3. –Top: Hβ rest-frame EW, presenting a drop of 22 ± 8% between images C and A. –Bottom: Hα rest-frame EW, presenting a drop of 18 ± 3% in the time between images C and A. We note that the variability is consistent in both broad Balmer lines, as can be expected, since they both originate from the broad-line region of A2744-QSO1. The EWs represent excellent indicators of variability, since they are insensitive to most systematics such as lensing, slit losses, and calibration.
Current usage metrics show cumulative count of Article Views (full-text article views including HTML views, PDF and ePub downloads, according to the available data) and Abstracts Views on Vision4Press platform.
Data correspond to usage on the plateform after 2015. The current usage metrics is available 48-96 hours after online publication and is updated daily on week days.
Initial download of the metrics may take a while.