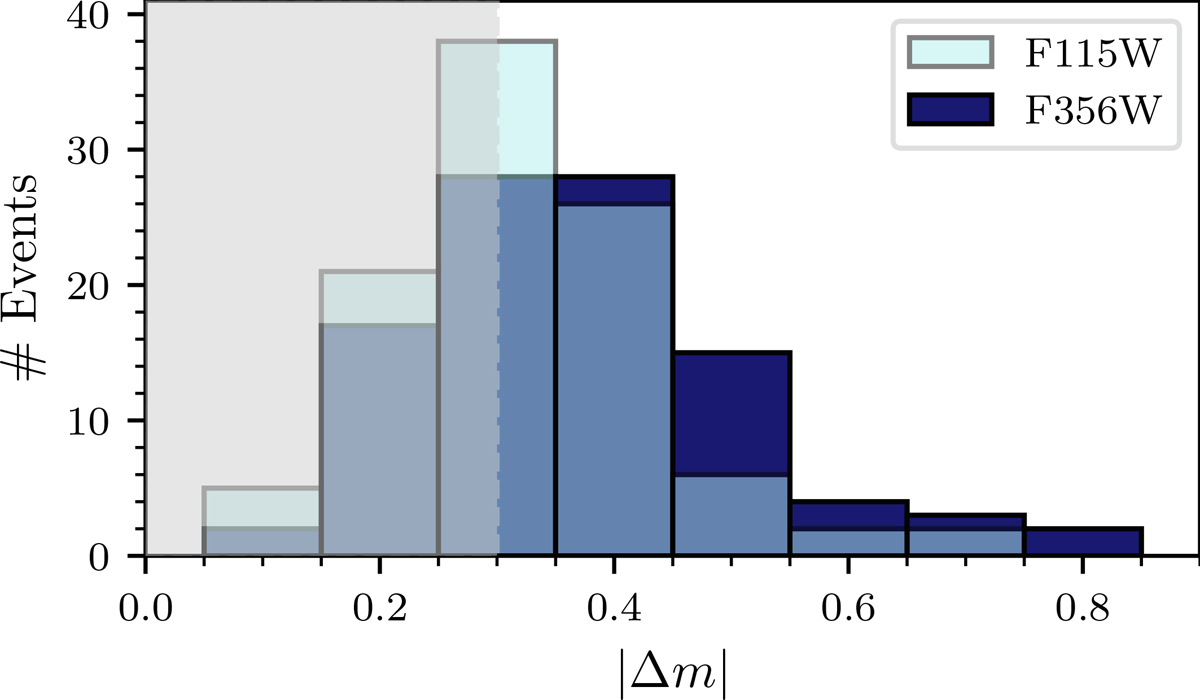
Fig. 4.
Download original image
Histogram of maximum variation, |Δm|, from 100 simulated DRW light curves of an MBH = 4 × 10⁷ M⊙ black hole, sampled at the rest-frame effective times of our combined observations of all three images of A2744-QSO1 as is shown in Fig. 3. Rest-frame UV (F115W) variations are shown in light blue and optical variations (F356W) are shown in dark blue. We chose to show the F356W band here because it has the most epochs (see Table A.1) and therefore has the highest probability of detecting a significant event. The gray-shaded area represents variations that are below the typical errors of 0.3 magnitudes (including systematics) in our photometry measurements in both bands. Even with the sampling of our full light curve, the probability of detecting a significant variation event (|Δm|> 0.5 magnitudes) is relatively low.
Current usage metrics show cumulative count of Article Views (full-text article views including HTML views, PDF and ePub downloads, according to the available data) and Abstracts Views on Vision4Press platform.
Data correspond to usage on the plateform after 2015. The current usage metrics is available 48-96 hours after online publication and is updated daily on week days.
Initial download of the metrics may take a while.