| Issue |
A&A
Volume 698, June 2025
|
|
|---|---|---|
| Article Number | A162 | |
| Number of page(s) | 12 | |
| Section | Extragalactic astronomy | |
| DOI | https://doi.org/10.1051/0004-6361/202453636 | |
| Published online | 13 June 2025 | |
From precursor to afterglow: The complex evolution of GRB 210312B
1
Astronomical Institute of the Czech Academy of Sciences (ASU-CAS), Fričova 298, 251 65 Ondřejov, Czech Republic
2
Space Research Institute of the Russian Academy of Sciences (IKI RAS), Profsoyuznaya 84/32, Moscow 117997, Russia
3
Artemis, Observatoire de la Côte d’Azur, CNRS, 06300 Nice, France
4
INAF–Osservatorio di Astrofisica e Scienza dello Spazio, via Piero Gobetti 93/3, I-40129 Bologna, Italy
5
Institute of Physics of Czech Academy of Sciences, Prague, Czech Republic
6
School of Physics & Astronomy, University of Birmingham, Birmingham B15 2TT, UK
7
Centro Astronómico Hispano en Andalucía, Observatorio de Calar Alto, Sierra de los Filabres, Gérgal, Almería 04550, Spain
8
National Research University “Higher School of Economics”, Myasnitskaya 20, Moscow 101000, Russia
9
Faculty of Electrical Engineering – FEE-CTU – ČVUT, Prague, Czech Republic
10
INAF–Osservatorio Astronomico di Roma, via Frascati 33, I-00040 Monte Porzio Catone, Italy
11
Instituto de Astrofísica de Andalucía, Glorieta de la Astronomía s/n, 18008 Granada, Spain
⋆ Corresponding author: This email address is being protected from spambots. You need JavaScript enabled to view it.
Received:
30
December
2024
Accepted:
14
April
2025
Abstract
Context. Long gamma-ray bursts (GRBs) are characterized by a brief gamma-ray flash followed by a longer-lasting multiwavelength afterglow. The basic mechanism is largely understood, and the early afterglow evolution often shows complex features that provide crucial insights into the transition between prompt and afterglow phases.
Aims. We present a detailed analysis of GRB 210312B, detected by INTEGRAL, which exhibits both a precursor and a complex optical afterglow evolution. Through careful modeling using Markov chain Monte Carlo methods, we disentangled the contributions of an early optical flare and forward shock emission.
Methods. Our analysis reveals a gamma-ray precursor 17 s before the main pulse with a significantly softer spectrum (hardness ratio 0.37±0.12 versus 1.9±0.4). The optical afterglow shows an early peak at 76.0−5.1+4.4 s characterized by a steep rise (αflare,1 = −4.1−2.3+1.6) and decay (αflare,2 = 4.0−1.5+2.1), followed by forward shock emission with a broad hydrodynamic peak at around 150 s. In the subsequent plateau phase, the afterglow initially has a complex structure before settling into a final power law decay consistent with an electron distribution index p = 2.36−0.15+0.18. The negligible host extinction (AV,host = −0.073−0.078+0.100) suggests we are observing the intrinsic afterglow spectrum. The host system consists of two luminous (MB∼−21.7) components separated by 11.5 kpc at z = 1.069, which are possibly an interacting galaxy pair.
Results. GRB 210312B provides a rare opportunity to study the prompt-to-afterglow transition in detail. The consistency of the forward shock component with standard afterglow theory supports our physical interpretation despite the lack of X-ray coverage.
Key words: methods: observational / techniques: photometric / techniques: spectroscopic / gamma-ray burst: general / stars: jets / ISM: jets and outflows
Deceased.
© The Authors 2025
 Open Access article, published by EDP Sciences, under the terms of the Creative Commons Attribution License (https://creativecommons.org/licenses/by/4.0), which permits unrestricted use, distribution, and reproduction in any medium, provided the original work is properly cited.
This article is published in open access under the Subscribe to Open model. This email address is being protected from spambots. You need JavaScript enabled to view it. to support open access publication.
1. Introduction
Long gamma-ray bursts (GRBs) are the most luminous astrophysical phenomena that occur at cosmological distances. With their spectra peaking in soft gamma-rays, their isotropic luminosities can reach 1054 erg s−1, enabling their detection across most of the observable Universe (Woosley 1993; Paczyński 1998). Their origin has been traced to collapsing massive stars that temporarily create conditions for a super-critically accreting black hole, forming a relativistic jet-like outflow. These events are characterized by an intense but brief flash of gamma rays followed by a longer-lasting multiwavelength afterglow. While this basic picture is well established, the transition between these phases and the early afterglow evolution remain areas of active investigation, particularly as the ability to capture these crucial early moments has improved dramatically with modern facilities.
The short high-energy emission of GRBs is ascribed to internal shocks within the jet (Piran 2004; Mészáros 2006; Zhang 2007; Kumar & Zhang 2015). External shocks, interactions between the ejected matter and a preexisting circumburst material, are responsible for a longer-lasting afterglow emission at lower frequencies. This afterglow emission produces a synchrotron spectrum that can be described by several spectral power laws and light curves that evolve as temporal power laws (Mészáros & Rees 1997; Sari et al. 1998).
The growing ability of very rapid follow-up by X-ray (Swift/XRT), optical, and near-infrared instruments (Swift/UVOT and a large number of ground-based telescopes) now permits us to observe the transition between prompt emission and afterglow. In contrast to the simple afterglow behavior at later times, in the early light curves we observe a range of features across the electromagnetic spectrum: the onset of the afterglow, breaks to a steeper or shallower decay, plateaus, and flares (Zaninoni et al. 2013; Swenson et al. 2013; Mazaeva et al. 2018). The flares have mainly been studied in X-rays, particularly with XRT on board the Swift satellite, where a systematic follow-up of GRBs automatically starts seconds after a gamma-ray detection. In X-rays, more than 30% of all GRBs show flaring activity (Margutti et al. 2011; Yi et al. 2016). Optical flare detections are much rarer due to the paucity of very early observations. Correlations have been found between rise and fall times, and later flares have been found to have broader peaks in the optical (Yi et al. 2017). Many spectral and temporal properties resemble those of spikes in the initial prompt γ-ray emission, suggesting a similar origin for these later flares, such as a revived central engine activity. Late flares have been suggested to be caused by a sudden change in the interstellar medium; this had been ruled out by theoretical models (Gat et al. 2013), but more recent modeling can explain late flares with a reverse shock running into a stratified medium caused by previous ejections from the star (Ayache et al. 2020). This helps explain late time flaring, which is difficult to produce with a central engine activity.
In this paper we present multifrequency observations of GRB 210312B, a remarkable event and one of the few bursts ever detected by the X-ray telescope INTErnational Gamma-Ray Astrophysics Laboratory (INTEGRAL) Joint European X-Ray Monitor (JEM-X). Despite having one of the faintest afterglows ever studied in such detail, its optical light curve exhibits two bright flares at very early times, providing a rare opportunity to study the prompt-to-afterglow transition phase.
In Sect. 2 we present the INTEGRAL high-energy observations and the comprehensive ground-based follow-up of the afterglow. In Sect. 3 we detail our analysis of the high-energy emission, characterize the optical afterglow evolution and flares, and examine the afterglow spectroscopy and host galaxy properties. Finally, in Sect. 5 we discuss the implications of our findings in the context of GRB physics. Throughout this paper, we use a cosmological model with H0 = 67.3 km s−1 Mpc−1, ΩM = 0.315, and ΩΛ = 0.685 (Planck Collaboration XVI 2014).
2. Observations
2.1. High-energy observations with INTEGRAL
GRB 210312B was discovered and localized (Mereghetti et al. 2021) with the automatic GRB triggering system the INTEGRAL Burst Alert System (IBAS; Mereghetti et al. 2003; Winkler et al. 2003; Kuulkers et al. 2021) on March 12, 2021, at 20:52:17 UT (henceforth adopted as the trigger time, T0, in our analysis). No detection by other X-ray or gamma-ray experiments has been reported.
The data from two INTEGRAL telescopes were used in our analysis of the burst prompt X-ray and gamma-ray emission: IBIS and JEM-X. The two remaining instruments aboard INTEGRAL – the gamma-ray Spectrometer on INTEGRAL (SPI) and the spectrometer Anti Coincidence Shield (ACS) – did not provide any useful output.
The IBIS gamma-ray telescope of the observatory (Ubertini et al. 2003) was designed to map the sky and study detected sources in the hard X-ray/soft gamma-ray energy ranges with an energy resolution E/ΔE∼13 at 100 keV. The imaging is based on the principle of a coded aperture. The telescope has a 30°×30° full width at zero response (FWZR) field of view (FoV; the fully coded region is 9°×9°) and an angular resolution of 12′ (full width at half maximum). Within such a wide field the telescope records 6–8 bursts per year, while its resolution allows their positions to be determined with an accuracy of ≤2′. The telescope has two detector layers: the INTEGRAL Soft Gamma-Ray Imager (ISGRI; Lebrun et al. 2003) with a maximum sensitivity in the range 18–200 keV and the Pixellated Imaging Cesium Iodide Telescope (PICsIT; Labanti et al. 2003) sensitive in the range 0.2–10 MeV. The area of each detector is ∼2600 cm2, the effective area for events at the center of the FoV is ∼1100 cm2 (half of the detectors are shadowed by the opaque mask elements). The mentioned IBAS developed to quickly search for GRBs and timely report on them via the Gamma-ray Coordinates Network (GCN) uses IBIS/ISGRI data for the analysis.
The JEM-X X-ray telescope (Lund et al. 2003) is sensitive in the 3–35 keV band. This is also a coded-aperture telescope; its FoV with a diameter of  FWZR (the diameter of the fully coded region is
  ) is bounded by a collimator. The detector is a gas chamber with an entrance window area of ∼490 cm2 and an energy resolution ΔE/E∼16% full width at half maximum (FWHM) at 6 keV. The effective area at the center of the FoV is only ∼75 cm2, because more than 80% of the detector is shadowed by the opaque mask and collimator elements. There are two nearly identical modules of the telescope aboard the observatory; if they operate simultaneously, the effective area doubles to ∼150 cm2. The angular resolution of the JEM-X telescope (
 FWHM) is a factor of 3 higher than that of the IBIS telescope.
2.2. Optical observations
The position of the event was promptly imaged by the D50 telescope in Ondřejov, which reacted robotically to the trigger. An optical counterpart was identified at
(155.815258 +76.868439; see our Fig. 1 and Jelínek et al. 2021) and later confirmed by Lipunov et al. (2021). The D50 continued monitoring in a clear filter calibrated to the r band for about 0.5 h after the GRB, until the combination of fading afterglow and approaching cirrus clouds made further observations impossible.
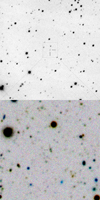 |
Fig. 1. Top panel: Discovery image from the Ondřejov 0.5 m telescope. The optical afterglow of GRB 210312B is marked. The image covers 10′ per side. Bottom panel: gri image (value inverted) from the 2×8.4 m LBT telescope. The location of the optical afterglow of GRB 210312B is marked. The double structure of the underlying object is clearly visible. This image has a dimension of 1.5′×1.5′. |
The analysis of the unfiltered D50 data is challenging in terms of calibration. First, the zero point needs to be related to a standard system, such as Pan-STARRS (Panoramic Survey Telescope and Rapid Response System) AB magnitudes. This can be done by fitting the brightness of the detected objects as a function of catalog stars. We performed a fit of our unfiltered data as a function of g, r and i entries of the ATLAS-Refcat2 (Asteroid Terrestrial-impact Last Alert System, Tonry et al. 2018). The D50 unfiltered photometry is best fitted as crraw=r+0.349(g−r)−0.839(r−i). The brightness of the object, however, corresponds to a new photometric system defined by the width of its passband. To compare the afterglow brightness of this system and that of standard filters, we needed to homogenize the result based on the known or assumed color of the optical afterglow. In this case, we could calculate the color indices (g−r) = 0.373 mag and (r−i) = 0.256 mag from the later photometry; assuming a constant spectrum, we derived the relative shift of the afterglow brightness (rOA−crraw,OA=+0.085 mag). The unfiltered measurements provided in Appendix A as a filter cr include this correction and can be directly compared to the r band, while keeping in mind the assumption of a constant spectrum.
While D50 was performing these early observations, the 2 m Perek telescope joined the monitoring campaign approximately 0.5 h after the trigger. Despite increasingly challenging weather conditions at the Ondřejov observatory, it was able to continue monitoring through thin clouds for about an hour longer than D50, until denser clouds finally forced the termination of observations ∼1.5 h after the GRB.
We continued imaging observations for several days with the 2 m Perek telescope in Ondřejov in gri and z filters, the 1.5 m and 0.9 m telescopes of the Observatorio Sierra Nevada (OSN), Granada, Spain (Kann et al. 2021a) in BVRI filters, the 2.2 m telescope at Calar Alto, Almeria, Spain, equipped with CAFOS in BVRI and the 10.4 m Gran Telescopio Canarias (GTC), equipped with OSIRIS, at Observatorio Roque de los Muchachos, La Palma, Canary Islands, Spain (Kann et al. 2021b) in r. Finally, we obtained host-galaxy observations at 56 d after the GRB with the twin 2×8.4 m Large Binocular Telescope (LBT), Mt. Graham, Arizona, USA in Sloan g′r′i′z′. The LBT imaging data were reduced using the data reduction pipeline developed at INAF – Osservatorio Astronomico di Roma (Fontana et al. 2014), and the photometry obtained is listed in Appendix A and Table 3.
2.3. Optical spectroscopy
The afterglow of GRB 210312B was observed with OSIRIS (Cepa et al. 2000) at the GTC, at the Roque de los Muchachos Observatory (La Palma, Spain) using the R1001B grism and a slit of 1″ aligned at parallactic angle. This results in a spectral coverage between 3700 and 7800 Å with a resolving power of ∼610. The spectroscopic observations were performed in two runs. The first spectral exposure started on March, 12 2021, at 23:14:06 UT but was performed under adverse conditions, including bad seeing and low transparency due to Calima. We obtained 2×900 s spectroscopic exposures with the R1000B grism, after which the telescope had to be shut down due to worsening conditions and only the first exposure was usable. The second epoch started on at 01:50:25 UT and included 4×900 s spectra of somewhat better quality.
Here we analyze the combined spectrum, which is an average of the first exposure and the last four. This 5×900 s spectrum has a mean epoch of 01:45:08 UT. A preliminary analysis of this spectrum was presented by Kann et al. (2021c), revealing a redshift of z = 1.069.
3. Analysis of the prompt and afterglow emission
The analysis of the JEM-X and IBIS/PICsIT data is carried out with the standard INTEGRAL software (OSA; version 10.2, Goldwurm et al. 2003), whereas the analysis of the IBIS-/ISGRI data is performed with software developed at IKI RAS (its basic principles aimed at carefully removing the nonuniform background of the instrument and reconstructing the sky image were described by Revnivtsev et al. 2004).
3.1. GRB detection and localization
Figure 2 shows the sky image (S/N map) obtained by IBIS/ISGRI in the 20–100 keV range during the 2.4 s duration of the GRB 210312B primary pulse. There is only one (previously unknown) source confidently (S/N ≃ 19.1σ) detected in the FoV, which we naturally associate with GRB 210312B. It is located at RA  , Dec
, Dec  (epoch 2000.0, uncertainty ∼ 45″).
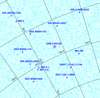 |
Fig. 2. Sky image (S/N map) within the IBIS/ISGRI FoV obtained during the primary pulse of GRB 210312B (2.4 s). Coordinates are Galactic. GRB 210312B was the only source detected in the field (at a S/N level of 19.1σ). The crosses indicate positions of known persistent X-ray sources (not detected in this short exposure). |
The source is also detected in the JEM-X 3–20 keV image (combining the data from the two telescope units; see Fig. 5a). Here, the maximum S/N ≃ 5.2σ was reached over a longer time interval of ≃7.0 s.
Light curve. The light curve of GRB 210312B obtained by IBIS/ISGRI in the broad 20–100 keV energy range is presented in Fig. 3. The burst occurred when the spacecraft was entering into the Earth's radiation belts thus the count rate of both instruments is strongly affected by background variation (green histogram in Fig. 3). The coded mask of the instrument allows such a variable background to be effectively subtracted (black histogram). The reconstructed light curve demonstrates the presence of two additional pulses (indicated in the figure by numbers 1 and 2) preceding the primary pulse of GRB 210312B (number 3) by ∼15 and ∼6 s. Our reconstruction of the sky image for the 1st pulse confirms its confidence, S/N ≃ 6.6σ (see Fig. 5b, left panel). The second pulse is insufficiently significant, S/N ≃ 3.1σ, and we did not take it into account further. Note that the duration of the primary pulse is taken to be only 2.4 s for further analysis although it seems broader in the figure, as this interval provides the highest S/N for the pulse (≃19.1σ). The 1st pulse (precursor) has a duration of ∼4 s. Its presence has been confirmed also by JEM-X in the 3–20 keV range (see Fig. 5, right panel). The resulting background-subtracted light curves were obtained by using only masked (illuminated by the source) pixels of detectors in three IBIS/ISGRI energy bands, 25–40, 40–80, and 80–160 keV, and in the JEM-X 3–20 keV band (combining the data from the two JEM-X units) are presented in Fig. 4.
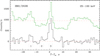 |
Fig. 3. 20–100 keV count rate history recorded by the IBIS/ISGRI detector with a time resolution of 1.0 s (green histogram) and the corresponding light curve of GRB 210312B reconstructed through the mask decoding (black histogram) with the background subtracted and the dead time corrected. The vertical dotted lines show time intervals used for image and spectral reconstruction for the GRB precursor (1), intermediate (2), and primary (3) pulses. |
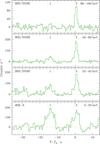 |
Fig. 4. Masked light curves of GRB 210312B obtained in different energy bands with the INTEGRAL IBIS/ISGRI and JEM-X telescopes. The time resolution is 0.5 s. The vertical dashed lines show the time intervals used for image and spectral reconstruction for the main pulse and precursor. |
Precursor. After subtracting the background we find another episode of activity in the IBIS/ISGRI light curves preceding the main pulse (trigger time) by ∼17 s (see Fig. 4). This emission pulse is softer than the main one: it is not visible in the hard energy band covering 80–160 keV, but is actually brighter than the main episode in the softest energy band covering 3–20 keV in the JEM-X data. We calculate hardness ratios between 40–80 and 3–20 keV bands of ISGRI and JEM-X, correspondingly, for both emission episodes, using their fluxes, expressed in counts. We obtain HR = 0.37±0.12 for the precursor and HR = 1.9±0.4 for the main episode, confirming the suggestion of the difference in energy spectra at 4σ confidence level.
The softness, faintness and relative position of the component suggest it to be a precursor (see, e.g., Minaev & Pozanenko 2017, and references therein). This emission episode is confirmed by the image reconstruction for both IBIS/ISGRI and JEM-X instruments, as shown in Fig. 5.
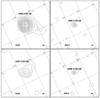 |
Fig. 5. Detection of the burst by INTEGRAL during the primary pulse (a) and precursor (b) phases. Shown are S/N maps of the sky region |

Duration. Using the method described by Koshut et al. (1996), we estimated the GRB duration parameters T90 and T50 (time intervals with integrated counts rising from 5% to 95% of the total, and from 25% to 75%, correspondingly) in the 20–160 keV energy range of the IBIS/ISGRI data: T90 = 18.6±1.5 s and T50 = 2.8±0.2 s. The large difference in the values is connected with the fact that T90 covers both episodes of emission, while T50 covers only the main pulse. The duration classifies GRB 210312B as a Type II burst (long-duration GRB, Zhang et al. 2009; Kann et al. 2011).
3.2. Spectral lag analysis
Spectral evolution of GRBs is usually measured in terms of a spectral lag – a relative shift (lag) of the light curves in different energy bands. The lag is considered positive if the hard emission is ahead of the soft, and it could be significant (up to a few seconds) for Type II (long) bursts (e.g., Liang et al. 2006).
To investigate the spectral lag for GRB 210312B, we used the cross-correlation method described by Minaev et al. (2012, 2014) and applied it to the IBIS/ISGRI and JEM-X data, which cover only the main episode of the emission (time interval (–2, 6) s post trigger) and have a S/N sufficient to carry out this type of analysis. We constructed light curves with a time resolution of 0.03 s in four ISGRI energy bands (20–40, 40–60, 60–90, and 90–160 keV) and in the 3–20 keV energy band of JEM-X. The ISGRI-based energy band 40–60 keV was chosen as the reference relative to which the cross-correlation of the other bands was carried out.
We marginally detect a positive lag for the main emission episode of the burst over the whole energy range 3–160 keV, including X-rays, which is well described by a logarithmic function lag∝Alog E with a spectral lag index of A = 0.25±0.02. Such a lag also favors the classification of the burst as a Type II (see, e.g., Minaev et al. 2014). The null hypothesis of the absence of the lag is, however, not completely excluded (χ2/d.o.f. = 3.3/4 for zero lag) because of large errors likely related to the faintness of the burst.
3.3. X-ray spectra
The best fit for the main pulse of GRB 210312B (Fig. 6, open circles) is achieved with the XSPEC Cutoff Power-law (CPL) model. The fit parameters are: photon index α = 1.2±0.2, cutoff energy Ec = 92±31 keV, Ep=(2−α)Ec≃74 keV, and the mean flux in the 3–400 keV range F3≃(2.60±0.18)×10−7 erg s−1 cm−2. The spectrum of the precursor (Fig. 6, filled circles) is noticeably softer than the spectrum of the main pulse. The CPL-fit parameters are α = 2.0±0.3,Ec≥74 keV (at 3−σ level) and the mean flux F1=(1.06±0.15)×10−7 erg s−1 cm−2. As observed in the optical, the afterglow of GRB 210312B reached a maximum ∼ 75 s after the GRB trigger time. We therefore inspected the flux in the ISGRI 25–40 keV band in the time interval T0+65 s<T<T0+85 s, and obtained a limit of F<6.1×10⁻¹⁰ erg s−1 cm−2. The JEM-X background is more sensitive to the radiation environment and was less restricting.
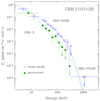 |
Fig. 6. Broadband spectrum measured during the main pulse (blue line and open circles) and precursor (green line and filled circles) phases of GRB 210312B as measured with the INTEGRAL IBIS/PICsIT IBIS/ISGRI and JEM-X telescopes. The best fits with the CPL model are shown with solid lines. |
3.4. T90,i – EH diagram
To help with the classification problem of GRBs, an advanced method was proposed by Minaev & Pozanenko (2020). This method uses the Ep,i – Eiso correlation features and the bimodality of the rest-frame duration (T90,i) distribution. The EH parameter (Eq. (1)) characterizes the position of a GRB in the Ep,i – Eiso diagram, where Eiso is an isotropic equivalent of the total energy emitted in the gamma-ray range, and Ep,i is the position of the maximum in the energy spectrum νFν in the source frame:
 (1)
(1)
Using the values of fluence and Ep of the CPL spectral model obtained for the main pulse of GRB 210312B, and the redshift z = 1.069, we obtain Eiso=(1.70±0.11)×1051 erg and Ep,i = 163±56 keV. The corresponding value of the EH parameter is equal to 1.32, while the burst duration in the rest frame is T90,i = 9.0 s.
Type I GRBs, in comparison with Type II GRBs, have a harder spectrum (in terms of Ep,i values) with a lower value of the total isotropic energy Eiso and, as a consequence, a larger value of the parameter EH, and also a shorter duration T90,i. As shown in Fig. 7, GRB 210312B falls inside the 1σ cluster region of Type II bursts, further supporting our classification. Similarly, its position in the original Amati Ep,i – Eiso diagram (Fig. 8) is also consistent with the Type II origin of the burst.
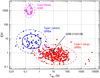 |
Fig. 7. T90,i – EH diagram for type I GRBs (blue squares), type II GRBs (red circles), and SGR giant flares (unfilled magenta squares) with corresponding cluster analysis results. The 1σ and 2σ cluster regions are shown with bold solid and thin dashed curves of the corresponding colors. GRB 210312B is shown as an unfilled black circle. |
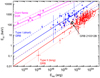 |
Fig. 8. GRB 210312B in the Amati correlation plane. The location of the main pulse is marked. The correlations for long GRBs (Type II; red), short GRBs (Type I; blue), and SGR giant flares (purple) are shown with their respective 3σ confidence regions. |
3.5. Optical afterglow
The imaging started 23.8 s after the GRB. After two initial frames with low-significance detections, the afterglow is clearly identified rising rapidly to a bright peak around 75 s post trigger. The light curve then shows several distinct phases: an initial decay lasting until ∼200 s, is followed by a plateau phase for about 40 minutes, a rebrightening around 3000 s, and finally by a steady decay. The afterglow remains detectable until ∼100 ks post trigger, after which it becomes dominated by the host galaxy component.
The photometry requires different approaches at different epochs. In early, low-resolution images, where the afterglow and both components of the host system fall within a single point spread function (PSF), we measured their combined brightness and handled the host contribution through the afterglow modeling. For later, high-resolution images, we employed PSF-matching image subtraction (hot pants; Becker 2015) to isolate the afterglow. Both types of measurements are indicated accordingly in Appendix A.
3.6. Optical afterglow fitting
We modeled the optical afterglow using Markov chain Monte Carlo (MCMC) sampling (Metropolis et al. 1953) to fit a physically motivated two-component model consisting of an early optical flare and forward shock emission. The analysis, performed with 128 walkers over 131 072 steps after burn-in, reveals a complex afterglow evolution characterized by several transitions. Both Akaike and Bayesian information criteria support our model choice and suggest there are conservative error estimates in our photometry.
The early optical flare shows a well-defined peak at  s, marked by steep rise (
 ) and decay (
 ) phases. While the uncertainties in these slopes are substantial due to temporal overlap with the forward shock component, the timing of the peak itself is robustly determined. The forward shock evolution begins with a rise to a broad hydrodynamic peak around
  s, characterized by a smooth transition (
 ) as expected for the onset of the afterglow.
The subsequent evolution shows a relatively slow decay ( ), slower than predicted by the standard fireball model, suggesting continued energy injection. This phase includes a rebrightening at
  s before finally transitioning to the late decay at
  s. Much like bright and dim patches in a waterfall emerge from underlying turbulent flow without deeper physical significance, this rebrightening likely represents a prominent manifestation of the stochastic energy injection process rather than a fundamentally distinct physical transition. The final break at TFS,34 marks the cessation of energy injection, after which the afterglow evolution follows the standard fireball model predictions. The electron distribution index
  remains well constrained throughout and implies physically consistent spectral and temporal evolution in the final decay phase (β=−p/2=−1.18, αFS,5=(3p−2)/4 = 1.27).
This analysis captures the temporal behavior of both the early optical flare and subsequent forward shock emission, while suggesting that the complex plateau structure, though well fit by our model, should be interpreted with caution regarding its physical significance. The host extinction remains consistent with zero ( ). The overall goodness of fit (reduced χ2 = 0.52) and well-constrained values for key physical parameters (p, B, Bflare) support the validity of our two-component interpretation, even while some transition parameters remain less certain due to their overlapping effects in the light curve.
Parameters of the two-component model (forward shock + early flare) fitted to the GRB 210312B optical afterglow using MCMC sampling.
3.7. Afterglow spectral energy distribution
The early optical peak reaches rAB = 18.2 mag (190 μJy) at 75 s post trigger. A contemporaneous search for high-energy emission in the INTEGRAL data (Sect. 3.3) yields only an upper limit in the 20–30 keV band of F< 6.1×10⁻¹⁰ erg s−1 cm−2 (25 μJy) during 65–85 s post trigger, implying βo−γ<−0.2.
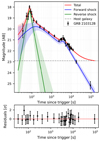 |
Fig. 9. Optical light curve of GRB 210312B. The data points show different filter measurements converted to the r-band equivalent using the spectral slope derived from our model fit. The solid lines show the best-fit model (red) with 68% confidence intervals (shaded regions) decomposed into its constituent components: forward shock (blue) and an early flare (green) emission. The dashed gray line indicates the host galaxy brightness. The model simultaneously fits both the temporal evolution and spectral behavior, properly accounting for the host galaxy contribution in measurements where it was not subtracted through image analysis. The residuals in the bottom panel demonstrate the quality of the fit. For model parameters, see Table 1. |
The MCMC analysis provides well-constrained values for both the electron distribution index  and the host extinction
  . These yield a spectral index β=−p/2=−1.18 and final temporal decay αFS,4=(3p−2)/4 = 1.27, consistent with standard afterglow theory for a forward shock in the slow cooling regime propagating into a constant density medium. The negligible host extinction supports this being the intrinsic spectral shape of the afterglow (see Fig. 10).
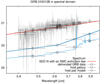 |
Fig. 10. Spectral energy distribution of GRB 210312B and the residuals from the temporal and spectral fit model presented in Fig. 9. The points show the data after the temporal evolution is removed, revealing the intrinsic spectral shape. The griz photometric measurements of both host galaxy components are shown (points), along with a representative galaxy template spectrum (solid line) for comparison. The dashed line shows our simplified model of the host system used for host contribution corrections during afterglow fitting. |
3.8. Optical afterglow spectrum
The spectrum (see Fig. 11, top) shows a low S/N continuum in which we can identify several absorption features due to FeII, MgII, and MgI at a common redshift of z = 1.0690±0.0005. The measurements of the equivalent widths of the host are presented in Table 2, with which we produced a line strength diagram following the prescription of de Ugarte Postigo et al. (2012), which is shown in Fig. 11 (bottom). We also calculated the line strength parameter of this line of sight, for which we get a value of 0.25±0.20, which implies that the absorption features in the line of sight of GRB 210312B are stronger than 65% of those in the sample of de Ugarte Postigo et al. (2012).
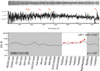 |
Fig. 11. Top: Spectrum obtained with OSIRIS at the 10.4 m GTC. The 2D and 1D extractions are shown, and the detected features are indicated. Bottom: Line strength diagram obtained from the spectra of GRB 210312B. |
Equivalent widths of the absorption features measured in the spectrum.
Photometric measurements of the GRB 210312B host galaxy and its companion  south of the afterglow position.
We further detect a clear emission feature from the [OII]λλ3727,3729 doublet at the same redshift, confirming the presence of a star-forming host galaxy. The [OII] doublet has a combined flux of 9.1±0.2×10⁻¹⁸ erg cm−2 s−1, translating to a star formation rate (SFR) of 0.8 M⊙ yr−1 (Kennicutt et al. 1993). This provides a lower limit since extinction in the host galaxy cannot be reliably determined from our data.
We can also estimate the SFR from the rest-frame UV luminosity of the host galaxy. At z = 1.069, our i-band observations (λeff≈7860 Å) correspond to the rest-frame u band. Using the host galaxy magnitude i = 23.16±0.18, the solar u-band absolute magnitude from Willmer (2018), and the UV–SFR calibration from Hopkins et al. (2003), we derive SFRUV≈ 2.6 M⊙ yr−1.
Both estimates suggest modest star formation activity compared to typical rates of 1–10 M⊙ yr−1 seen in GRB hosts at similar redshifts. The factor of 3 difference between UV and [OII] estimates, combined with the relatively high luminosity and possible interacting nature of the host system, suggests a complex star formation history that may not be fully captured by either indicator alone.
3.9. Host galaxy
Thirty days after the burst, we reimaged its position with the ASÚ 2 m telescope in Ondřejov in the r band with an exposure time of 1.8 h. The combined image shows an object whose centroid is not perfectly aligned with the optical afterglow position and with a brightness of r = 22.84±0.06 mag.
In order to better study the host galaxy, 52 days after the GRB, we obtained late imaging with the Large Binocular Telescope (LBT) in griz. All four bands show two objects of comparable brightness (magnitude difference ≃ 0.2 mag in r) and color with a relative offset of  (see Fig. 1). GRB 210312B is located closer to the northern object than the southern one. With the GRB redshift of z = 1.069, observed filter z corresponds to the rest-frame B band and the absolute magnitude derived from observations in this filter is MB∼−21.7, similar to the Andromeda galaxy. This is notably more luminous than typical GRB hosts at this redshift (Savaglio et al. 2009; Chrimes et al. 2019), which tend to be sub-L* galaxies with absolute magnitudes around MB∼−20. The high luminosity is also consistent with findings from complete GRB host samples that show most GRB hosts are typically less luminous at this redshift (Perley et al. 2016).
According to the DESI Legacy imaging catalog (Dey et al. 2019)1, which contains the two objects, the northern one is extended and the southern has a stellar PSF. The brightness of the two objects agrees within error bars with our measurements. Since the photometry of the system is consistent at four different epochs (Legacy, CAHA day 4, Ondřejov, LBT), we can place upper limits on any accompanying supernova using our late-time observations. At the time of the LBT observation (rest-frame ∼ 25 days), a supernova would need to be brighter than MB=−22.0 (3σ above the host brightness) to be detectable in the z band. Similarly, from the ASU 2.0 m observation (rest-frame ∼ 14 days), we derive a limit of MU=−21.65 in the observed r band. These limits are well above the brightest known GRB supernovae, which peak around M=−20.1 (Belkin et al. 2020), indicating that at this redshift, any supernova component would be overwhelmed by the host galaxy's brightness.
If indeed the two objects are at the same redshift, they are very likely interacting with a distance of only 1.7″, corresponding to a physical separation of 11.5 kpc at z = 1.069. The system could be an interacting pair of galaxies similar to M51 in the local Universe. While most GRB hosts at this redshift tend to be irregular and show signs of ongoing star formation, the presence of an interacting system is not unprecedented; several other GRBs have been found in galaxies that show evidence of interaction (e.g., Volnova et al. 2014) or merging.
4. Discussion
4.1. High-energy domain
GRB 210312B provides an intriguing case study of prompt emission complexity, detected as a long-duration GRB by INTEGRAL. Its high-energy light curve revealed two distinct emission episodes separated by ∼15 s, with the first episode identified as a precursor only after careful background analysis. Apart from detection by the triggering instrument IBIS/ISGRI, it joins the select group of GRBs detected by the X-ray telescope JEM-X (Minaev et al. 2012; Martin-Carrillo & Hanlon 2013), providing valuable broad-band coverage of the prompt emission. The precursor, initially missed in real-time analysis due to highly variable background (Mereghetti et al. 2021), was confirmed through detailed time profile analysis and subsequent image reconstruction. Notably, spectral analysis reveals the precursor to be softer than the main pulse, a characteristic seen in some other GRBs with precursor activity.
4.2. Classification
The physical classification of GRB 210312B as a long-duration burst (Type II) is supported by multiple independent lines of evidence. Beyond the traditional duration and spectral criteria, we find consistent indicators across temporal properties (time profile, spectral lag), energetics (position in the T90,i – EH diagram), and environmental characteristics (afterglow behavior, host galaxy properties, and the small spatial offset from the galaxy center).
Within the context of the INTEGRAL FoV's GRB population (Vianello et al. 2009), GRB 210312B emerges as a relatively modest event. Its T90 of 18.6±1.5 seconds places it in the bottom third of INTEGRAL burst durations, with 68% of the sample showing longer durations. Similarly, 75% of INTEGRAL-detected events have higher fluence. Despite these characteristics, GRB 210312B displays properties typical of the long-duration GRB population as a whole.
4.3. Optical domain
The optical afterglow of GRB 210312B exhibits a complex structure that is best understood as a combination of an early optical flare, forward shock evolution, and a period of enhanced activity during the plateau phase (see Fig. 9). Our detailed MCMC analysis reveals distinct components and phases in the afterglow evolution.
The early emission is dominated by a sharp peak, characterized by a remarkably steep rise ( ) to a maximum at
  s, followed by a rapid decay (
 ). The contemporaneous gamma-ray limit during this peak suggests that the emission peaked in the optical band. While this and the steep decay phase might be consistent with reverse shock emission, the physical origin of the early optical flare remains challenging to determine conclusively. The distinct peak times between the early flare (∼76 s) and the forward shock component (∼150 s) challenge standard reverse shock models, which typically predict coincident hydrodynamic peak times for both components when followed by steep decay (Kobayashi & Zhang 2003; Zhang et al. 2003). Additionally, the observed decay slope (
 ) is steeper than the theoretical prediction for reverse shock emission based on our measured electron distribution index (αflare=(27p+7)/35≃2.0±0.1). These discrepancies suggest either a more complex emission scenario or potentially an internal engine origin for the early flare.
The subsequent plateau phase, lasting until ∼2500 s, shows complex behavior that cannot be explained by simple relativistic fireball expansion, suggesting continued energy injection or internal engine activity. This phase culminates in a rebrightening episode peaking at  s. While statistically significant, with Δt/t≥0.71 (Swenson et al. 2013), this feature appears to be part of the overall plateau structure rather than a distinct flaring event. The interpretation of the second peak as part of the plateau structure is supported by several observations: the modest amplitude (∼0.25 mag above the previous minimum), the smooth transition to the final decay phase, and the lack of significant spectral evolution during this period.
The afterglow ultimately settles into a well-behaved decay phase characterized by αFS,4 = 1.27, consistent with the expectations from standard afterglow theory for  (see Sect. 4.4). The absence of significant host extinction (
 ) and spectral evolution during the late phases provides additional support for this interpretation of the afterglow behavior. While we do not observe a jet break in our data, our observations extend only to ∼1 day post-burst, so this non-detection is not strongly constraining as jet breaks have been observed both before and well after this timescale (see Li et al. 2015).
4.4. Closure relations
The MCMC analysis provides well-constrained values for the temporal and spectral evolution of the afterglow. The final temporal decay rate αFS,4 = 1.27 and electron distribution index  are fully consistent with the expectations for an adiabatic expansion into a homogeneous ISM medium in the slow cooling regime (for a complete reference of closure relations, see Gao et al. 2013). The spectral index β=−p/2=−1.18 derived from this electron distribution aligns with standard external shock model predictions.
The robustness of our interpretation is further supported by independent analysis. Our detailed analysis is compatible with the preliminary findings reported by Kann et al. (2024), who analyzed this burst as part of a larger sample. Their late-time decay index α2 = 1.18±0.09 agrees well with our final temporal decay rate αFS,4 = 1.27, and their spectral index β = 1.18±0.077 is consistent with our value β=−1.18 derived from the electron distribution index  . The agreement between these independently derived parameters, with our values emerging from a physically motivated model constrained by a single p value, strengthens confidence in the interpretation. Their finding of negative extinction is also consistent with our results (
 ). Notably, they identify GRB 210312B as one of the faintest afterglows ever followed in such detail, with RC≈24.7 mag at one day post-burst, making our comprehensive early-time coverage particularly valuable for understanding the prompt-to-afterglow transition in weak bursts.
The negligible host extinction ( ) suggests we are observing the intrinsic spectral shape of the afterglow, lending additional confidence to our derived parameters. This comprehensive consistency between temporal and spectral properties strongly supports the standard external shock model as the source of both early and late afterglow emission.
4.5. Initial gamma factor
The forward shock peak time  s corresponds to the deceleration time. Since this time is much longer than T90 (∼ 18.6 s), it is appropriate to consider a “thin” shell regime (Sari & Piran 1995). The peak time can be used to estimate the initial Lorentz factor of the ejecta (Mészáros 2006; Molinari et al. 2007):
 (2)
(2)
where Eγ,iso,52 is the isotropic equivalent energy in units of 1052 erg s−1; η0.2 is the radiative efficiency in units of 0.2; n0 is local density in units of cm−3 and tp,z,1 is the peak time corrected for cosmological time dilation in units of 10 s. For GRB 210312B, with redshift z = 1.069 and fluence of (5.54±0.35)×10−7 erg cm−2 (3–400 keV), we derive the rest-frame isotropic energy Eγ,iso=(1.7±0.1)×1051 erg. With  , we estimate
 (3)
(3)
This value is consistent with the established correlation between initial Lorentz factor and isotropic energy (Liang et al. 2010). With this Lorentz factor and the peak time, the emission radius at the time of maximum is approximately R≈2cΓ2t/(1+z)≈1.7×1016 cm (∼ 1100 AU).
4.6. Choice of reference time
The detection of the precursor raises an important question about the choice of temporal reference (T0) for analyzing the afterglow evolution. While we primarily used the INTEGRAL trigger time (coincident with the main emission episode) as our reference, we investigated how shifting T0 to the onset of the precursor (ΔT0=−17 s) would affect the analysis.
The choice of T0 most significantly impacts the early afterglow temporal indices. For example, the early flare rise becomes steeper when measured relative to the precursor onset (αflare,1 changes from  to approximately −4.8). However, the later temporal indices, including the critical forward shock decay slope αFS,4, remain largely unchanged due to their much larger time differences from T0.
5. Conclusions
GRB 210312B, discovered by INTEGRAL on March 12, 2021, is an excellent case study of complex GRB evolution from the precursor to the afterglow. The high-energy emission consisted of two distinct pulses: a precursor and a main episode separated by approximately 17 seconds, with the precursor showing distinctly softer emission (hardness ratio 0.37±0.12 versus 1.9±0.4 for the main pulse).
The main episode, which lasted T90 = 18.6±1.5 s, is well fit by a cutoff power law with photon index α = 1.2±0.2 and cutoff energy Ec = 92±31 keV. A marginally positive spectral lag is detected across the 3–160 keV range (spectral lag index A = 0.25±0.02). Together with the burst duration and spectral characteristics, these properties firmly establish GRB 210312B as a Type II (long) burst.
Our detailed MCMC analysis of the optical afterglow reveals a complex but physically coherent evolution. The early emission shows a prominent optical flare peaking at  s and characterized by steep rise (
 ) and decay (
 ) phases. The forward shock component emerges with a broad hydrodynamic peak around 150 s, followed by a plateau phase showing evidence of continued energy injection or engine activity until about 3800 s.
The afterglow properties are remarkably consistent with standard external shock theory. The electron distribution index  implies spectral and temporal indices (β=−1.18, αFS,4 = 1.27) that align with expectations for an adiabatic shock in a constant density medium. The negligible host extinction (
 ) suggests we are observing the intrinsic afterglow spectrum.
The host appears to be an unusually luminous (MB∼−21.7), potential interacting system at z = 1.069 with two components separated by 11.5 kpc. Spectroscopy reveals both absorption features and [OII] emission, indicating an actively star-forming environment, though the nature of the southern component remains uncertain.
GRB 210312B stands out for several reasons: the clear detection of its precursor in multiple energy bands, the well-sampled optical light curve capturing both the early optical flare and forward shock emission, and the possibility of decomposing its complex evolution into physically meaningful components through MCMC analysis. While the lack of X-ray coverage limits our ability to fully characterize the broadband emission, the available data demonstrate how careful modeling can extract rich physical information even from partial spectral coverage.
These results reinforce the importance of rapid response and multiwavelength observations in modern GRB science, while also highlighting how sophisticated statistical techniques can help unravel complex afterglow behavior. The detection of features from the precursor to late afterglow phases makes GRB 210312B a valuable addition to the growing sample of well-studied long GRBs.
Acknowledgments
The Astronomical Institute in Ondřejov is supported by the project RVO:67985815. SG, PM, AP, IC acknowledge support of their analysis of the INTEGRAL data by the RSCF grant 23-12-00220. DAK acknowledges support from Spanish National Research Project RTI2018-098104-J-I00 (GRBPhot). AR acknowledges support from the INAF project Premiale Supporto Arizona & Italia. This work is based on observations from multiple facilities. The critical early-time observations were obtained with the 0.5-m robotic telescope D50 and the 2-m Perek telescope at the Astronomical Institute of the Czech Academy of Sciences in Ondřejov, which were instrumental in characterizing the prompt-to-afterglow transition through rapid-response first detection and subsequent multi-band monitoring. We used data from the Gran Telescopio Canarias (GTC), installed at the Spanish Observatorio del Roque de los Muchachos of the Instituto de Astrofísica de Canarias on the island of La Palma, and from the 2.2m telescope of Centro Astronómico Hispano en Andalucía (CAHA) at Calar Alto (proposal F21-2.2-013), operated jointly by Junta de Andalucía and Consejo Superior de Investigaciones Científicas (IAA-CSIC). The LBT observations were enabled by the international collaboration among institutions in the United States, Italy, and Germany. The LBT Corporation partners are the University of Arizona on behalf of the Arizona Board of Regents; Istituto Nazionale di Astrofisica, Italy; LBT Beteiligungsgesellschaft, Germany, representing the Max-Planck Society, the Leibniz Institute for Astrophysics Potsdam, and Heidelberg University; and the Ohio State University, representing OSU, University of Notre Dame, University of Minnesota, and University of Virginia.
References
- Ayache, E. H., van Eerten, H. J., & Daigne, F. 2020, MNRAS, 495, 2979 [Google Scholar]
- Becker, A. 2015, Astrophysics Source Code Library [record ascl:1504.004] [Google Scholar]
- Belkin, S. O., Pozanenko, A. S., Mazaeva, E. D., et al. 2020, Astron. Lett., 46, 783 [NASA ADS] [CrossRef] [Google Scholar]
- Cepa, J., Aguiar, M., Escalera, V. G., et al. 2000, in Optical and IR Telescope Instrumentation and Detectors, eds. M. Iye, & A. F. Moorwood, Society of Photo-Optical Instrumentation Engineers (SPIE) Conference Series, 4008, 623 [NASA ADS] [CrossRef] [Google Scholar]
- Chrimes, A. A., Levan, A. J., Stanway, E. R., et al. 2019, MNRAS, 486, 3105 [NASA ADS] [CrossRef] [Google Scholar]
- de Ugarte Postigo, A., Fynbo, J. P. U., Thöne, C. C., et al. 2012, A&A, 548, A11 [NASA ADS] [CrossRef] [EDP Sciences] [Google Scholar]
- Dey, A., Schlegel, D. J., Lang, D., et al. 2019, AJ, 157, 168 [Google Scholar]
- Fontana, A., Dunlop, J. S., Paris, D., et al. 2014, A&A, 570, A11 [NASA ADS] [CrossRef] [EDP Sciences] [Google Scholar]
- Gao, H., Lei, W. -H., Zou, Y. -C., Wu, X. -F., & Zhang, B. 2013, New Astron. Rev., 57, 141 [CrossRef] [Google Scholar]
- Gat, I., van Eerten, H., & MacFadyen, A. 2013, ApJ, 773, 2 [Google Scholar]
- Goldwurm, A., David, P., Foschini, L., et al. 2003, A&A, 411, L223 [NASA ADS] [CrossRef] [EDP Sciences] [Google Scholar]
- Hopkins, A. M., Miller, C. J., Nichol, R. C., et al. 2003, ApJ, 599, 971 [Google Scholar]
- Jelínek, M., Štrobl, J., Hudec, R., & Polášek, C. 2021, GCN Circular, 29651 [Google Scholar]
- Kann, D. A., Klose, S., Zhang, B., et al. 2011, ApJ, 734, 96 [NASA ADS] [CrossRef] [Google Scholar]
- Kann, D. A., Jelinek, M., de Ugarte Postigo, A., et al. 2021a, GRB Coordinates Network, 29716 [Google Scholar]
- Kann, D. A., de Ugarte Postigo, A., Thoene, C. C., et al. 2021b, GRB Coordinates Network, 29653 [Google Scholar]
- Kann, D., de Ugarte Postigo, A., Thoene, C., et al. 2021c, GCN Circular, 29655 [Google Scholar]
- Kann, D. A., White, N. E., Ghirlanda, G., et al. 2024, A&A, 686, A56 [NASA ADS] [CrossRef] [EDP Sciences] [Google Scholar]
- Kennicutt, R. C., Oey, M. S., Zaritsky, D., & Huchra, J. P. 1993, Rev. Mex. Astron. Astrofis., 27, 21 [Google Scholar]
- Kobayashi, S., & Zhang, B. 2003, ApJ, 582, L75 [NASA ADS] [CrossRef] [Google Scholar]
- Koshut, T. M., Paciesas, W. S., Kouveliotou, C., et al. 1996, ApJ, 463, 570 [NASA ADS] [CrossRef] [Google Scholar]
- Kumar, P., & Zhang, B. 2015, Phys. Rep., 561, 1 [Google Scholar]
- Kuulkers, E., Ferringo, C., Kretschmar, P., et al. 2021, New Astron. Rev., 93, 101629 [CrossRef] [Google Scholar]
- Labanti, C., Di Cocco, G., Ferro, G., et al. 2003, A&A, 411, L149 [NASA ADS] [CrossRef] [EDP Sciences] [Google Scholar]
- Lebrun, F., Leray, J. P., Lavocat, P., et al. 2003, A&A, 411, L141 [NASA ADS] [CrossRef] [EDP Sciences] [Google Scholar]
- Li, L., Wu, X. -F., Huang, Y. -F., et al. 2015, ApJ, 805, 13 [Google Scholar]
- Liang, E. -W., Zhang, B. -B., Stamatikos, M., et al. 2006, ApJ, 653, L81 [Google Scholar]
- Liang, E. -W., Yi, S. -X., Zhang, J., et al. 2010, ApJ, 725, 2209 [NASA ADS] [CrossRef] [Google Scholar]
- Lipunov, V., Kornilov, V., Gorbovskoy, E., et al. 2021, GCN Circular, 29652 [Google Scholar]
- Lund, N., Budtz-Jorgensen, C., Westergaard, N. J., et al. 2003, A&A, 411, L231 [NASA ADS] [CrossRef] [EDP Sciences] [Google Scholar]
- Margutti, R., Bernardini, G., Barniol Duran, R., et al. 2011, MNRAS, 410, 1064 [NASA ADS] [CrossRef] [Google Scholar]
- Martin-Carrillo, A., & Hanlon, L. 2013, Proc. Sci., 176, 121 [Google Scholar]
- Mazaeva, E., Pozanenko, A., & Minaev, P. 2018, Int. J. Mod. Phys. D, 27, 1844012 [Google Scholar]
- Mereghetti, S., Götz, D., Borkowski, J., Walter, R., & Pedersen, H. 2003, A&A, 411, L291 [NASA ADS] [CrossRef] [EDP Sciences] [Google Scholar]
- Mereghetti, S., Gotz, D., Ferrigno, C., et al. 2021, GRB Coordinates Network, 29650, 1 [Google Scholar]
- Mészáros, P. 2006, Rep. Progr. Phys., 69, 2259 [CrossRef] [Google Scholar]
- Mészáros, P., & Rees, M. J. 1997, ApJ, 476, 232 [CrossRef] [Google Scholar]
- Metropolis, N., Rosenbluth, A. W., Rosenbluth, M. N., Teller, A. H., & Teller, E. 1953, J. Chem. Phys., 21, 1087 [Google Scholar]
- Minaev, P. Y., & Pozanenko, A. S. 2017, Astron. Lett., 43, 1 [Google Scholar]
- Minaev, P. Y., & Pozanenko, A. S. 2020, MNRAS, 492, 1919 [NASA ADS] [CrossRef] [Google Scholar]
- Minaev, P. Y., Grebenev, S. A., Pozanenko, A. S., et al. 2012, Astron. Lett., 38, 613 [Google Scholar]
- Minaev, P. Y., Pozanenko, A. S., Molkov, S. V., & Grebenev, S. A. 2014, Astron. Lett., 40, 235 [NASA ADS] [CrossRef] [Google Scholar]
- Molinari, E., Vergani, S. D., Malesani, D., et al. 2007, A&A, 469, L13 [NASA ADS] [CrossRef] [EDP Sciences] [Google Scholar]
- Paczyński, B. 1998, ApJ, 494, L45 [Google Scholar]
- Perley, D. A., Tanvir, N. R., Hjorth, J., et al. 2016, ApJ, 817, 8 [Google Scholar]
- Piran, T. 2004, Rev. Mod. Phys., 76, 1143 [Google Scholar]
- Planck Collaboration XVI. 2014, A&A, 571, A16 [NASA ADS] [CrossRef] [EDP Sciences] [Google Scholar]
- Revnivtsev, M. G., Sunyaev, R. A., Varshalovich, D. A., et al. 2004, Astron. Lett., 30, 382 [NASA ADS] [CrossRef] [Google Scholar]
- Sari, R., & Piran, T. 1995, ApJ, 455, L143 [Google Scholar]
- Sari, R., Piran, T., & Narayan, R. 1998, ApJ, 497, L17 [Google Scholar]
- Savaglio, S., Glazebrook, K., & Le Borgne, D. 2009, ApJ, 691, 182 [Google Scholar]
- Swenson, C. A., Roming, P. W. A., De Pasquale, M., & Oates, S. R. 2013, ApJ, 774, 2 [NASA ADS] [CrossRef] [Google Scholar]
- Tonry, J. L., Denneau, L., Flewelling, H., et al. 2018, ApJ, 867, 105 [NASA ADS] [CrossRef] [Google Scholar]
- Ubertini, P., Lebrun, F., di Cocco, G., et al. 2003, A&A, 411, L131 [NASA ADS] [CrossRef] [EDP Sciences] [Google Scholar]
- Vianello, G., Götz, D., & Mereghetti, S. 2009, A&A, 495, 1005 [NASA ADS] [CrossRef] [EDP Sciences] [Google Scholar]
- Volnova, A. A., Pozanenko, A. S., Gorosabel, J., et al. 2014, MNRAS, 442, 2586 [Google Scholar]
- Willmer, C. N. A. 2018, ApJS, 236, 47 [Google Scholar]
- Winkler, C., Courvoisier, T. J. -L., di Cocco, G., et al. 2003, A&A, 411, L1 [NASA ADS] [CrossRef] [EDP Sciences] [Google Scholar]
- Woosley, S. E. 1993, ApJ, 405, 273 [Google Scholar]
- Yi, S. -X., Xi, S. -Q., Yu, H., et al. 2016, ApJS, 224, 20 [NASA ADS] [CrossRef] [Google Scholar]
- Yi, S. -X., Yu, H., Wang, F. Y., & Dai, Z. -G. 2017, ApJ, 844, 79 [NASA ADS] [CrossRef] [Google Scholar]
- Zaninoni, E., Bernardini, M. G., Margutti, R., Oates, S., & Chincarini, G. 2013, A&A, 557, A12 [NASA ADS] [CrossRef] [EDP Sciences] [Google Scholar]
- Zhang, B. 2007, Chin. J. Astron. Astrophys., 7, 1 [NASA ADS] [CrossRef] [Google Scholar]
- Zhang, B., Kobayashi, S., & Mészáros, P. 2003, ApJ, 595, 950 [NASA ADS] [CrossRef] [Google Scholar]
- Zhang, B., Zhang, B. -B., Virgili, F. J., et al. 2009, ApJ, 703, 1696 [NASA ADS] [CrossRef] [Google Scholar]
Appendix A: Photometric measurements of the GRB 210312B optical afterglow
| exp. mid | filter | Texp. | mag | telescope |
|---|---|---|---|---|
| (seconds) | ||||
| Afterglow + both underlying objects measured as a single detection | ||||
| 34.67 | cr | 2×10 s | >19.5 | ASU 0.5m |
| 52.84 | cr | 10 s | 18.83±0.28 | ASU 0.5m |
| 64.07 | cr | 10 s | 18.86±0.29 | ASU 0.5m |
| 75.31 | cr | 10 s | 17.98±0.13 | ASU 0.5m |
| 86.54 | cr | 10 s | 18.37±0.19 | ASU 0.5m |
| 97.86 | cr | 10 s | 18.66±0.25 | ASU 0.5m |
| 120.1 | cr | 3×10 s | 19.21±0.19 | ASU 0.5m |
| 171.3 | cr | 2×10 s | 19.36±0.13 | ASU 0.5m |
| 255.5 | cr | 9×10 s | 19.79±0.13 | ASU 0.5m |
| 412.8 | cr | 10×20 s | 19.99±0.14 | ASU 0.5m |
| 721.9 | cr | 19×20 s | 20.31±0.09 | ASU 0.5m |
| 1384 | cr | 43×20 s | 20.63±0.09 | ASU 0.5m |
| 3208 | cr | 129×20 s | 20.97±0.10 | ASU 0.5m |
| 5370 | B | 600 s | 21.94±0.18 | CAHA 2.2m |
| 7508 | B | 5×90 s | 22.32±0.37 | OSN 1.5m |
| 3160 | g | 300 s | 21.18±0.08 | ASU 2.0m |
| 4405 | g | 300 s | 21.25±0.13 | ASU 2.0m |
| 6028 | V | 600 s | 21.58±0.12 | CAHA 2.2m |
| 8021 | V | 1283 s | 21.74±0.26 | OSN 1.5m |
| 2235 | r | 120 s | 21.00±0.19 | ASU 2.0m |
| 2490 | r | 120 s | 21.22±0.27 | ASU 2.0m |
| 2616 | r | 120 s | 20.95±0.18 | ASU 2.0m |
| 4713 | r | 300 s | 21.03±0.35 | ASU 2.0m |
| 5024 | r | 3×300 s | 21.28±0.28 | ASU 2.0m |
| 7524 | r | 60 s | 21.50±0.09 | GTC 10.4m |
| 2590280 | r | 12×600 s | 22.98±0.10 | ASU 2.0m |
| 6699 | RC | 600 s | 21.14±0.07 | CAHA 2.2m |
| 8317 | RC | 5×90 s | 21.48±0.17 | OSN 1.5m |
| 9426 | RC | 18×180 s | 21.48±0.14 | OSN 0.9m |
| 10200 | RC | 10×180 s | 21.50±0.09 | OSN 1.5m |
| 12030 | RC | 10×180 s | 21.64±0.09 | OSN 1.5m |
| 91500 | RC | 10×500 s | 22.89±0.11 | OSN 1.5m a |
| 209200 | RC | 32×120 s | >20.5 | AZT33 1.5m |
| 340400 | RC | 6×600 s | 23.27±0.20 | CAHA 2.2m |
| 2852 | i | 300 s | 20.64±0.10 | ASU 2.0m |
| 4097 | i | 300 s | 20.58±0.08 | ASU 2.0m |
| 4707 | IC | 600 s | 20.26±0.08 | CAHA 2.2m |
| 7376 | IC | 5×90 s | 20.78±0.11 | OSN 1.5m |
| 7392 | IC | 600 s | 20.68±0.11 | CAHA 2.2m |
| 3787 | z | 300 s | 20.19±0.20 | ASU 2.0m |
| The afterglow only (image subtraction) | ||||
| 17480 | r | 240 s | 23.00±0.15 | GTC 10.4m |
| 91500 | RC | 10×500 s | 24.93±0.35 | OSN 1.5m |
Notes. Magnitudes are not corrected for Galactic extinction. They are given in their native systems: Pan-STARRS griz magnitudes are AB, BVRCIC are in Vega.
the host galaxy contribution was removed by image subtraction and photometry of the pure afterglow is shown at the lowest part of the table.
All Tables
Parameters of the two-component model (forward shock + early flare) fitted to the GRB 210312B optical afterglow using MCMC sampling.
Photometric measurements of the GRB 210312B host galaxy and its companion south of the afterglow position.
All Figures
|
Fig. 1. Top panel: Discovery image from the Ondřejov 0.5 m telescope. The optical afterglow of GRB 210312B is marked. The image covers 10′ per side. Bottom panel: gri image (value inverted) from the 2×8.4 m LBT telescope. The location of the optical afterglow of GRB 210312B is marked. The double structure of the underlying object is clearly visible. This image has a dimension of 1.5′×1.5′. |
| In the text | |
|
Fig. 2. Sky image (S/N map) within the IBIS/ISGRI FoV obtained during the primary pulse of GRB 210312B (2.4 s). Coordinates are Galactic. GRB 210312B was the only source detected in the field (at a S/N level of 19.1σ). The crosses indicate positions of known persistent X-ray sources (not detected in this short exposure). |
| In the text | |
|
Fig. 3. 20–100 keV count rate history recorded by the IBIS/ISGRI detector with a time resolution of 1.0 s (green histogram) and the corresponding light curve of GRB 210312B reconstructed through the mask decoding (black histogram) with the background subtracted and the dead time corrected. The vertical dotted lines show time intervals used for image and spectral reconstruction for the GRB precursor (1), intermediate (2), and primary (3) pulses. |
| In the text | |
|
Fig. 4. Masked light curves of GRB 210312B obtained in different energy bands with the INTEGRAL IBIS/ISGRI and JEM-X telescopes. The time resolution is 0.5 s. The vertical dashed lines show the time intervals used for image and spectral reconstruction for the main pulse and precursor. |
| In the text | |
|
Fig. 5. Detection of the burst by INTEGRAL during the primary pulse (a) and precursor (b) phases. Shown are S/N maps of the sky region |
| In the text | |
|
Fig. 6. Broadband spectrum measured during the main pulse (blue line and open circles) and precursor (green line and filled circles) phases of GRB 210312B as measured with the INTEGRAL IBIS/PICsIT IBIS/ISGRI and JEM-X telescopes. The best fits with the CPL model are shown with solid lines. |
| In the text | |
|
Fig. 7. T90,i – EH diagram for type I GRBs (blue squares), type II GRBs (red circles), and SGR giant flares (unfilled magenta squares) with corresponding cluster analysis results. The 1σ and 2σ cluster regions are shown with bold solid and thin dashed curves of the corresponding colors. GRB 210312B is shown as an unfilled black circle. |
| In the text | |
|
Fig. 8. GRB 210312B in the Amati correlation plane. The location of the main pulse is marked. The correlations for long GRBs (Type II; red), short GRBs (Type I; blue), and SGR giant flares (purple) are shown with their respective 3σ confidence regions. |
| In the text | |
|
Fig. 9. Optical light curve of GRB 210312B. The data points show different filter measurements converted to the r-band equivalent using the spectral slope derived from our model fit. The solid lines show the best-fit model (red) with 68% confidence intervals (shaded regions) decomposed into its constituent components: forward shock (blue) and an early flare (green) emission. The dashed gray line indicates the host galaxy brightness. The model simultaneously fits both the temporal evolution and spectral behavior, properly accounting for the host galaxy contribution in measurements where it was not subtracted through image analysis. The residuals in the bottom panel demonstrate the quality of the fit. For model parameters, see Table 1. |
| In the text | |
|
Fig. 10. Spectral energy distribution of GRB 210312B and the residuals from the temporal and spectral fit model presented in Fig. 9. The points show the data after the temporal evolution is removed, revealing the intrinsic spectral shape. The griz photometric measurements of both host galaxy components are shown (points), along with a representative galaxy template spectrum (solid line) for comparison. The dashed line shows our simplified model of the host system used for host contribution corrections during afterglow fitting. |
| In the text | |
|
Fig. 11. Top: Spectrum obtained with OSIRIS at the 10.4 m GTC. The 2D and 1D extractions are shown, and the detected features are indicated. Bottom: Line strength diagram obtained from the spectra of GRB 210312B. |
| In the text | |
Current usage metrics show cumulative count of Article Views (full-text article views including HTML views, PDF and ePub downloads, according to the available data) and Abstracts Views on Vision4Press platform.
Data correspond to usage on the plateform after 2015. The current usage metrics is available 48-96 hours after online publication and is updated daily on week days.
Initial download of the metrics may take a while.