Fig. 3.
Download original image
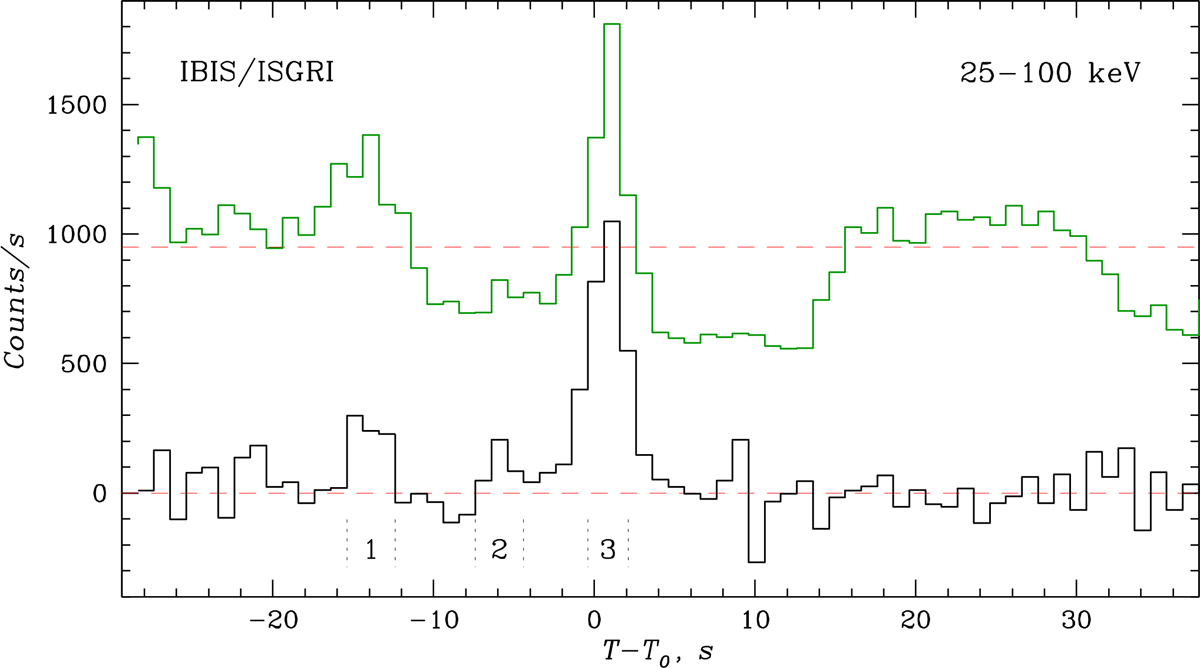
20–100 keV count rate history recorded by the IBIS/ISGRI detector with a time resolution of 1.0 s (green histogram) and the corresponding light curve of GRB 210312B reconstructed through the mask decoding (black histogram) with the background subtracted and the dead time corrected. The vertical dotted lines show time intervals used for image and spectral reconstruction for the GRB precursor (1), intermediate (2), and primary (3) pulses.
Current usage metrics show cumulative count of Article Views (full-text article views including HTML views, PDF and ePub downloads, according to the available data) and Abstracts Views on Vision4Press platform.
Data correspond to usage on the plateform after 2015. The current usage metrics is available 48-96 hours after online publication and is updated daily on week days.
Initial download of the metrics may take a while.