| Issue |
A&A
Volume 684, April 2024
|
|
|---|---|---|
| Article Number | L2 | |
| Number of page(s) | 8 | |
| Section | Letters to the Editor | |
| DOI | https://doi.org/10.1051/0004-6361/202346336 | |
| Published online | 29 March 2024 | |
Letter to the Editor
INTEGRAL view of GRB 221009A
Prompt energetics and week-long hard X-ray afterglow
1
University of Geneva, Department of Astronomy, Chemin d’Ecogia 16, Versoix 1290, Switzerland
e-mail: This email address is being protected from spambots. You need JavaScript enabled to view it.
2
École Polytechnique Fédérale de Lausanne, Lausanne, Switzerland
3
National Institute of Astrophysics, IAPS, Rome 00133, Italy
4
IRAP, Toulouse, France
5
Istituto Nazionale di Astrofisica, Istituto di Astrofisica Spaziale e Fisica Cosmica di Milano, Via A. Corti 12, 20133 Milano, Italy
6
Scuola Universitaria Superiore IUSS Pavia, Piazza della Vittoria 15, 27100 Pavia, Italy
7
Université Paris-Saclay, Université Paris Cité, CEA, CNRS, AIM, 91191 Gif-sur-Yvette, France
8
School of Physics, University College Dublin, Belfield, Dublin 4, Ireland
9
European Space Agency (ESA), European Space Research and Technology Centre (ESTEC), Keplerlaan 1, 2201 AZ Noordwijk, The Netherlands
Received:
6
March
2023
Accepted:
26
October
2023
Abstract
The gamma-ray burst GRB 221009A is among the most luminous of its kind and its proximity to Earth has made it an exceptionally rare observational event. The International Gamma-ray Astrophysics Laboratory (INTEGRAL) was in an optimal aspect position to use its all-sky instruments for recording the prompt emission and early gamma-ray afterglow in unprecedented detail. Following the initial detection, a swiftly scheduled follow-up observation allowed for the hard X-ray afterglow time and spectral evolution to be observed for up to almost a week. The INTEGRAL hard X-ray and soft gamma-ray observations have started to bridge the energy gap between the traditionally well-studied soft X-ray afterglow and the high-energy afterglow observed by Fermi/LAT. We discuss the possible implications of these observations for follow-ups of multi-messenger transients with hard X-ray and gamma-ray telescopes.
Key words: gamma rays: general / X-rays: bursts
© The Authors 2024
 Open Access article, published by EDP Sciences, under the terms of the Creative Commons Attribution License (https://creativecommons.org/licenses/by/4.0), which permits unrestricted use, distribution, and reproduction in any medium, provided the original work is properly cited.
This article is published in open access under the Subscribe to Open model. This email address is being protected from spambots. You need JavaScript enabled to view it. to support open access publication.
1. Introduction
Gamma-ray bursts (GRBs) are brief and extremely energetic explosions that occur in the Universe at the large range of redshifts, detected at cosmological distances up to a redshift of about 9.3 and spectroscopically confirmed at 8.2 (Campana et al. 2022). The rate of GRBs per galaxy is about one some millions of years (Yonetoku et al. 2004; Paczynski 1991) and likely to be even more frequent at high redshifts, owing to different galaxy properties at different redshifts (Springel et al. 2005). They are the most luminous electromagnetic events known to occur in the universe, caused by the collapse of a massive star or the merger of two neutron stars launching collimated ultra-relativistic jets. There is some uncertainty on the exact nature of the mechanisms transforming jet energy into the bright gamma-ray emission, as well as on the structure and the degree of collimation of the jet (e.g., Salafia & Ghirlanda 2022).
The spectra of GRB prompt emission were originally described as broken power laws, peaking in the sub-MeV energy range (Band et al. 1993). The prompt emission is usually followed by an afterglow with a softer (as compared to prompt emission) power-law energy spectrum. Furthermore, Fermi/GBM observations have expanded the energy range both below (with GBM, von Kienlin et al. 2020) and above (with LAT, Ajello et al. 2019) the peak of the SED, revealing an additional broad-band power-law component over the course of prompt emission. The spectrum of this component resembles that of the subsequent afterglow. Recent observations at TeV energies with Cherenkov telescopes (MAGIC Collaboration 2019; Abdalla et al. 2019) have revealed a secondary peak, making it increasingly similar to “classical” jet spectra found in blazars (Fossati et al. 1998). The picture is complicated by the occasional presence of very bright optical emission (sometimes observable by the naked eye, as in the case of GRB 080319B Bloom et al. 2009, bright X-ray afterglow Martin-Carrillo et al. 2014), or photospheric emission components (e.g., Ryde et al. 2010).
In extreme cases, the afterglow has been detected up to 60 keV with BeppoSAX (in’t Zand et al. 2001; Maiorano et al. 2005; Corsi et al. 2005) for several hours after the burst. NuSTAR demonstrated its capacity to follow-up exceptional gamma-ray bursts with a relatively short delay of about one day (Maselli et al. 2014; Kouveliotou et al. 2013; Campana et al. 2021). INTEGRAL is well suited to observe the hard X-ray afterglow as long as the event happens to be in the field of view (FoV) of the instruments, as in the case of GRB 120711A (Martin-Carrillo et al. 2014), or through a rapid follow-up target-of-opportunity program. Above about 50 MeV, afterglow measurements have been provided by Fermi/LAT (Ajello et al. 2019). However, it remains quite unclear what is the shape of the spectrum in the elusive MeV energy range between ∼60 keV and ∼50 MeV. As of now, hard X-ray and soft gamma-ray instruments are not sensitive enough to detect afterglow of typical GRBs and they only achieve detections in cases of bright and nearby events, such as GRB 120711A (further benefiting from serendipitous INTEGRAL pointing), GRB 130427A, and now GRB 221009A.
The separation between the prompt emission and afterglow is not always straightforward, especially when considering different energy ranges and components. In particular, the GeV-range and hard X-ray afterglow components appear to start well within the prompt phase (Ghisellini et al. 2010; Martin-Carrillo et al. 2014; Zhang et al. 2023). Additionally, is not clear whether there are only two basic contributions to the GRB emission (internal shocks for the prompt and variable parts, along with an external shock for the afterglow) or whether there are other contributions such as late time engine activity, as in the case of newly born magnetars or delayed accretion.
The sequence of events that lead to observations of GRB 221009A in greater detail was somewhat unusual. Due to its brightness and location in the Galactic plane, it was originally believed to be a new galactic transient (Dichiara et al. 2022; Williams et al. 2023). Once the redshift was measured, it became clear that it was, in fact, an unusually rare GRB (Atteia 2022), so much so that the chance of it having occurred in the 20 years of the INTEGRAL lifetime is only about 0.2%, assuming a GRB waiting time of 10 000 years (Burns et al. 2023).
In this Letter, we describe the main results obtained by INTEGRAL observations of this event. In Sect. 2, we describe our observations. In Sect. 3, we provide our methods of analysis. In Sect. 4, we present our results, followed by a discussion in Sect. 5.
2. Observations
INTEGRAL (Winkler et al. 2003; Kuulkers et al. 2021) is a space observatory designed to observe celestial gamma-ray sources. Launched into orbit in 2002, it is operated by the European Space Agency (ESA). INTEGRAL is equipped with several coded mask instruments, allowing it to study emission across a broad energy range, from 3 keV to 10 MeV, namely: with PICselated CsI Telescope (PICsIT, Labanti et al. 2003), INTEGRAL Soft Gamma-Ray Imager (Lebrun et al. 2003; ISGRI), Spectrometer aboard INTEGRAL (Vedrenne et al. 2003; SPI), and two modules of X-ray monitor aboard INTEGRAL (Lund et al. 2003; JEM-X). This results in a relatively large FoV of 100 to 1000 deg2 (up to 2% of the sky). These instruments are complemented by an optical monitor camera (OMC, Mas-Hesse et al. 2003). If a GRB occurs in the instruments’ FoV, it can be detected and localized at an approximate arcmin level by the INTEGRAL Burst Alert System (IBAS, Mereghetti et al. 2003), one of the fastest GRB detection pipelines currently in operation, owing to the continuous transmission of the data in real time to the ground and to ISDC (Courvoisier et al. 2003).
Furthermore, INTEGRAL has active anti-coincidence and veto shields (SPI-ACS and IBIS/Veto) to protect its sensitive imaging instruments from off-axis background particles and photons. These shields are themselves particularly large detectors and have the capacity to store count rate histograms, thus providing additional measurement channels. This potential for the “off-label” use of INTEGRAL active shields was recognized to a limited degree early in the mission and an additional IBAS subsystem was created for SPI-ACS (Mereghetti et al. 2003). More recently, it was shown that most of the INTEGRAL instruments can be used together to provide competitive sensitivity to impulsive events from the whole sky (Savchenko et al. 2017a).
The INTEGRAL ground segment supports nowadays rapid follow-up target-of-opportunity (ToO) programs, allowing for reaction times within a few hours (e.g., in the case of GW 170817, Savchenko et al. 2017b).
INTEGRAL observations usually consist of individual pointings, up to about one hour long, separated by several minute-long slews. At the time of GRB 221009A (2022-10-09 13:17:00 – T0 hereafter), INTEGRAL was pointing at RA, Dec (J2000.0) = 261.1°, −41.0°. The burst had an off-axis angle θ = 65.8° and an azimuthal angle ϕ = −110.2° (computed from the direction of SPI to IBIS). This pointing (ID 255800290010) was interrupted at T0 + 195 s, for a slew that lasted until T0 + 311 s, when the next pointing was reached and remained stable until T0 + 2312 s. The new pointing direction (RA, Dec = 261.1°, −43.1°) resulted in a negligible change in the instrument’s response to the GRB signal. The off-axis angle θ (well below 80°) allowed the signal to reach IBIS above its shallow active shield (IBIS/Veto), and also the angle ϕ with respect to the SPI-IBIS direction favors the detection in IBIS. The SPI germanium detectors, well protected by the SPI-ACS acting both as passive material and active veto, usually do not contribute to the all-sky observations. However, they provided useful data for this exceptionally bright event, for which the attenuation is an advantage, since it brought the flux to a measurable level. The SPI-ACS did not produce a real-time IBAS trigger, since the background treatment and event vetoing were not suitable to accommodate the circumstances of this event. However, since the INTEGRAL instruments (except for the optical monitor OMC) do not change data-taking mode in response to sky triggers, the maximum available information was recorded by both instruments sensitive to all-sky signals: SPI-ACS and IBIS/Veto. For more details on the all-sky response of the different INTEGRAL instruments, we refer to Savchenko et al. (2017a).
Since 2015, INTEGRAL has been on a highly elongated 2.7 day long orbit. Near the time of the event, it was at a large distance from Earth (137.6 thousand kilometers), far from the radiation belts, allowing for stable background conditions. This permitted to observe the early hard X-ray and gamma-ray afterglow immediately after the GRB prompt signal, even before the dedicated ToO observations started. During this early phase, INTEGRAL continued to observe the same region until the end of the satellite’s revolution around the Earth, maintaining the consistent response of the all-sky detectors to GRB 221009A see Fig. 1. Overall, it was between T0 −0.1 and 0.1 days since T0 that the response of SPI-ACS shifted by no more than 30% (see lower panel of Fig. 3).
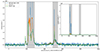 |
Fig. 1. GRB 221009A prompt emission light curves (background-subtracted) as recorded by INTEGRAL instruments: SPI, SPI-ACS, and IBIS/PICsIT. All rates except for SPI-ACS are normalized to match the SPI-ACS rate. The SPI-ACS rate is affected by saturation for count rates above about 1.8 × 10⁶ counts s−1 and for PICsIT by the INTEGRAL buffer limit. Inset shows the different count rate range (in the same time range), highlighting combined SPI (Germanium detectors) rate (only moderately affected by dead-time), giving some insight on the true intensity of the primary emission episode comparing to the rest of the signal. Vertical dashed lines represent boundaries of the INTEGRAL pointings (see details in Sect. 2). Gray shaded regions represent emission episodes used for estimating fluence. |
The dedicated and pointed ToO observations were started for INTEGRAL revolution 2558 at T0 + 91 ks (2022-10-10 14:31:40), only a few hours after the ToO was requested. This is the fastest reaction to ToO ever implemented by INTEGRAL. Data collection ended at T0 + 137 ks (2022-10-11 03:18:20), before the entrance into the radiation belts. Subsequently, observations during two more revolutions (2559 and 2560) were performed, from T0 + 176 ks to 299 ks (2022-10-11 14:08:20 to 2022-10-13 00:18:20) and from T0 + 459 ks to 572 ks (2022-10-14 20:45:00 to 2022-10-16 04:08:20), respectively. Unfortunately, due to angular momentum constraints (see Kuulkers et al. 2021), INTEGRAL could not stay on target continuously, so it was only able to observe the target for 58% of the time in the quoted time period.
After the end of the dedicated ToO observations, INTEGRAL serendipitously observed the position of GRB 221009A between T0 + 1325 ks to 2969 ks (2022-10-24 21:18:20 and 2022-11-12 21:58:20), for a total on-source time of 137.7 ks.
3. Analysis
All of the INTEGRAL results except for PICsIT and the dedicated SPI observations during the ToO were derived using the Multi-Messenger Online Data Analysis (MMODA) platform (Neronov et al. 2021). The platform provides standard analysis threads for INTEGRAL data as described by Neronov et al. (2021), with leveraging based on the OSA 11.2 software package distributed by the INTEGRAL Science Data Centre, ISDC (Courvoisier et al. 2003).
The SPI-ACS data consist of a light curve of all the incident counts binned at 50 ms. Although no directional or energy information is available, it allows us to obtain an uninterrupted coverage of the burst at energies above > 75 keV, starting from the prompt phase and extending into the early afterglow (see Fig. 1).
During the prompt GRB phase, the SPI Germanium detectors (GeD) are protected from the GRB flux by the ACS. The very high anti-coincidence rate essentially leaves no usable events in the SPI telemetry. However, SPI also records the history of the detector hits before anti-coincidence filter in continuous 1 s long bins. There are two counters: for depositions below and above 8 MeV (called “non-saturating” and “saturating” events, respectively, as they affect SPI differently1). They are recorded separately for each of the 19 GeV detectors (see Fig. 2). The signal arriving to these detectors is very significantly attenuated by the SPI-ACS material and this appears to be an important advantage for this observation, since it allows us to get an insight on the temporal evolution near the highest count rates. At least two effects contribute to the saturation of the SPI detector rate: the electronic time window and the saturating events count rate. They result in a dead time of > 30% at the peak rate observed in the GRB (∼10 000 count s−1).
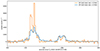 |
Fig. 2. SPI GeD detector rates (summed over all detectors), strongly attenuated by SPI-ACS material. The high-energy (above 8 MeV) rate counter highlights very hard narrow pulses (see details in Sect. 2). The two rates are scaled to make the count rate in the 250−270 s time interval is the same height between two rate curves. This figure demonstrates clear detection of the prompt emission above 8 MeV, and the reveals that the first of the two pulses shown is considerably harder, in agrement with Konus-Wind observations (Frederiks et al. 2023). |
Optimal detections with SPI can be achieved by combining the data from the INTEGRAL revolutions 2558 and 2559, spanning from 91 ks to 137 ks for a total exposure of 172.0 ks.
The Veto shield of IBIS (IBIS/Veto) protects the detector plane from the bottom and from the sides. It records the rate in continuous 8 s long bins. However, the counters are subject to overflow, making it quite difficult to use the resulting light curves in our observations. Therefore, we do not use IBIS/Veto to measure the GRB count rate, but only to constrain the background evolution for assessing early afterglow properties (see above).
During the prompt GRB phase, IBIS/ISGRI event data are highly discontinuous and mostly not usable. This is caused by the limited size of the buffers on-board INTEGRAL. However, the INTEGRAL housekeeping data include histograms of the total ISGRI Raw Rate. These rates are integrated over 1 s long time intervals sampled every 8 s. They are summed over all pixels over each of the eight ISGRI Modular Detection Units (MDUs) before IBIS Veto is applied and are only affected by a MDU deadtime of 60 μs (Lebrun et al. 2003). Therefore, even the extreme count rate of GRB 221009A was still about a factor two below the deadtime-limited rate for most of the time. However, since the rate is distributed unequally between the MDUs, at the main peak (at around T0 + 230 s), it reaches the deadtime-limited regime, making a flux estimation complicated.
The IBIS/PICsIT spectral-timing data have a standard time resolution of 7.8-ms with eight channels covering the 200−2600 keV energy range. Data dropouts are present when the SPI-ACS count rate is highest due to INTEGRAL’s limited onboard buffer. These bad time intervals (BTIs) were found by searching for periods with three (or more) missing time bins. For further analyses of PICsIT data of GRB 221009A, we refer to Rodi & Ubertini (2023).
The IBIS Compton mode events are derived as coincidences between ISGRI and PICsIT events (both for the background and sources) within a 3.81 μs time window. However, a non-negligible fraction of them are random coincidences, especially in the case of very high flux. This condition complicates IBIS Compton mode data analysis and we avoid using them in this work.
For most purposes, we treat the results of the two JEM-X units separately, since their gain calibrations differ, as is also evident from their light curves, especially in the first day of the observation. The reflection of the initial bright GRB pulse on the interstellar dust clouds arrived with a delay in the form of expanding dust scattering rings (Tiengo et al. 2023). As the INTEGRAL coded-mask instruments are not able to spatially resolve the rings, their flux contributes to the observed afterglow emission and had to be taken into account. At the early time of the dedicated ToO observations, up to 20% of the 3−20 keV flux comes from the contribution of these rings. Therefore, in our analysis, we excluded a constant flux of 10−11 erg cm−2 s−1 in the interval 1 up to 1.7 days from T0 from the INTEGRAL observation to extract the true afterglow properties.
The IBIS Compton mode in principle allows to pose constraints on the polarization of the prompt emission (Götz et al. 2019). Considering that GRB 221009A provides the largest number of Compton mode events (over 70 000) among all GRBs detected in the IBIS Compton mode, any constraint (at least on the polarization variability) is likely to be quite useful. However, the off-axis observation at high angle (of 65.8°) poses challenges for the Compton mode polarization analysis and a sufficiently detailed investigation goes beyond the scope of this Letter.
4. Results
4.1. Temporal properties
The SPI-ACS light curve (Fig. 1) is saturated only for count rates larger than 1.8 × 10⁶ counts s−1 that are reached during the brightest part of the GRB, in the time interval of T0 + 220 s–T0 + 266 s. After the GRB prompt emission subsides, the SPI-ACS can still characterize the afterglow emission, thanks to the relatively stable background. We fitted different models of a fourth-order polynomial background to the SPI-ACS data and used the range of possible background-subtracted count rates as an additional source of uncertainty on the rate. The selection of background models was constrained by considering rates in the background-dominated housekeeping data, such as IBIS/Veto. Also, SPI-ACS can reliably (with S/N over 3) detect the early afterglow until about T0 + 2 h. Similarly to SPI-ACS, the IBIS/PICsIT data are also useful in the early afterglow phase, revealing a detection until about T0 + 1 h. The prompt GRB light curve obtained with the SPI GeD detectors is rather different from that measured by the SPI-ACS, displaying the primary flux episode (at around T0 + 230 s) at more than an order of magnitude higher than the second one at T0 + 520 s (see Fig. 3, inset).
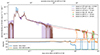 |
Fig. 3. GRB 221009A prompt emission and afterglow lightcurve (top). All count rates are converted to a spectral energy density at 50 keV assuming powerlaw spectrum with a slope of −2. This spectrum is applicable for the afterglow, but implies that the prompt lightcurve in this plot is only indicative. Note: the “all-sky” observations are also available between 0.1 and 1 days after the event, but the uncertainty due to the remaining background variations does not allow for a measurement to be made within this time range. The gray dashed line represents a fit with a single powerlaw, acceptable given the response uncertainties. Red dashed line represent best fit model, consisting of powerlaw segments with two breaks. For details about the fitting see explanations in the text. GRB 221009A position relative to INTEGRAL spacecraft orientation, relevant for changes of the instrument response throughout the emission phases (bottom). The gray band indicates the range of orientations when the response changes by no more than 30%. The green band represents approximate FoV of INTEGRAL instruments. |
To estimate a lower limit to the total fluence of about the GRB, we make use of the fact that T0 + 490 s to 550 s episode is not saturated in SPI-ACS and all data are not saturated in SPI GeD, with only limited deadtime effects. We assume the average GRB spectrum as detected by Konus-Wind (Frederiks et al. 2023): Band model with α = −0.89, Ep = 2660 keV, β = −2.21 with SPI-ACS data to derive fluence of the T0 + 490 s to 550 s episode at the level of 2.9 × 10⁻³ erg cm−2. Then, we used SPI GeD data to compute ratio of total counts between T0 + 200 s to 290 s and T0 + 490 s to 550 s episodes: the first episode is 31 times brighter as seen by SPI GeD. Assuming that the energy spectrum between the two peaks does not differ too much in a way that would have a large effect on the ratio between SPI GeD and SPI-ACS count rates, we can estimate the total fluence of the GRB at the level of 9.1 × 10⁻² erg cm−2. This is higher than the preliminary estimate of Gotz et al. (2022) and it is closer to the value measured with Konus-Wind (Frederiks et al. 2023; Burns et al. 2023).
Accumulating data collected from the dedicated ToO observations in revolutions 2558 and 2559, SPI provided only a weak detection with a signal-to-noise ratio (S/N) of ∼2.6 in the 20−50 keV energy range. Over the entirety of the dedicated ToO observation, 91 ks to 572 ks (2022-10-10 14:31:40 to 2022-10-16 04:08:20), IBIS/ISGRI detects GRB 221009A, with a S/N of 13.5 in the energy range 28−80 keV. ISGRI also detects the GRB separately in each of the first individual INTEGRAL revolutions (2558 and 2559), with a S/N 13.9 and 8.3 respectively, but not in INTEGRAL revolution 2560. JEM-X has detected GRB 221009A for the longest time. The last significant measurement from combining both JEM-X units was found for revolution 2560 of the ToO observation at T0 + 6.6 days at the level of S/N = 4.5.
To characterize the overall GRB afterglow light curve, we explored the parameter space for different model light curves compatible with the INTEGRAL data. For this analysis, we used the Python implementation of the ensemble sampler for Markov chain Monte Carlo (MCMC) emcee (Foreman-Mackey et al. 2013). We assumed a constant average energy spectrum as discussed in the next subsection. We found that the entire afterglow emission evolution from 1000 s to 7 days after T0 can be satisfactorily described by a single power law with a decay slope of −1.37 , assuming intercalibration systematics of 30% (see Fig. 3).
A possible jet break at T0 + 79 000 s, as reported by Williams et al. (2023) and others, falls in between our “all-sky” early afterglow measurements and the dedicated ToO observations of the late afterglow. As noted above, between these two measurements there is an uncertainty in the inter-calibration constant between the instruments. Therefore, this may affect our measurements of the global afterglow, as well as the possible presence or not of a break in the light curve in our observations.
However, assuming our inter-calibration is correct, a twice-broken power law model can be fit to the afterglow light curve. Fitting this model results in breaks at 17 ks and 113 ks and temporal decay slopes −1.81 , −0.5
 , −1.8
 (ordered in time), as shown in Fig. 3. Fitting a power-law shape to the early afterglow light curves (SPI-ACS and PICsIT) results in a temporal decay slope of −1.81
 . Fitting the same temporal decay model to the JEM-X and IBIS ToO data set separately, we find a slope of −1.6
 .
.
Despite the apparently smooth power-law evolution of the afterglow emission, it is possible that short-time scale flares maybe have been averaged out. The INTEGRAL dedicated ToO observations offer a uniquely high coverage (58%) combined with high temporal resolution (in principle, down to 60 μs Kuiper et al. 2003), in the week after the prompt GRB. We searched for short magnetar-like bursts at timescales of 0.2 s and 1 s and did not find any, setting the upper limit at the level of 10−8 erg cm−2 (3σ) for any burst shorter than 1 s.
4.2. Spectral properties
The joint JEM-X and ISGRI spectra (Fig. 4) in the first INTEGRAL revolution (91 ks to 137 ks) can be satisfactorily modeled between 3 and 80 keV by a single power-law of slope −2.07 (90% confidence), with an average flux of 5.6
 erg cm−2 s−1 (3−200 keV). Combining ISGRI and JEM-X with the SPI spectrum in revolutions 2558 and 2559 (91 ks to 299 ks), the spectrum can be modeled by a powerlaw of slope −1.97
 (90% confidence) with a flux of 3.2
 erg cm−2 s−1 (3−200 keV). The spectra are shown in Fig. 4.
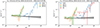 |
Fig. 4. Deconvolved INTEGRAL spectra of the afterglow emission. When data points have negative mean value, a 3-σ upper limit is shown instead. Gray line represents the best fit model and the gray band – model envelope of 90% confidence range. IBIS/ISGRI and JEM-X spectra from 91 ks to 137 ks since T0 (2022-10-10 14:31:40 to 2022-10-11 03:18:20) for a total exposure of 53.0 ks (top). IBIS/ISGRI, JEM-X and SPI spectra from 91 ks to 299 ks since T0 (2022-10-10 14:31:40 to 2022-10-13 00:18:20) for a total exposure of 172.0 ks (bottom). Note: the time intervals actually usable for spectral extraction by all instruments in each particular spectrum differs slightly (by tens of minutes) from the total observation time. Since differences are small relative to the observation duration, the implications of these differences for the analysis results are negligible. |
GRB 221009A provides a unique opportunity to use the gamma-ray spectrometer SPI to search for line features in the spectra. In particular, SPI provides the best available constraint on any emission related to positron annihilation. The (3σ) upper limit determined in the 340 to 516 keV energy band (selected to optimize the sensitivity to the annihilation signal) between 91 ks and 137 ks is at the level of 1.2 × 10⁻⁹ erg cm−2 s−1.
Optimal observation with SPI can be achieved by combining first two revolutions spanning from 91 ks to 299, this observation can be fit with a powerlaw of slope −1.97 (90% confidence), with a flux of 3.2
 erg cm−2 s−1 (3−200 keV). We did not detect any spectral evolution in the follow-up observations, although as the afterglow decays and the precision of measurement is lowered, our capacity to constrain spectral changes becomes limited.
5. Discussion
The hard X-ray afterglow energy spectrum between about 1 day and 1 week as measured by INTEGRAL can be reliably derived from the dedicated ToO observations, and is described by a single powerlaw with a slope of −2. It is compatible with Swift/XRT, MAXI (Williams et al. 2023), NuSTAR, and HXMT (Kann et al. 2023) observations and suggests a single spectral component extending from soft X-rays to almost 200 keV in the first days and 20 keV at week 1, with no evidence for a cut-off.
As further broadband modeling of GRB 221009A suggests a possible break at 20 MeV (Laskar et al. 2023), it has not been ruled out that the spectral component may extend throughout the “MeV” energy range. Extrapolation of INTEGRAL observations is consistent with observations of GeV afterglow reported in Laskar et al. (2023), given the uncertainties in the spectral shape.
Despite the current absence of a sensitive MeV instrument, INTEGRAL is able to provide data points in the afterglow SED that could, in principle, constrain the emission region properties. In particular, we disfavor any models predicting a cut-off in INTEGRAL’s accessible energy range. However, we note that further constraints may be achieved by a combined analysis of the available multi-wavelength data of GRB 221009A.
We did not find any evidence for gamma-ray line features in the energy spectra, including those resulting from annihilation. The latter constrains the total mass of positrons annihilating in the ejecta into photons that manage to escape the environment and moving with large bulk Lorentz factor to be less than 6.1 × 10⁻³ M⊙. However, this value should be taken with caution, since as the emission region is moving relativistically and the annihilation line should, in principle, be broadened and possibly boosted to higher energy (Ioka et al. 2007; Furlanetto & Loeb 2002).
The INTEGRAL observation of the afterglow is split in two segments, namely: the “all-sky” detector record continuously following the prompt GRB until T0 + 3 h and the dedicated ToO observations starting at T0 + 1 d. At early times (up to 3 h after the GRB), we find a decay slope (−1.81 ) similar to that found by Konus-Wind (−1.69, see Frederiks et al. 2023). At later times, the value we find for the decay with a slope of −1.6
 compatible with soft X-ray observation of −1.672 (Williams et al. 2023). Our fit to the entire afterglow light curve should be taken with caution, since the energy range corresponding to the early afterglow (above about 100 keV) is systematically higher than that used in the dedicated ToO observation (3−80 keV) and the comparison depends on the assumption about the spectrum, as described in Sect. 4.
Finally, we searched for any short (< 1 s) impulsive deviations from the powerlaw decay in the high-coverage INTEGRAL observations. As we did not find any, we set a constraining upper limit. We note that this kind of burst could be expected in association with delayed GRB engine activity.
GRB 221009A might be associated with a supernova and hence be a collapsar event (de Ugarte Postigo et al. 2022), although sensitive JWST observations do not seem to confirm or reject this conjecture (Shrestha et al. 2023). If it is a collapsar, its gravitational-wave (GW) signature must be detectable from about 20 Mpc (Abbott et al. 2020; Szczepańczyk et al. 2023; Morozova et al. 2018), which is much less than the observed distances of 726 Mpc (Pannarele 2022). However, short GRBs, some which are known to be caused by a binary neutron star merger (Abbott et al. 2017a,b; Savchenko et al. 2017b), are also known to have very similar high-energy afterglows; an example of this is GRB 090902B (Abdo et al. 2009). This may imply that the origin of the hard X-ray properties described in this Letter could arguably be applied to the jets launched in these short GRBs, accounting for the difference in luminosity. A detailed analysis of the implications is beyond the scope of this work.
It is now well understood that a GRB jet is often structured (e.g., Li et al. 2023), namely, that it carries a non-negligible amount of material and power outside of the main collimated cone, and, hence, it is also producing emission at larger angles. Furthermore, as the jet expands in the medium, it decelerates, eventually becoming less collimated. The moment when the jet viewing angle is equal to the inverse gamma-factor corresponds to a change of luminosity, the so-called “jet break”, when the observer starts to see the edge of the jet. At this time, the GRB can be seen from wider range of angles.
The angular distribution of the GW emission for the source models is a lot less beamed (Droz & Poisson 1997) than the initial gamma-ray flash and most of the GW transients will be observed at an off-axis angle larger than typical opening angle of a GRB jet, of few degrees (e.g., Goldstein et al. 2016). Both the emission from jet structure beyond the main cone emission and post-jet-break emission can be observed from larger range of off-axis angles than the prompt flash. This emission can still have a hard X-ray contribution that is not dissimilar to that observed in GRB 221009A at later times (although the latter is much weaker).
The jet of GRB 221009A was possibly structured, since the jet break shape does not display a good fit to a simple top-hat jet model (Williams et al. 2023; O’Connor et al. 2023; Gill & Granot 2023; Laskar et al. 2023, who instead interpreted the data as evidence of extremely narrow jet). As noted above, this kind of jet could produce afterglow visible from large off-axis angles. In any case, the afterglow will be seen from wider range of angle soon after the jet break.
GRB 221009A is among the brightest electromagnetic bursts ever seen, its luminosity exceeded only by galactic magnetar flares and solar flares. In fact, it is likely to be the most luminous nearby electromagnetic burst we know (Burns et al. 2023). Assuming GRB 221009A rate of 1 in 10 000 years (Burns et al. 2023) and opening angle of 4 deg (Williams et al. 2023), analogs of GRB 221009A could occur every 46 month at the same distance as GRB 221009A, but pointing away from us. At 726 Mpc, an off-axis view of GRB 221009A might not be very remarkable and easy to miss, even if the implications of such a detection would be quite remarkable. Detailed investigations of possible hard X-ray signatures of off-axis GRBs are beyond the scope of this work.
6. Summary
It remains unclear why some GRBs reveal hard X-ray afterglow bright relative to the prompt emission, such as GRB 120711A (Martin-Carrillo et al. 2014), while others with comparable peak fluxes do not, as in the case of GRB 041219A (McBreen et al. 2006). In the rare case of GRB 221009A, INTEGRAL was able to provide a unique measurement of the hard X-ray afterglow, complementing the GRB SED in a usually inaccessible energy range up to about 200 keV at 1 day and up to 20 keV at 7 days. INTEGRAL provided a high-coverage (58%) monitoring for the week following the event, excluding the presence of any additional flares in the afterglow. The SPI detector on board INTEGRAL was sufficiently attenuated by its shield to record an almost unbiased temporal profile of the event, revealing its true intensity profile and allowing an estimate of the total prompt fluence. Overall, GRB 221009A has allowed us to study the hard X-ray emission from a single event in an unprecedentedly dynamic range of eight orders of magnitude. In the case of GRB 221009A, the detectability of the afterglow was likely due to both GRB proximity and overall luminosity. However, further investigations in combination with other instruments are needed.
Since GRB emission is beamed, for every bright observed GRB, there are potentially thousands of others at the same distance and with the same intrinsic energetics that are pointing away from us. While this off-axis configuration makes much of the brightest prompt emission unobservable, a decelerating jet might become visible at a later stage. There is a divergence of opinions on what can be expected from a side-view of such an energetic jet: it has not been clear whether prompt emission from the off-axis jet would be detectable (e.g., Berger 2014) and detection of off-axis prompt GRB 170817A associated with GW 170817 was (to a certain extent) a surprise. The existence of hard X-ray emission for a week after the event (long after a presumed jet break) suggests that off-axis events might feature long-lasting hard X-ray counterparts as well. The large FoV of the INTEGRAL instruments is well suited to search for these counterparts in the relatively large localization regions of GW events at present.
There is a difference between this “event saturation” and “rate saturation”, the latter of which is instead caused by the count rate approaching a deadtime-limited value or by telemetry constraints.
Acknowledgments
Based on observations with INTEGRAL, an ESA project with instruments and science data centre funded by ESA member states (especially the PI countries: Denmark, France, Germany, Italy, Switzerland, Spain) and with the participation of Russia and the USA. We are grateful to the INTEGRAL Ground Segment team for scheduling the observations exceptionally quickly, even though the ToO request was sent by the proposal PI with some delay comparing to the best case scenario. The Italian co-authors acknowledge ASI/INAF Accordo 2019-35-HH.0. We are thankful to ORD, EOSC, and everybody who supports open science enabled with innovative technologies. In addition to the software quoted in the Letter, we used astropy package (Astropy Collaboration 2013). MMODA (Neronov et al. 2021) is hosted by University of Geneva and leverages software distributed by ISDC (Courvoisier et al. 2003).
References
- Abbott, B. P., Abbott, R., Abbott, T. D., et al. 2017a, ApJ, 848, L13 [CrossRef] [Google Scholar]
- Abbott, B. P., Abbott, R., Abbott, T. D., et al. 2017b, ApJ, 848, L12 [Google Scholar]
- Abbott, B. P., Abbott, R., Abbott, T. D., et al. 2020, Phys. Rev. D, 101, 084002 [NASA ADS] [CrossRef] [Google Scholar]
- Abdalla, H., Adam, R., Aharonian, F., et al. 2019, Nature, 575, 464 [Google Scholar]
- Abdo, A. A., Ackermann, M., Ajello, M., et al. 2009, ApJ, 706, L138 [NASA ADS] [CrossRef] [Google Scholar]
- Ajello, M., Arimoto, M., Axelsson, M., et al. 2019, ApJ, 878, 52 [NASA ADS] [CrossRef] [Google Scholar]
- Astropy Collaboration (Robitaille, T. P., et al.) 2013, A&A, 558, A33 [NASA ADS] [CrossRef] [EDP Sciences] [Google Scholar]
- Atteia, J. L. 2022, GRB Coordinates Network, 32793 [Google Scholar]
- Band, D., Matteson, J., Ford, L., et al. 1993, ApJ, 413, 281 [Google Scholar]
- Berger, E. 2014, ARA&A, 52, 43 [CrossRef] [Google Scholar]
- Bloom, J. S., Perley, D. A., Li, W., et al. 2009, ApJ, 691, 723 [NASA ADS] [CrossRef] [Google Scholar]
- Burns, E., Svinkin, D., Fenimore, E., et al. 2023, ApJ, 946, L31 [NASA ADS] [CrossRef] [Google Scholar]
- Campana, S., Lazzati, D., Perna, R., Grazia Bernardini, M., & Nava, L. 2021, A&A, 649, A135 [NASA ADS] [CrossRef] [EDP Sciences] [Google Scholar]
- Campana, S., Ghirlanda, G., Salvaterra, R., et al. 2022, Nat Astron., 6, 1101 [NASA ADS] [CrossRef] [Google Scholar]
- Corsi, A., Piro, L., Kuulkers, E., et al. 2005, A&A, 438, 829 [NASA ADS] [CrossRef] [EDP Sciences] [Google Scholar]
- Courvoisier, T. J. L., Walter, R., Beckmann, V., et al. 2003, A&A, 411, L53 [NASA ADS] [CrossRef] [EDP Sciences] [Google Scholar]
- de Ugarte Postigo, A., Izzo, L., Thoene, C. C., et al. 2022, GRB Coordinates Network, 32800 [Google Scholar]
- Dichiara, S., Gropp, J. D., Kennea, J. A., et al. 2022, GRB Coordinates Network, 32632 [Google Scholar]
- Droz, S., & Poisson, E. 1997, Phys. Rev. D, 56, 4449 [NASA ADS] [CrossRef] [Google Scholar]
- Foreman-Mackey, D., Hogg, D. W., Lang, D., & Goodman, J. 2013, PASP, 125, 306 [Google Scholar]
- Fossati, G., Maraschi, L., Celotti, A., Comastri, A., & Ghisellini, G. 1998, MNRAS, 299, 433 [Google Scholar]
- Frederiks, D., Svinkin, D., Lysenko, A. L., et al. 2023, ApJ, 949, L7 [NASA ADS] [CrossRef] [Google Scholar]
- Furlanetto, S., & Loeb, A. 2002, ApJ, 569, L91 [NASA ADS] [CrossRef] [Google Scholar]
- Ghisellini, G., Ghirlanda, G., Nava, L., & Celotti, A. 2010, MNRAS, 403, 926 [NASA ADS] [CrossRef] [Google Scholar]
- Gill, R., & Granot, J. 2023, MNRAS, 524, L78 [NASA ADS] [CrossRef] [Google Scholar]
- Goldstein, A., Connaughton, V., Briggs, M. S., & Burns, E. 2016, ApJ, 818, 18 [CrossRef] [Google Scholar]
- Götz, D., Gouiffès, C., Rodriguez, J., et al. 2019, New Astron. Rev., 87, 101537 [CrossRef] [Google Scholar]
- Gotz, D., Mereghetti, S., Savchenko, V., et al. 2022, GRB Coordinates Network, 32660 [Google Scholar]
- in’t Zand, J. J. M., Kuiper, L., Amati, L., et al. 2001, ApJ, 559, 710 [CrossRef] [Google Scholar]
- Ioka, K., Murase, K., Toma, K., Nagataki, S., & Nakamura, T. 2007, ApJ, 670, L77 [NASA ADS] [CrossRef] [Google Scholar]
- Kann, D. A., Agayeva, S., Aivazyan, V., et al. 2023, ApJ, 948, L12 [NASA ADS] [CrossRef] [Google Scholar]
- Kouveliotou, C., Granot, J., Racusin, J. L., et al. 2013, ApJ, 779, L1 [NASA ADS] [CrossRef] [Google Scholar]
- Kuiper, L., Hermsen, W., Walter, R., & Foschini, L. 2003, A&A, 411, L31 [NASA ADS] [CrossRef] [EDP Sciences] [Google Scholar]
- Kuulkers, E., Ferrigno, C., Kretschmar, P., et al. 2021, New Astron. Rev., 93, 101629 [CrossRef] [Google Scholar]
- Labanti, C., Di Cocco, G., Ferro, G., et al. 2003, A&A, 411, L149 [NASA ADS] [CrossRef] [EDP Sciences] [Google Scholar]
- Laskar, T., Alexander, K. D., Margutti, R., et al. 2023, ApJ, 946, L23 [NASA ADS] [CrossRef] [Google Scholar]
- Lebrun, F., Leray, J. P., Lavocat, P., et al. 2003, A&A, 411, L141 [NASA ADS] [CrossRef] [EDP Sciences] [Google Scholar]
- Li, J.-D., Gao, H., Ai, S., & Lei, W.-H. 2023, MNRAS, 525, 6285 [NASA ADS] [CrossRef] [Google Scholar]
- Lund, N., Budtz-Jørgensen, C., Westergaard, N. J., et al. 2003, A&A, 411, L231 [NASA ADS] [CrossRef] [EDP Sciences] [Google Scholar]
- MAGIC Collaboration (Acciari, V. A., et al.) 2019, Nature, 575, 455 [Google Scholar]
- Maiorano, E., Masetti, N., Palazzi, E., et al. 2005, A&A, 438, 821 [NASA ADS] [CrossRef] [EDP Sciences] [Google Scholar]
- Martin-Carrillo, A., Hanlon, L., Topinka, M., et al. 2014, A&A, 567, A84 [NASA ADS] [CrossRef] [EDP Sciences] [Google Scholar]
- Mas-Hesse, J. M., Giménez, A., Culhane, J. L., et al. 2003, A&A, 411, L261 [NASA ADS] [CrossRef] [EDP Sciences] [Google Scholar]
- Maselli, A., Melandri, A., Nava, L., et al. 2014, Science, 343, 48 [NASA ADS] [CrossRef] [Google Scholar]
- McBreen, S., Hanlon, L., McGlynn, S., et al. 2006, A&A, 455, 433 [NASA ADS] [CrossRef] [EDP Sciences] [Google Scholar]
- Mereghetti, S., Götz, D., Borkowski, J., Walter, R., & Pedersen, H. 2003, A&A, 411, L291 [NASA ADS] [CrossRef] [EDP Sciences] [Google Scholar]
- Morozova, V., Radice, D., Burrows, A., & Vartanyan, D. 2018, ApJ, 861, 10 [CrossRef] [Google Scholar]
- Neronov, A., Savchenko, V., Tramacere, A., et al. 2021, A&A, 651, A97 [NASA ADS] [CrossRef] [EDP Sciences] [Google Scholar]
- O’Connor, B., Troja, E., Ryan, G., et al. 2023, Sci Adv., 9, eadi1405 [CrossRef] [Google Scholar]
- Paczynski, B. 1991, Acta Astron., 41, 257 [NASA ADS] [Google Scholar]
- Pannarele, F. 2022, GRB Coordinates Network, 32877 [Google Scholar]
- Rodi, J., & Ubertini, P. 2023, A&A, 677, L3 [NASA ADS] [CrossRef] [EDP Sciences] [Google Scholar]
- Ryde, F., Axelsson, M., Zhang, B. B., et al. 2010, ApJ, 709, L172 [Google Scholar]
- Salafia, O. S., & Ghirlanda, G. 2022, Galaxies, 10, 93 [NASA ADS] [CrossRef] [Google Scholar]
- Savchenko, V., Bazzano, A., Bozzo, E., et al. 2017a, A&A, 603, A46 [NASA ADS] [CrossRef] [EDP Sciences] [Google Scholar]
- Savchenko, V., Ferrigno, C., Kuulkers, E., et al. 2017b, ApJ, 848, L15 [NASA ADS] [CrossRef] [Google Scholar]
- Shrestha, M., Sand, D. J., Alexander, K. D., et al. 2023, ApJ, 946, L25 [NASA ADS] [CrossRef] [Google Scholar]
- Springel, V., White, S. D. M., Jenkins, A., et al. 2005, Nature, 435, 629 [Google Scholar]
- Szczepańczyk, M. J., Salemi, F., Bini, S., et al. 2023, Phys. Rev. D, 107, 062002 [CrossRef] [Google Scholar]
- Tiengo, A., Pintore, F., Vaia, B., et al. 2023, ApJ, 946, L30 [NASA ADS] [CrossRef] [Google Scholar]
- Vedrenne, G., Roques, J.-P., Schönfelder, V., et al. 2003, A&A, 411, L63 [CrossRef] [EDP Sciences] [Google Scholar]
- von Kienlin, A., Meegan, C. A., Paciesas, W. S., et al. 2020, ApJ, 893, 46 [Google Scholar]
- Williams, M. A., Kennea, J. A., Dichiara, S., et al. 2023, ApJ, 946, L24 [NASA ADS] [CrossRef] [Google Scholar]
- Winkler, C., Courvoisier, T. J.-L., Di Cocco, G., et al. 2003, A&A, 411, L1 [NASA ADS] [CrossRef] [EDP Sciences] [Google Scholar]
- Yonetoku, D., Murakami, T., Nakamura, T., et al. 2004, ApJ, 609, 935 [Google Scholar]
- Zhang, H.-M., Huang, Y.-Y., Liu, R.-Y., & Wang, X.-Y. 2023, ApJ, 956, L21 [CrossRef] [Google Scholar]
All Figures
|
Fig. 1. GRB 221009A prompt emission light curves (background-subtracted) as recorded by INTEGRAL instruments: SPI, SPI-ACS, and IBIS/PICsIT. All rates except for SPI-ACS are normalized to match the SPI-ACS rate. The SPI-ACS rate is affected by saturation for count rates above about 1.8 × 10⁶ counts s−1 and for PICsIT by the INTEGRAL buffer limit. Inset shows the different count rate range (in the same time range), highlighting combined SPI (Germanium detectors) rate (only moderately affected by dead-time), giving some insight on the true intensity of the primary emission episode comparing to the rest of the signal. Vertical dashed lines represent boundaries of the INTEGRAL pointings (see details in Sect. 2). Gray shaded regions represent emission episodes used for estimating fluence. |
| In the text | |
|
Fig. 2. SPI GeD detector rates (summed over all detectors), strongly attenuated by SPI-ACS material. The high-energy (above 8 MeV) rate counter highlights very hard narrow pulses (see details in Sect. 2). The two rates are scaled to make the count rate in the 250−270 s time interval is the same height between two rate curves. This figure demonstrates clear detection of the prompt emission above 8 MeV, and the reveals that the first of the two pulses shown is considerably harder, in agrement with Konus-Wind observations (Frederiks et al. 2023). |
| In the text | |
|
Fig. 3. GRB 221009A prompt emission and afterglow lightcurve (top). All count rates are converted to a spectral energy density at 50 keV assuming powerlaw spectrum with a slope of −2. This spectrum is applicable for the afterglow, but implies that the prompt lightcurve in this plot is only indicative. Note: the “all-sky” observations are also available between 0.1 and 1 days after the event, but the uncertainty due to the remaining background variations does not allow for a measurement to be made within this time range. The gray dashed line represents a fit with a single powerlaw, acceptable given the response uncertainties. Red dashed line represent best fit model, consisting of powerlaw segments with two breaks. For details about the fitting see explanations in the text. GRB 221009A position relative to INTEGRAL spacecraft orientation, relevant for changes of the instrument response throughout the emission phases (bottom). The gray band indicates the range of orientations when the response changes by no more than 30%. The green band represents approximate FoV of INTEGRAL instruments. |
| In the text | |
|
Fig. 4. Deconvolved INTEGRAL spectra of the afterglow emission. When data points have negative mean value, a 3-σ upper limit is shown instead. Gray line represents the best fit model and the gray band – model envelope of 90% confidence range. IBIS/ISGRI and JEM-X spectra from 91 ks to 137 ks since T0 (2022-10-10 14:31:40 to 2022-10-11 03:18:20) for a total exposure of 53.0 ks (top). IBIS/ISGRI, JEM-X and SPI spectra from 91 ks to 299 ks since T0 (2022-10-10 14:31:40 to 2022-10-13 00:18:20) for a total exposure of 172.0 ks (bottom). Note: the time intervals actually usable for spectral extraction by all instruments in each particular spectrum differs slightly (by tens of minutes) from the total observation time. Since differences are small relative to the observation duration, the implications of these differences for the analysis results are negligible. |
| In the text | |
Current usage metrics show cumulative count of Article Views (full-text article views including HTML views, PDF and ePub downloads, according to the available data) and Abstracts Views on Vision4Press platform.
Data correspond to usage on the plateform after 2015. The current usage metrics is available 48-96 hours after online publication and is updated daily on week days.
Initial download of the metrics may take a while.