Fig. 4.
Download original image
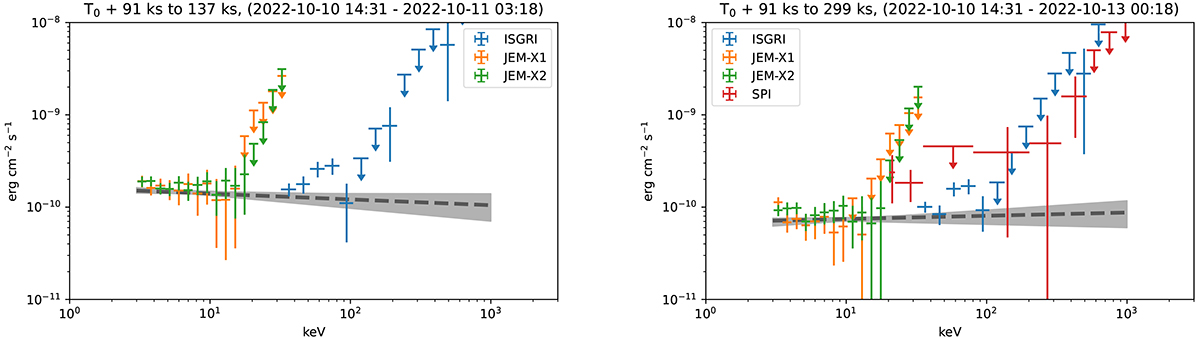
Deconvolved INTEGRAL spectra of the afterglow emission. When data points have negative mean value, a 3-σ upper limit is shown instead. Gray line represents the best fit model and the gray band – model envelope of 90% confidence range. IBIS/ISGRI and JEM-X spectra from 91 ks to 137 ks since T0 (2022-10-10 14:31:40 to 2022-10-11 03:18:20) for a total exposure of 53.0 ks (top). IBIS/ISGRI, JEM-X and SPI spectra from 91 ks to 299 ks since T0 (2022-10-10 14:31:40 to 2022-10-13 00:18:20) for a total exposure of 172.0 ks (bottom). Note: the time intervals actually usable for spectral extraction by all instruments in each particular spectrum differs slightly (by tens of minutes) from the total observation time. Since differences are small relative to the observation duration, the implications of these differences for the analysis results are negligible.
Current usage metrics show cumulative count of Article Views (full-text article views including HTML views, PDF and ePub downloads, according to the available data) and Abstracts Views on Vision4Press platform.
Data correspond to usage on the plateform after 2015. The current usage metrics is available 48-96 hours after online publication and is updated daily on week days.
Initial download of the metrics may take a while.